|
||||
|
2018 YTD: A Wild Ride
for San Francisco Real Estate
Mid-Year 2018 Report
————————————————————
By any measure, the heat of the San Francisco market in the first half of 2018 has been among the most blistering ever. Probably only 3 or 4 other periods over the past 50 years have seen a comparable intensity of buyer demand vis a vis the supply of listing inventory available to purchase. This despite both significant increases in interest rates and changes in federal tax law severely limiting the deductibility of mortgage interest and property tax costs. As mentioned before, the market is particularly ferocious in the lower and middle-price segments of house sales.
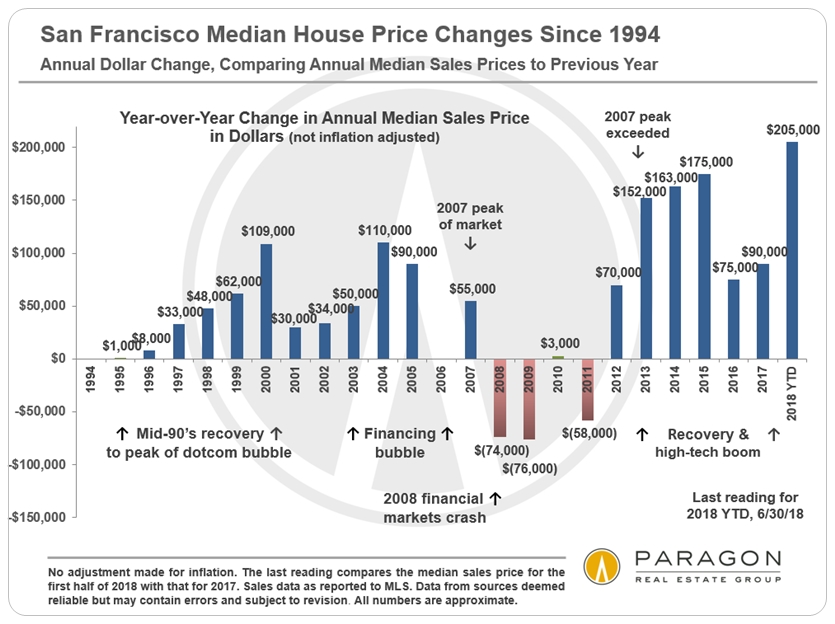
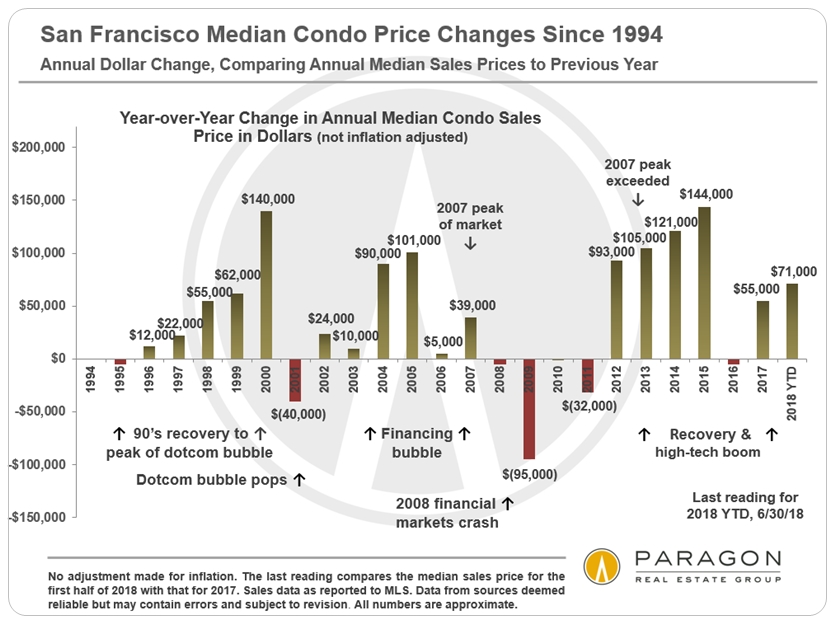
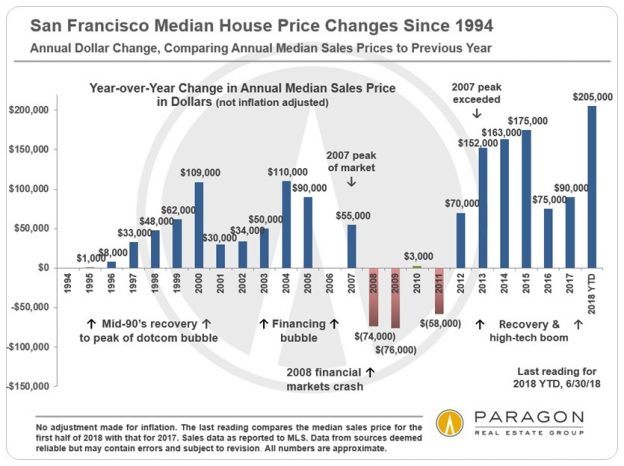
———————————————————— Annual Dollar Value Appreciation Appreciation is typically viewed through the lens of percentage changes, but looking at the actual increase in dollars paid for a median priced home is perhaps more visceral. These two charts below measure dollar increases in annual median sales prices for houses and then condos. The last columns in each chart measure 2018 YTD median sales price increases against the 2017 median sales price. (The links illustrate the traditional percentage changes.) Comparing the first half of 2018 to 2017, the median house sales price in San Francisco increased by an astounding $205,000 (per sales reported by 7/3/18). For condos, the increase was also very substantial, at about $71,000.
Link to PERCENTAGE rate appreciation chart: SF houses
It is not a given that the second half of the year will see home price appreciation at similar rates: Prices could increase further, or they might plateau or even tick down instead. (As can be seen above, home prices can go down as well as up, though longer term trends have always been positive.) For the last 7 years, spring has typically been the most feverish selling season of the year and has often provided most of the appreciation occurring in the full year. 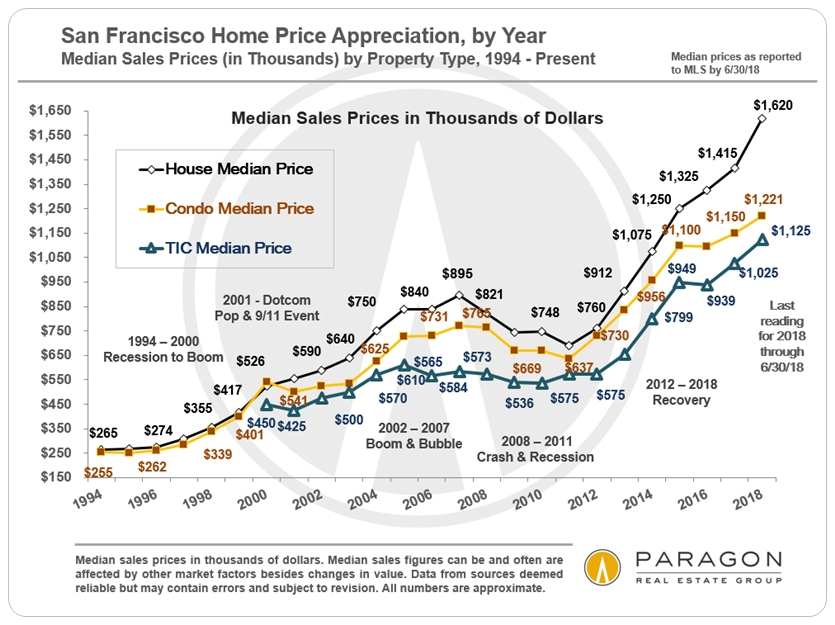
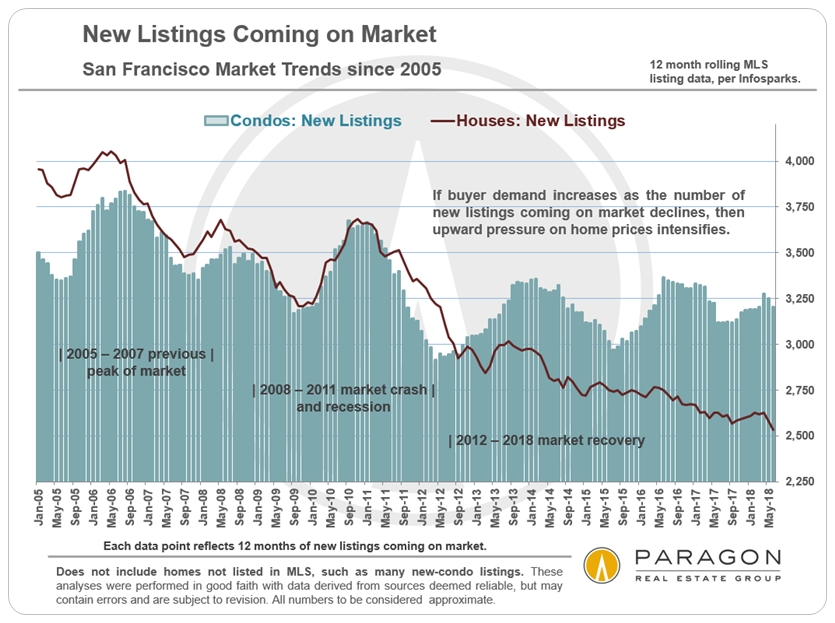
Median sales prices are often affected by other factors besides changes in fair ———————————————————— San Francisco Home Price Map We just updated our interactive map of median house and condo sales prices for the 70-odd San Francisco neighborhoods, reflecting the last 12 months sales reported to MLS. It can be accessed by clicking on this link: What Costs How Much Where in San Francisco. ———————————————————— Market Dynamics Statistics The decline in new listings, especially of houses, has been
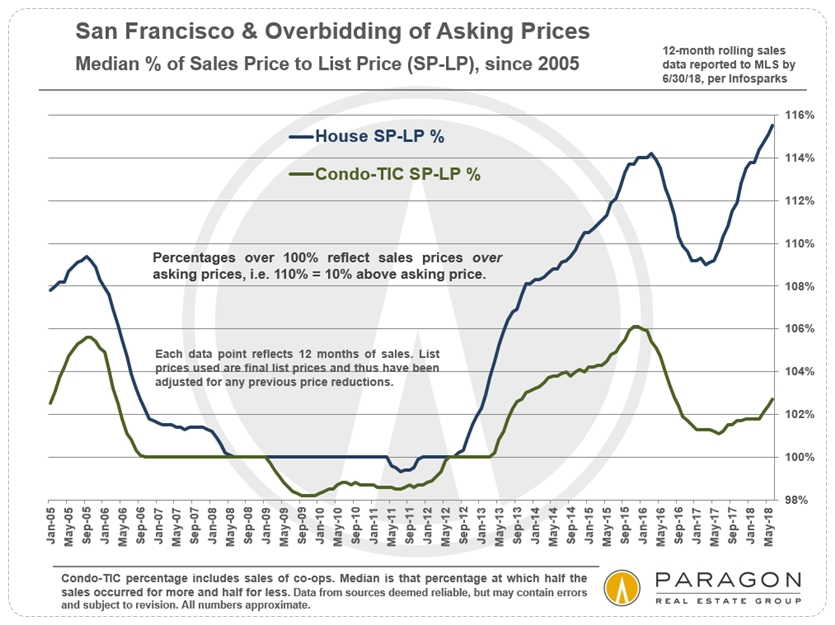
As houses have become the scarce resource in the SF market,
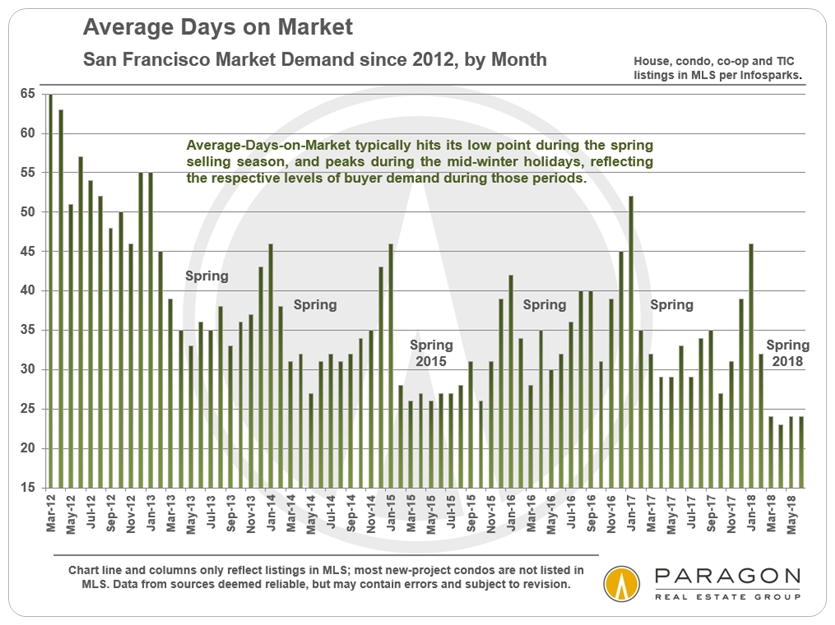
New lows in average days-on-market since the 2012 recovery began:
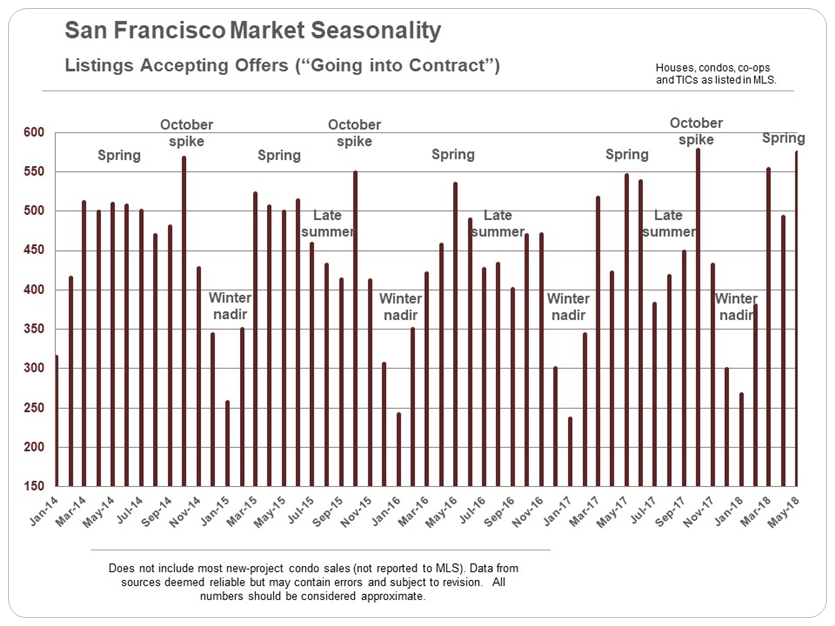
Market activity typically starts slowing significantly in July
————————————————————
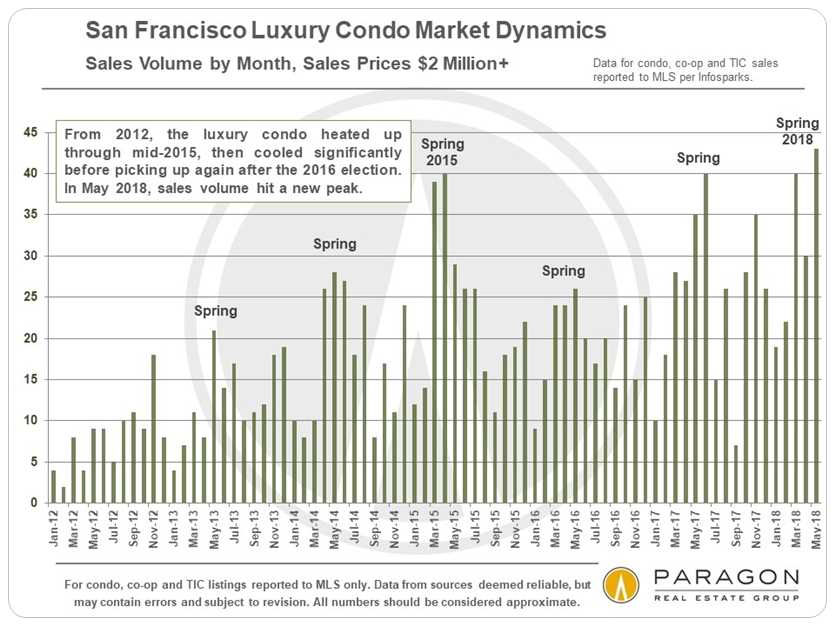
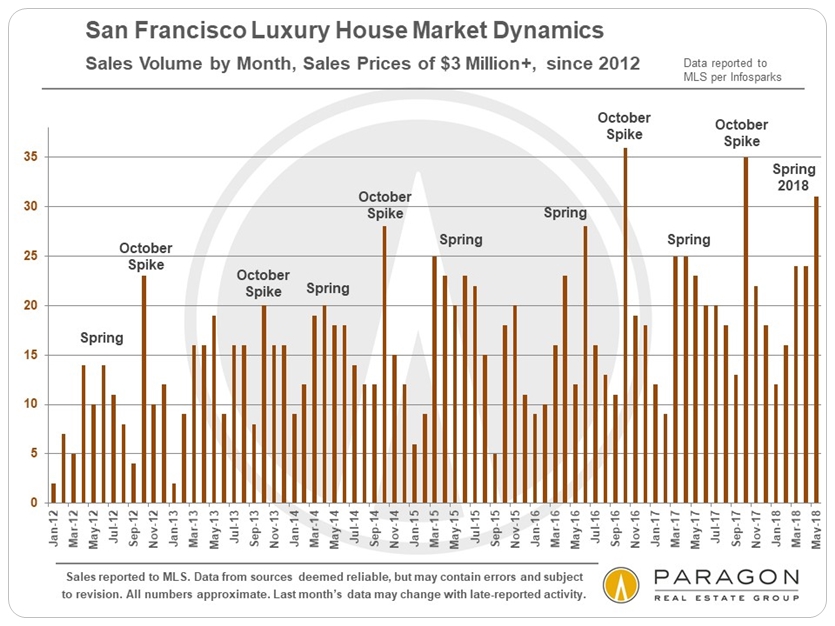
San Francisco Luxury Home Sales The second quarter of 2018 saw the highest quarterly number of SF homes selling for $2 million and above: When late-reported sales are entered into MLS, we expect the total to be over 320 for the 3-month period, far exceeding the previous high of 267 sales in Q2 2017. However, looking at higher-priced sales of $3m+, Q2 2018 is just a handful of transactions ahead of the Q2 2015 total of 97.
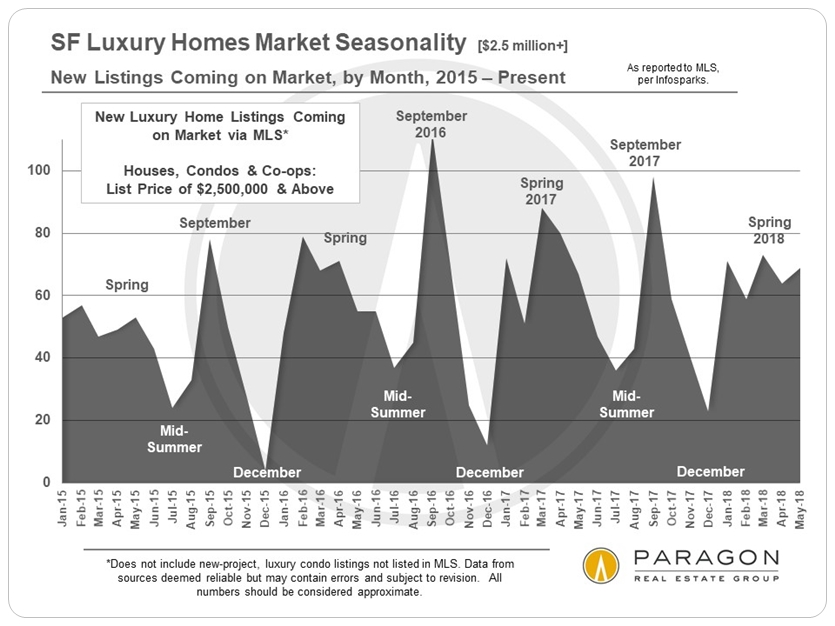
The luxury home market is even more intensely seasonal
Luxury condo sales in San Francisco hit a new high in May 2018.
For the last few years, luxury house sales have more often peaked in October.
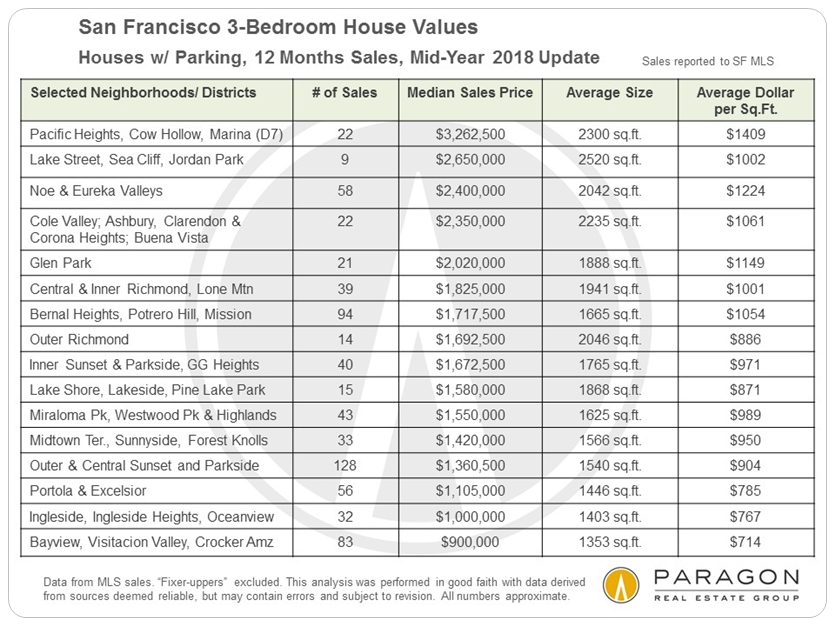
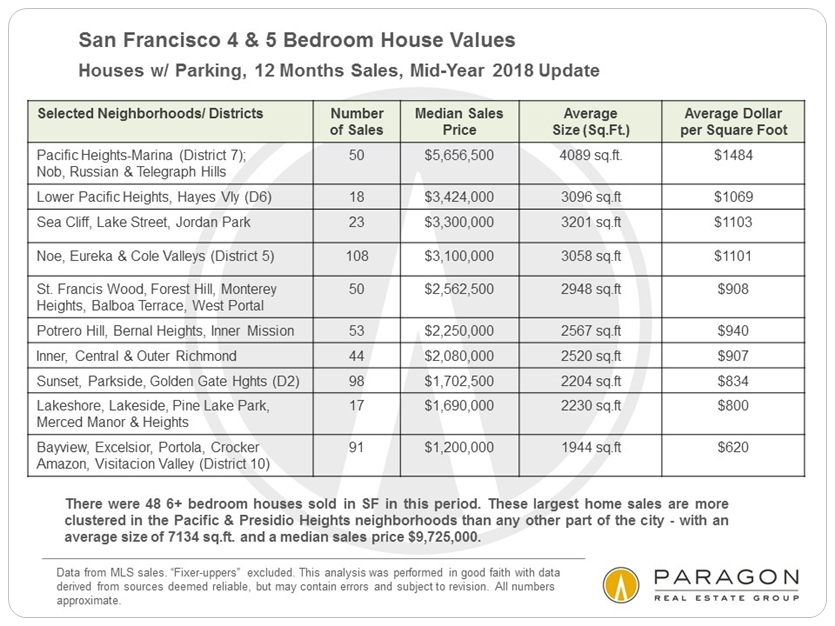
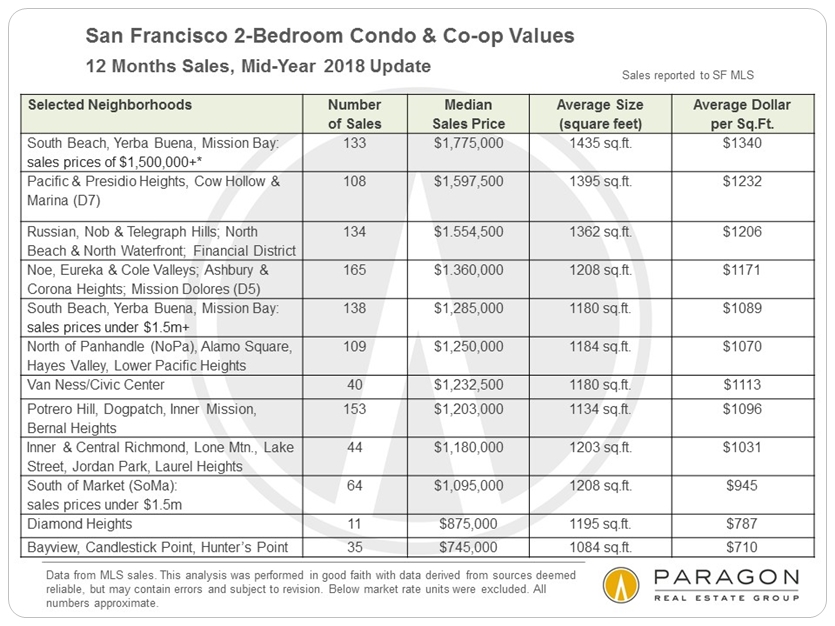
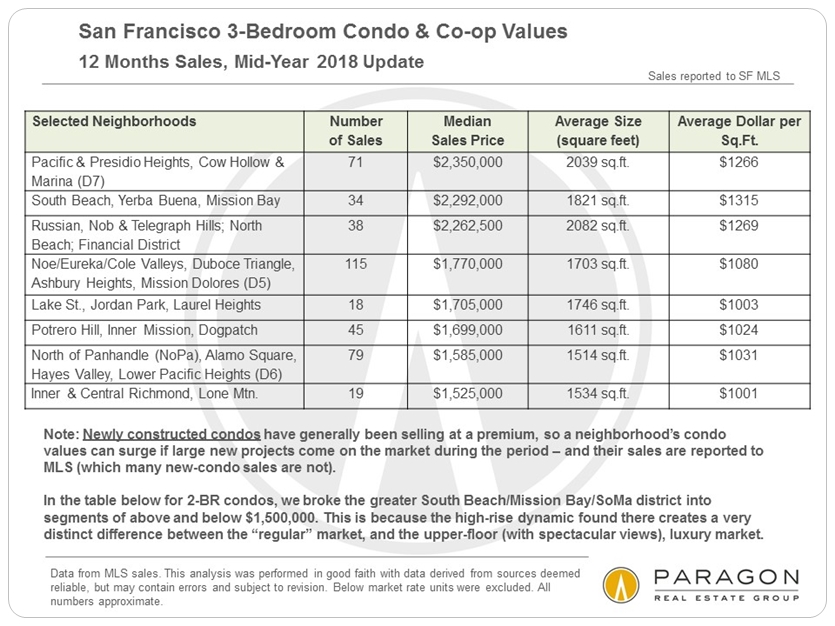
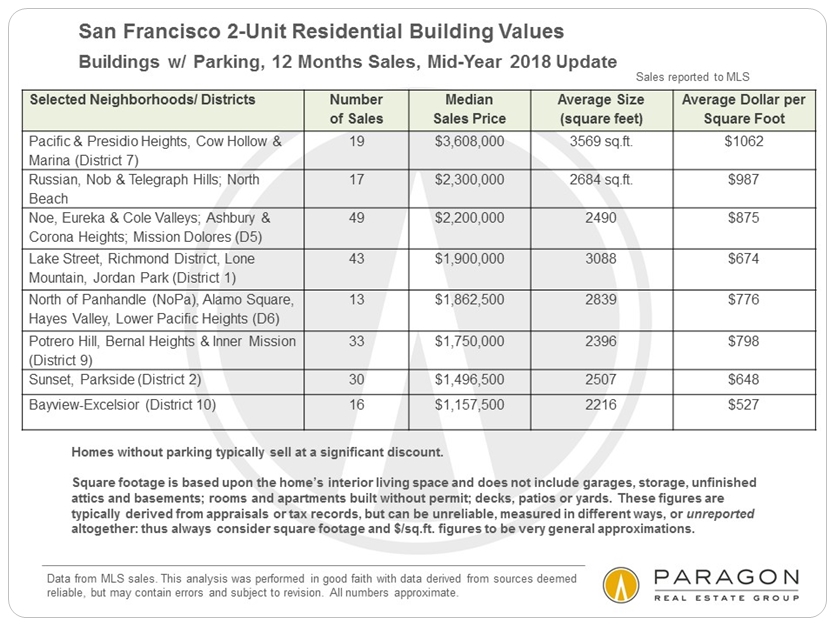
———————————————————— Neighborhood Home Prices & Trends Below are a few of the many new charts and tables from our updated report on neighborhood sales and values (What Costs How Much Where in San Francisco). Home Price Tables by Bedroom Count
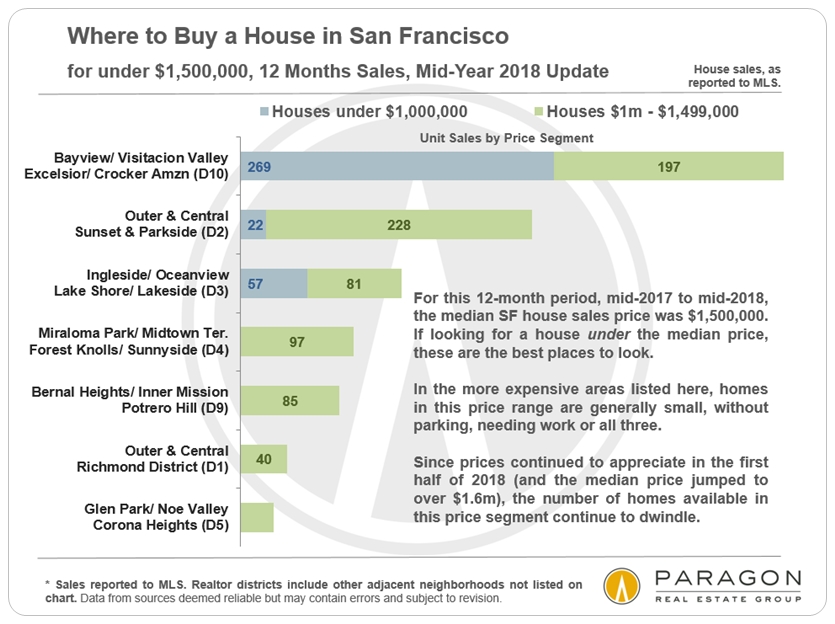
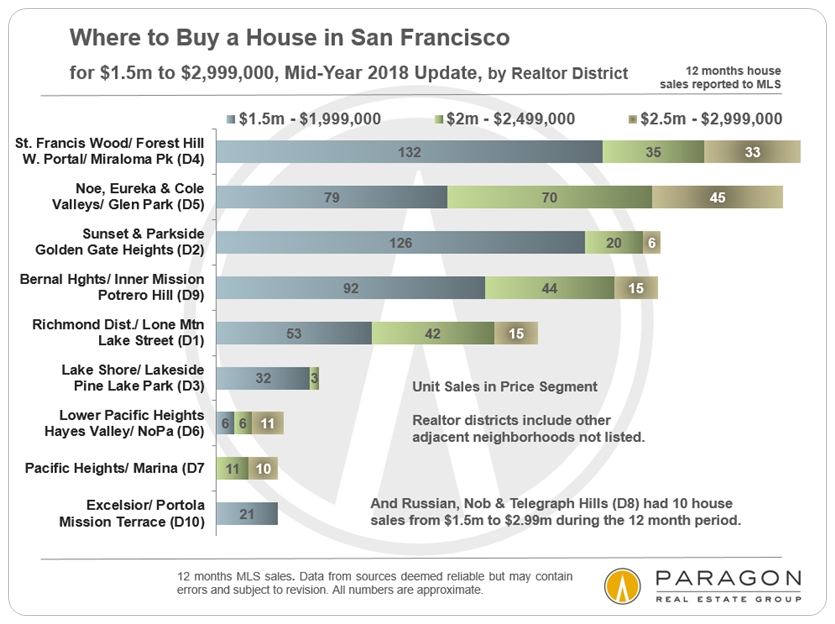
Where Best to Look in Your Price Range
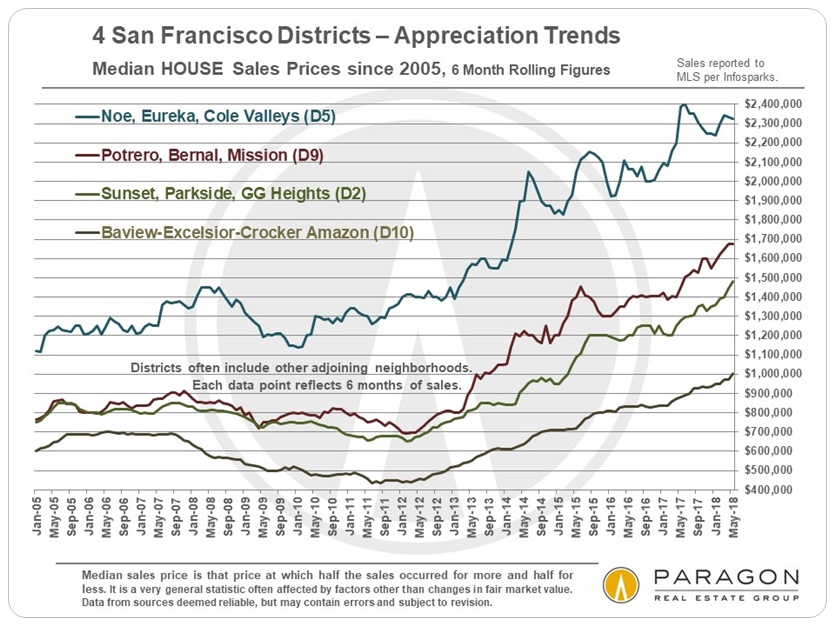
District Overview Appreciation Trends Median sales price appreciation in the four biggest districts
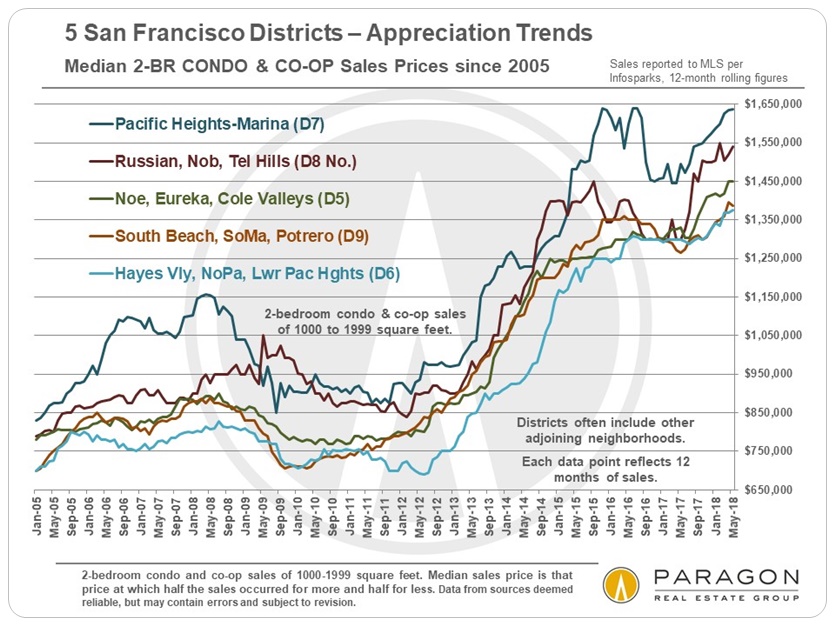
Median price appreciation for 2-bedroom condos and co-ops
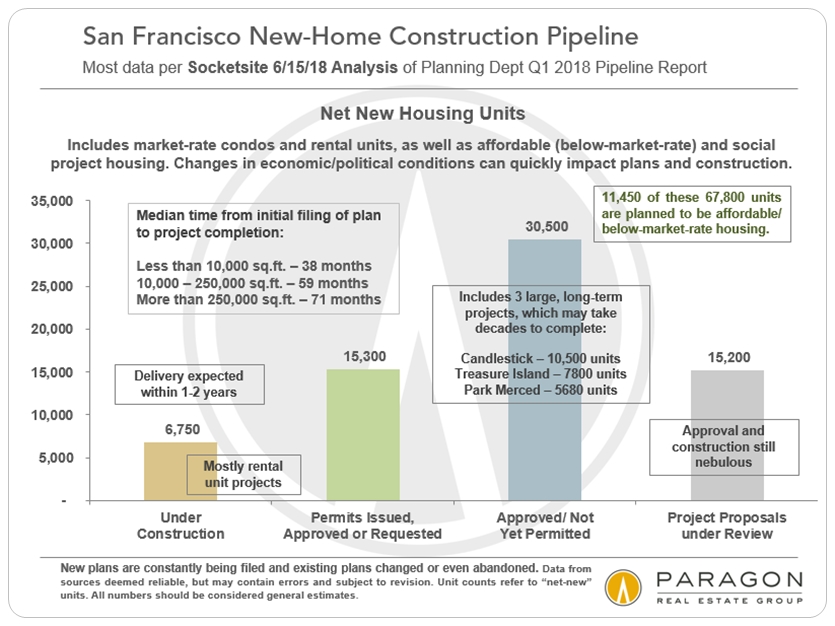
If you would like to see home prices or appreciation trends for a city district ———————————————————— The San Francisco Building Boom Approximately 68,000 housing units are now in the SF new construction pipeline. Virtually all of them are apartments or condos: New house construction is minimal in the city, and has been so for over 50 years. Condos, new and resale, are now the dominant property type in market sales volume. Just because a project is in the pipeline does not guarantee it will be built as planned. Plans are constantly being added, changed and abandoned. New housing construction is extremely sensitive to changes in economic conditions.
———————————————————— All our Bay Area real estate analyses can be found here: Paragon Market Reports ————————————————————
It is impossible to know how median and average value statistics apply to any particular home without a specific, tailored, comparative market analysis. In real estate, the devil is always in the details.
Median sales prices may change as late-reported sales are entered into MLS. Typically, such changes are not material to the overall trends illustrated. These analyses were made in good faith with data from sources deemed reliable, but may contain errors and are subject to revision. It is not our intent to convince you of a particular position, but to attempt to provide straightforward data and analysis, so you can make your own informed decisions. Median and average statistics are enormous generalities: There are hundreds of different markets in San Francisco and the Bay Area, each with its own unique dynamics. Median prices and average dollar per square foot values can be and often are affected by other factors besides changes in fair market value. Longer term trends are much more meaningful than short-term. © 2018 Paragon Real Estate Group
|
||||
|
No one knows San Francisco Bay Area real estate better than Paragon. |
||||
|