Hello and happy autumn! I hope this finds you well.
This newsletter has links to the following reports:
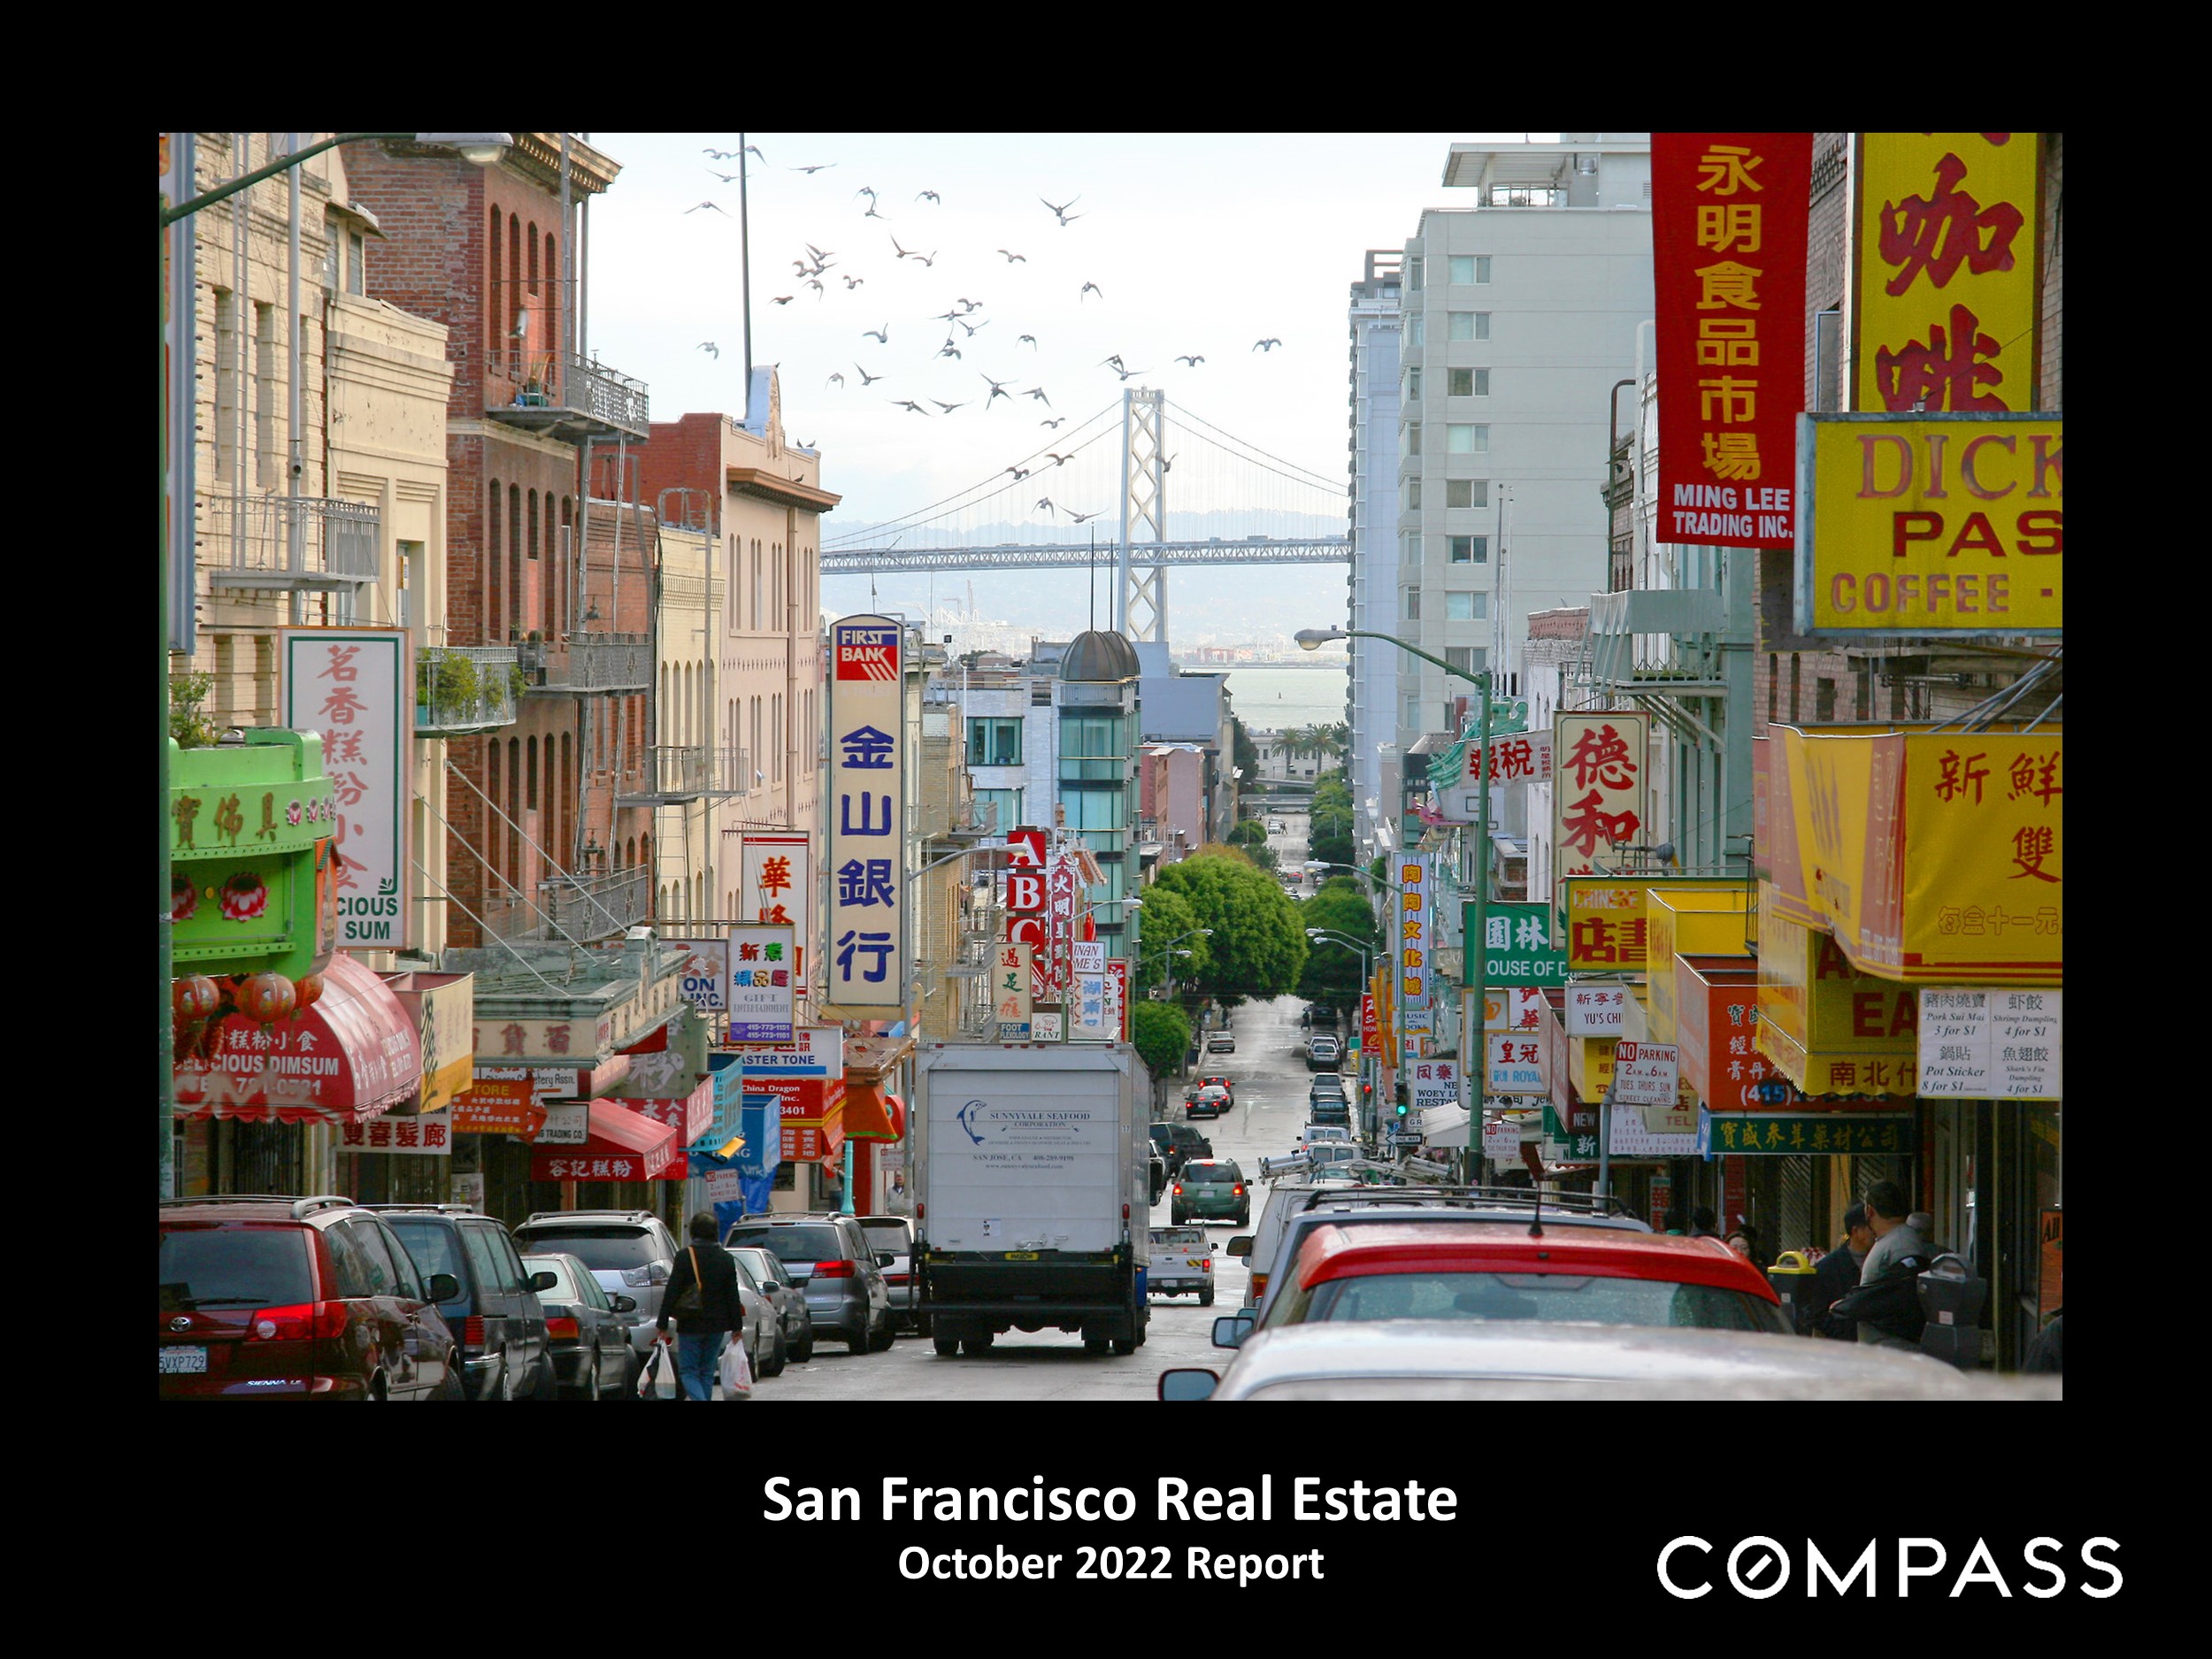
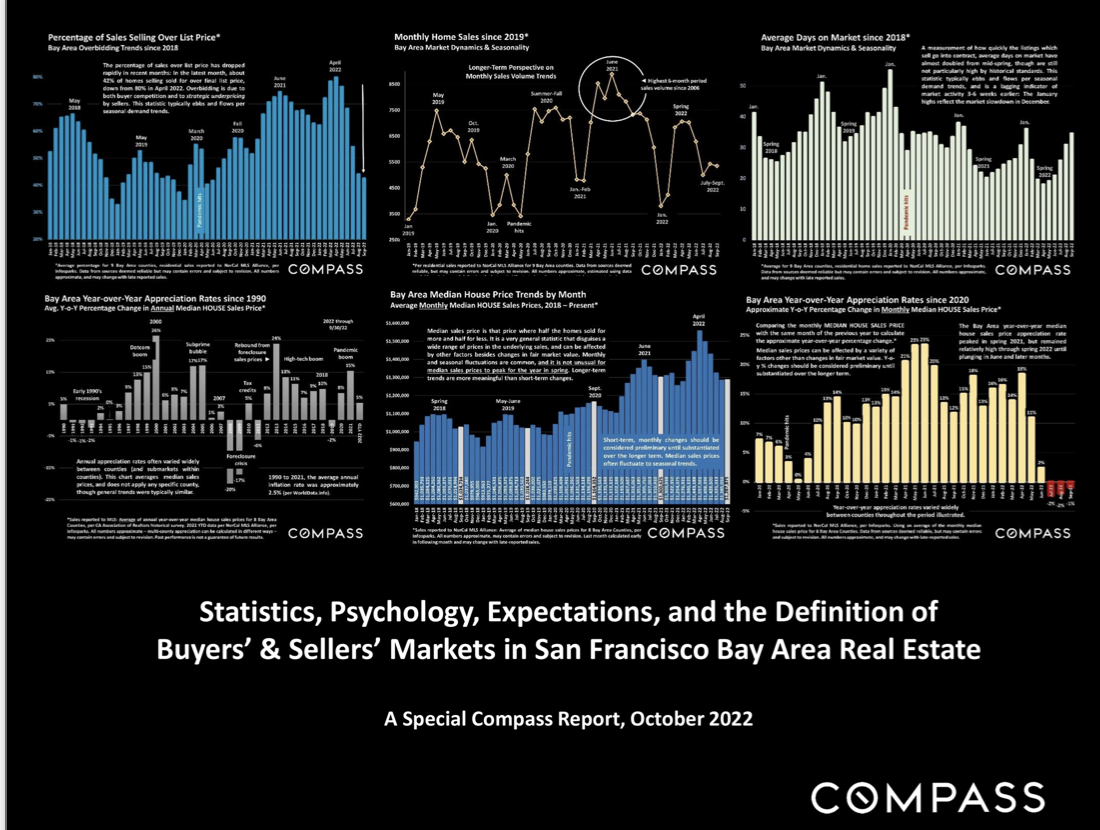
October 2022 SF real estate market
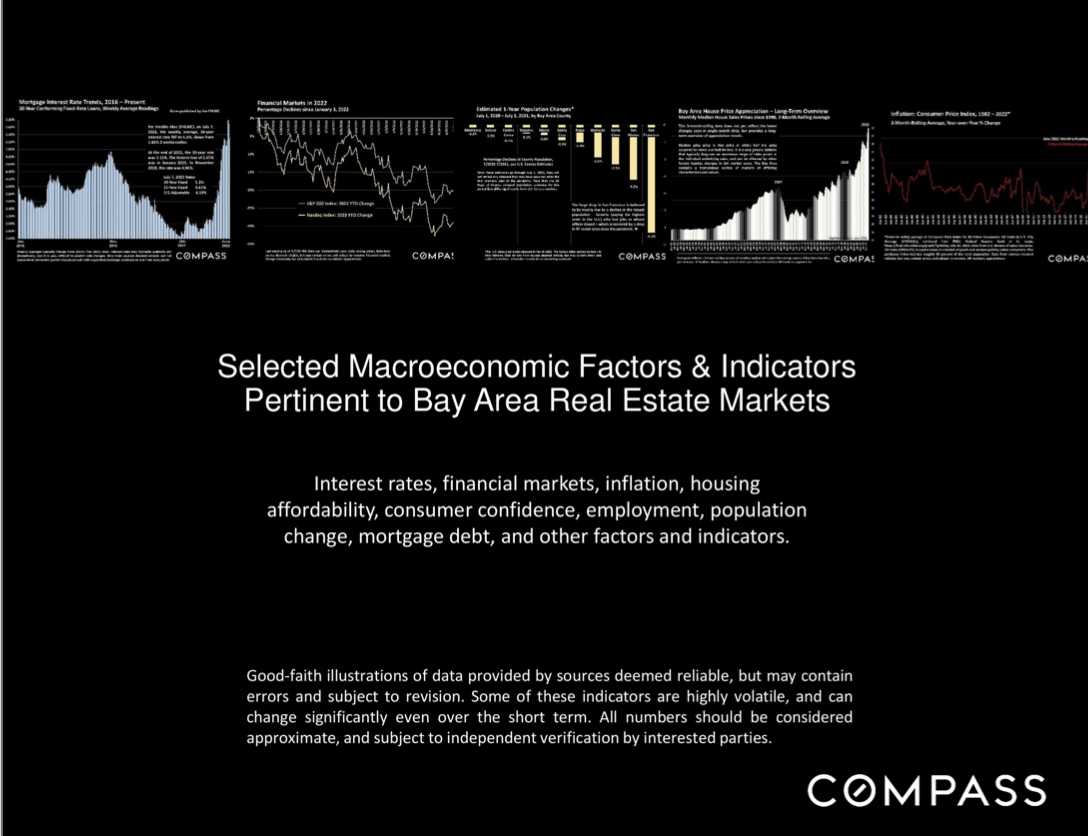
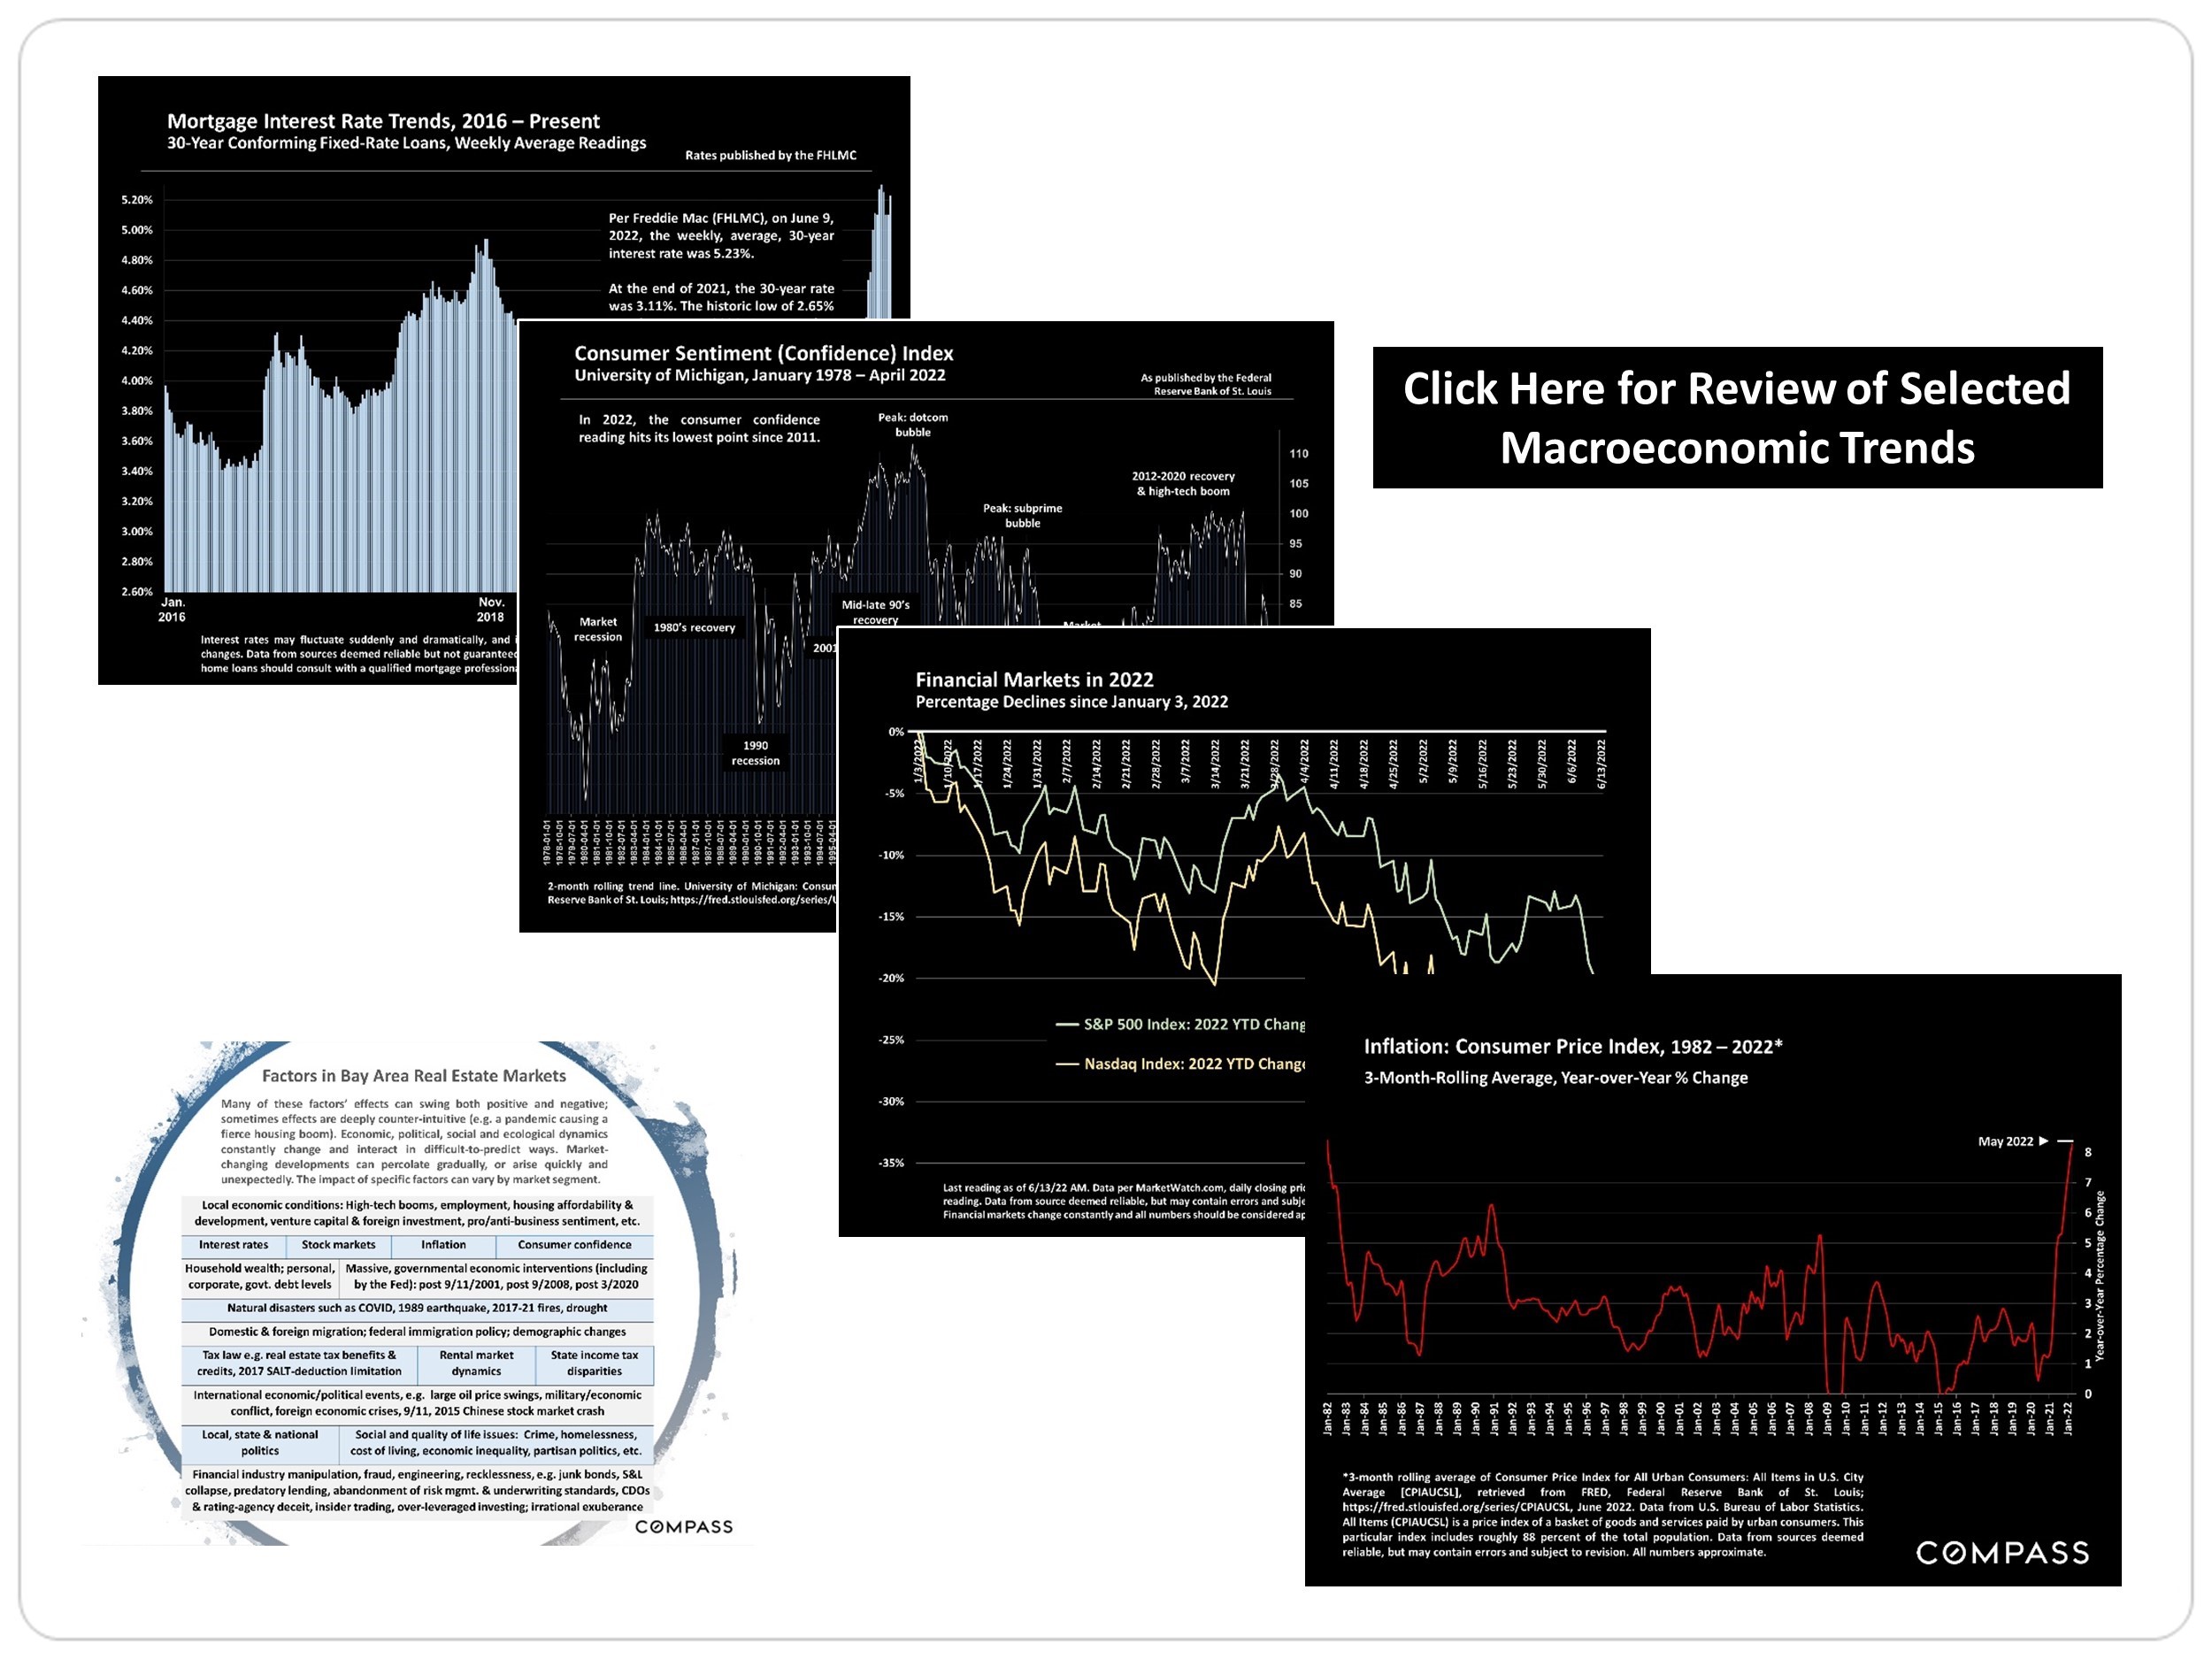
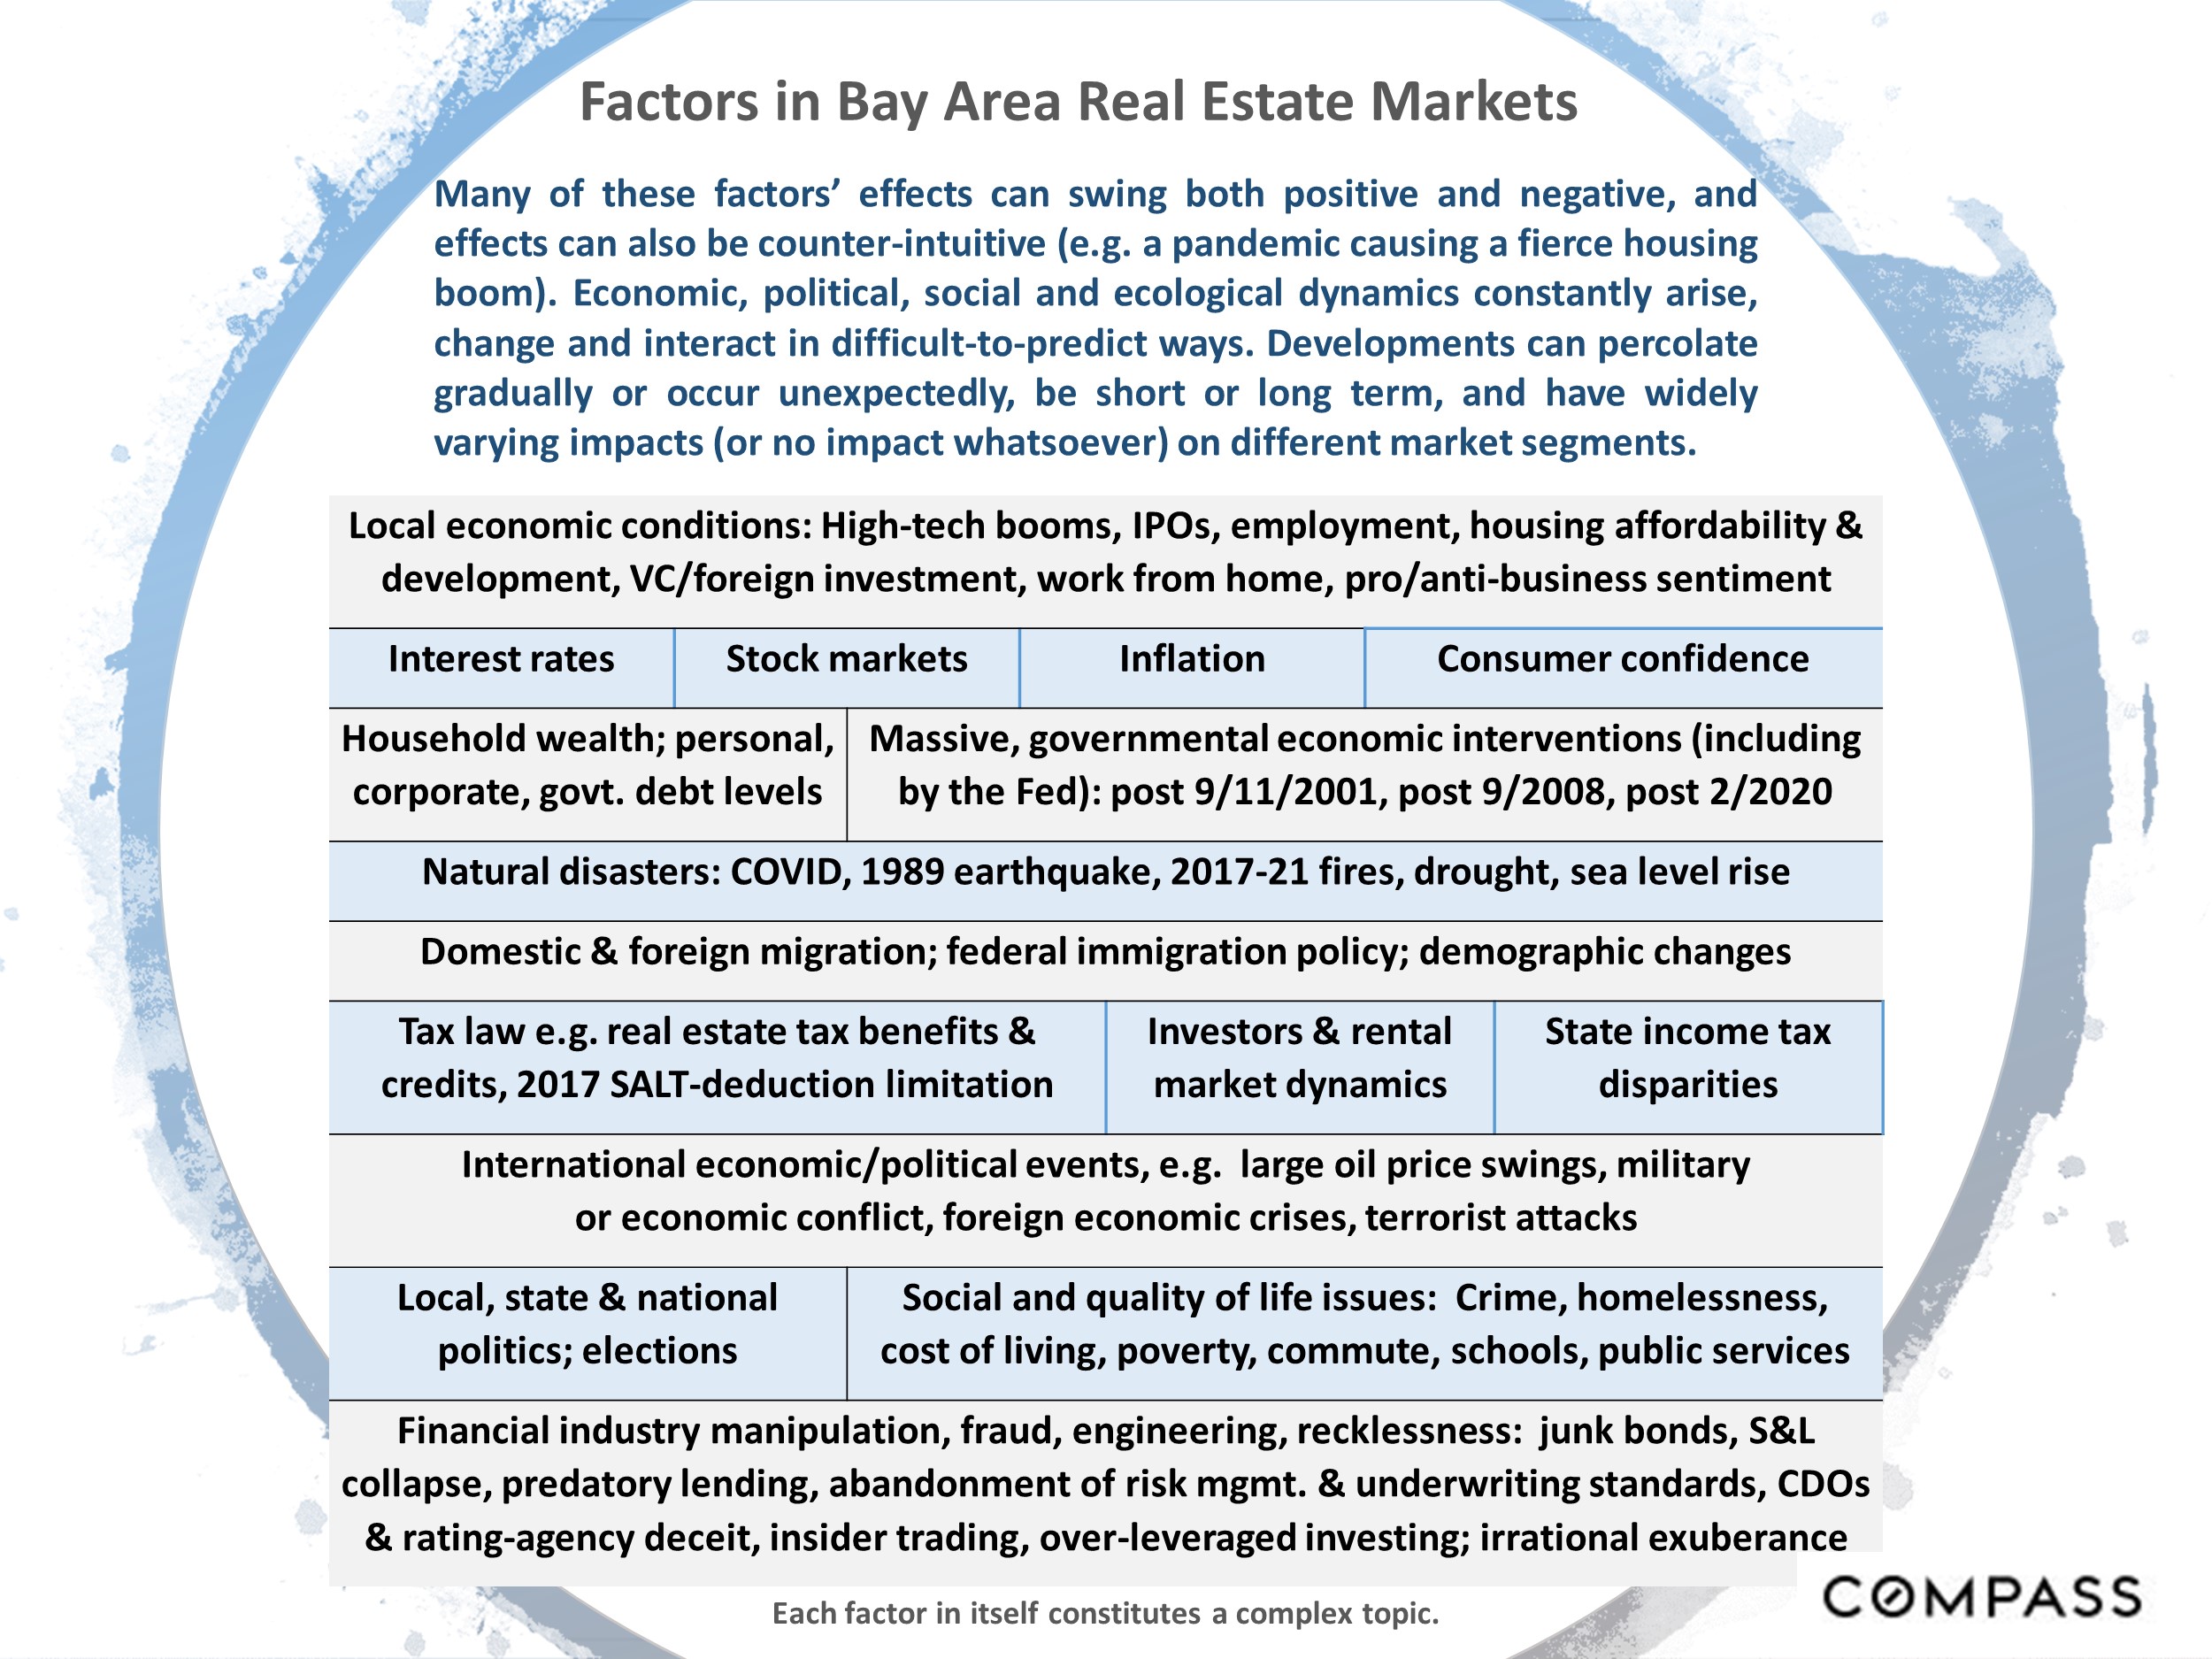
Macroeconomic indicators-Bay Area
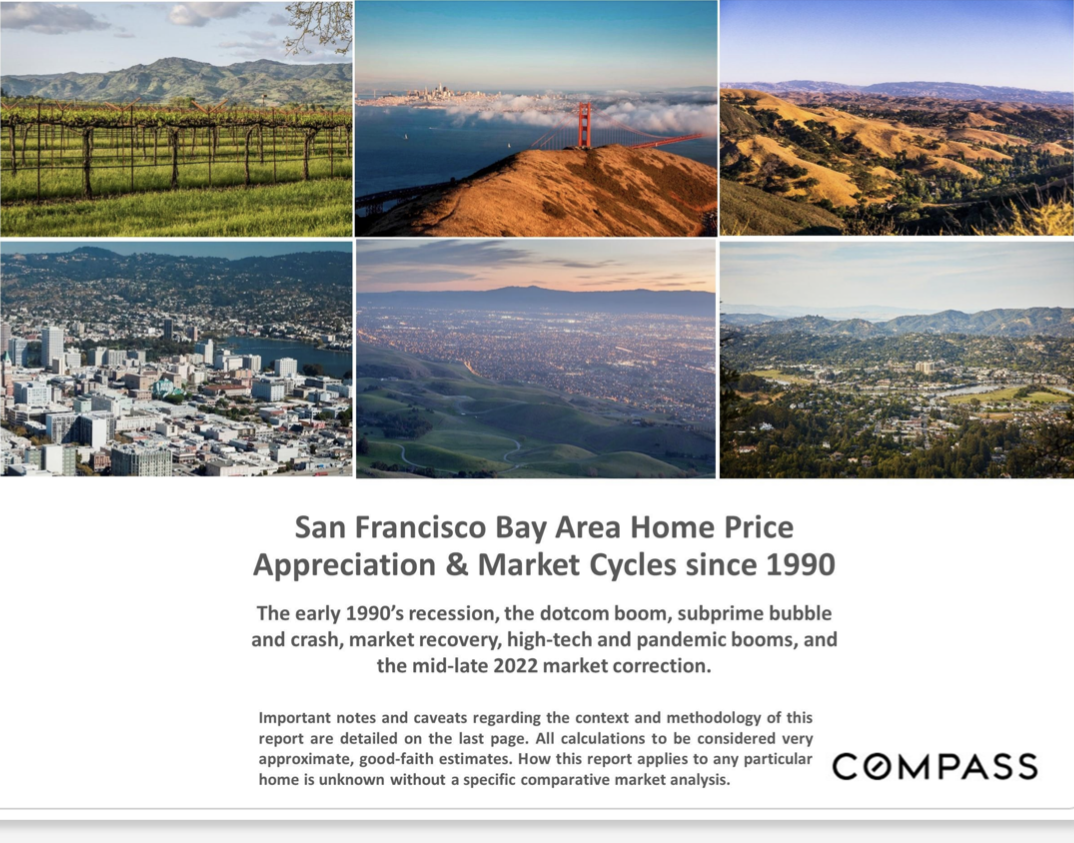
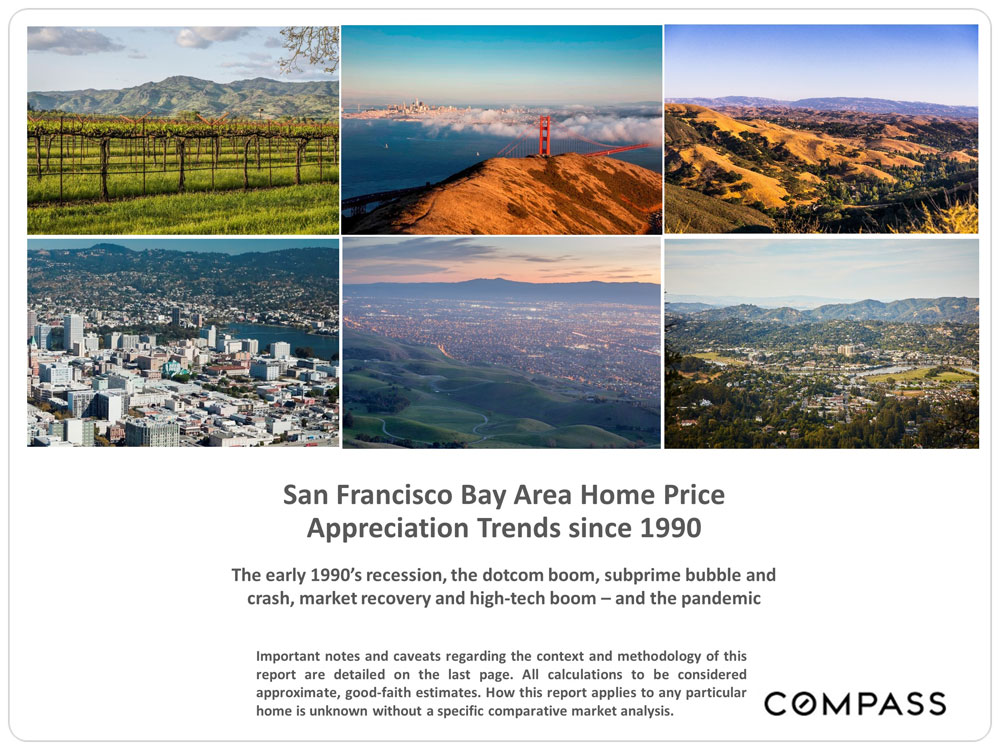
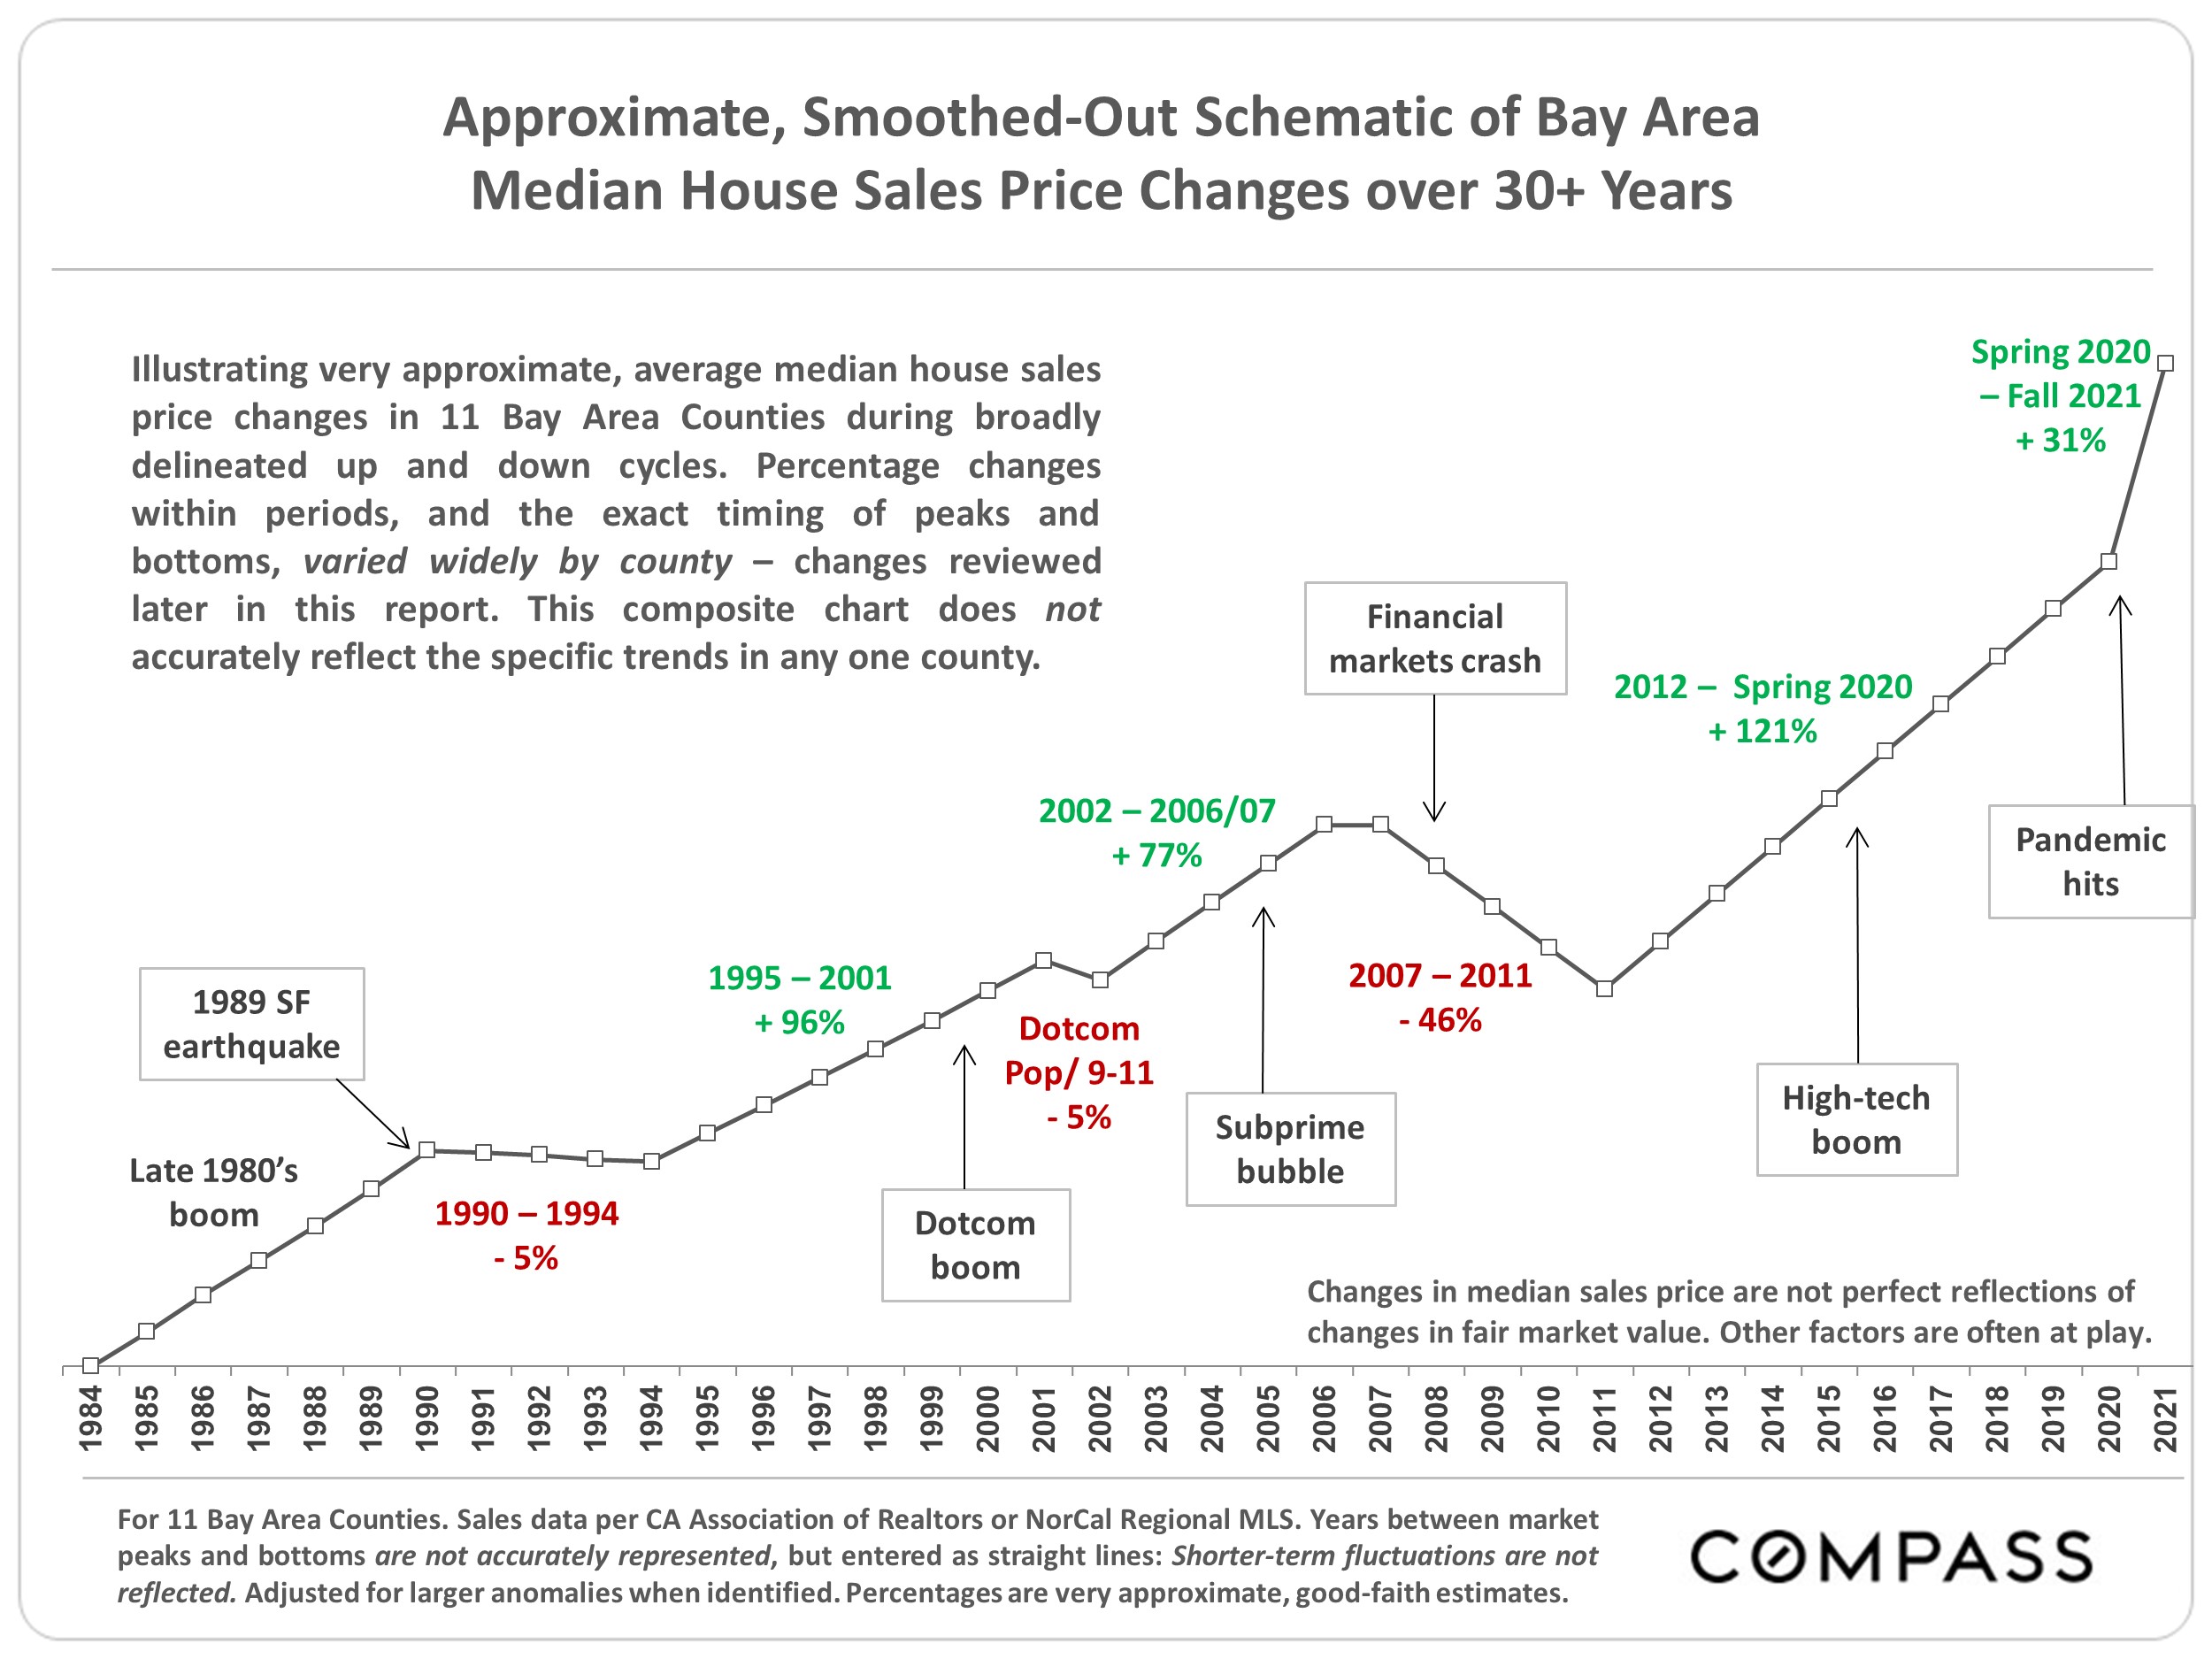
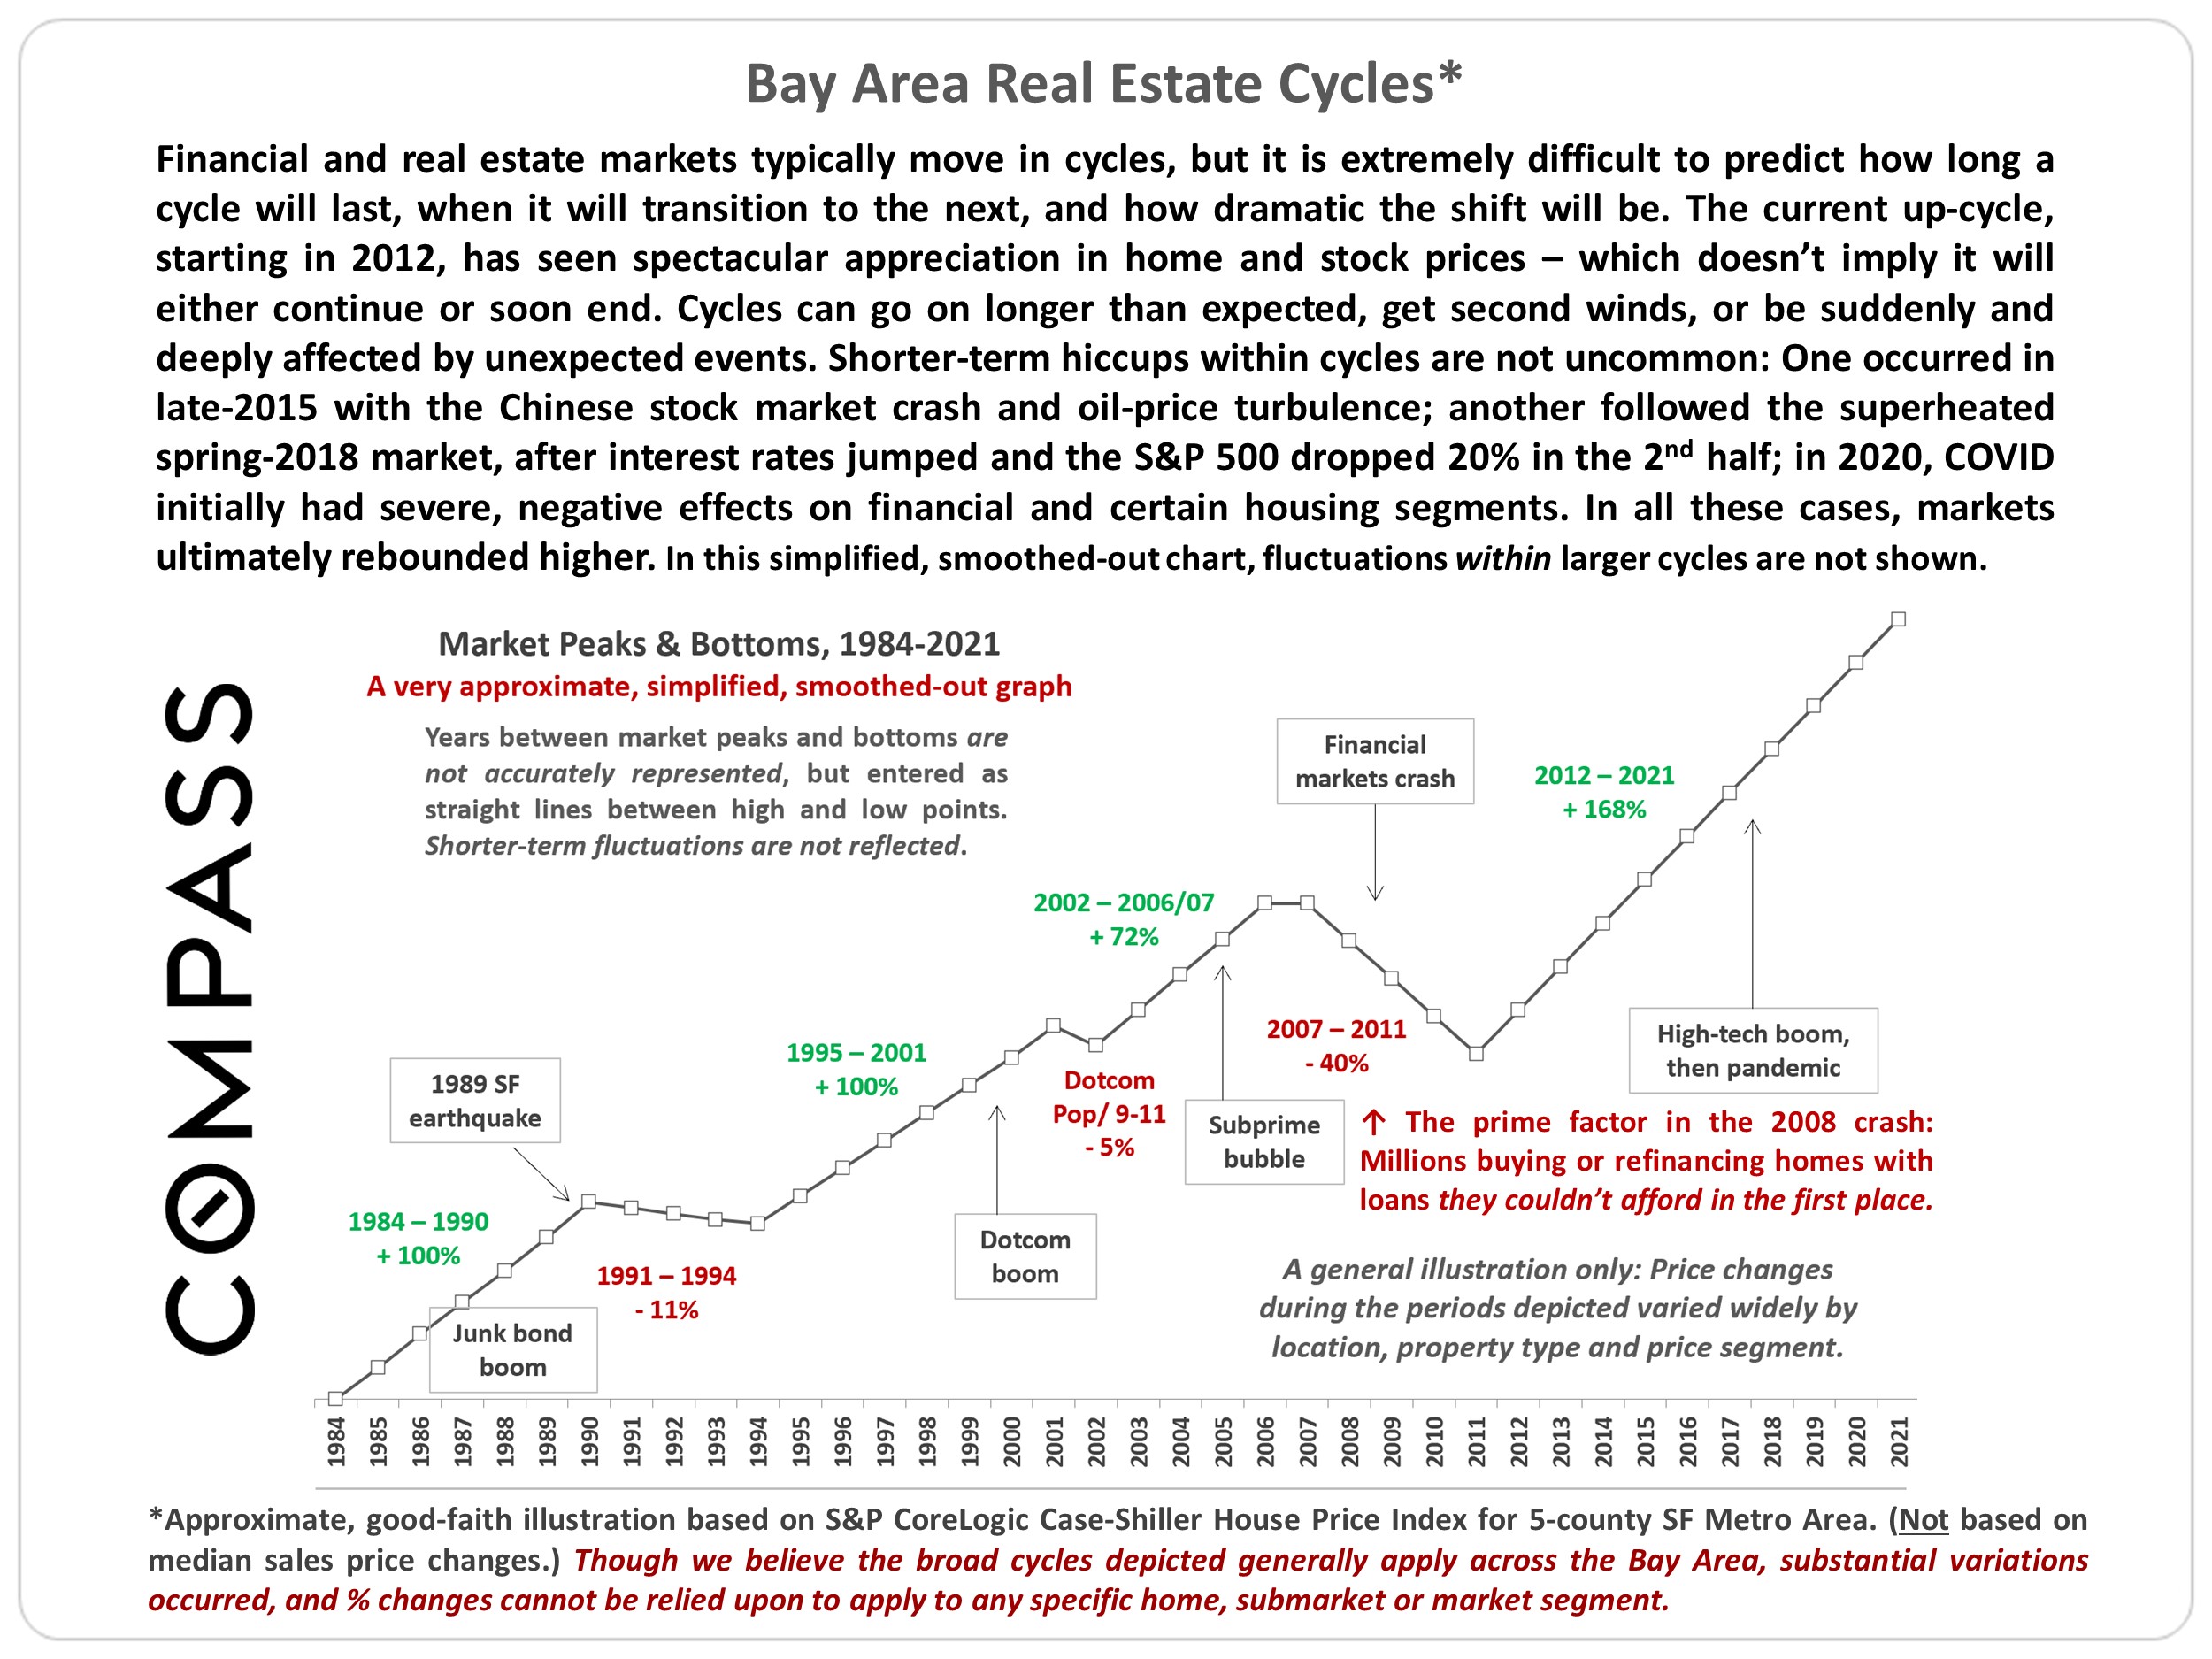
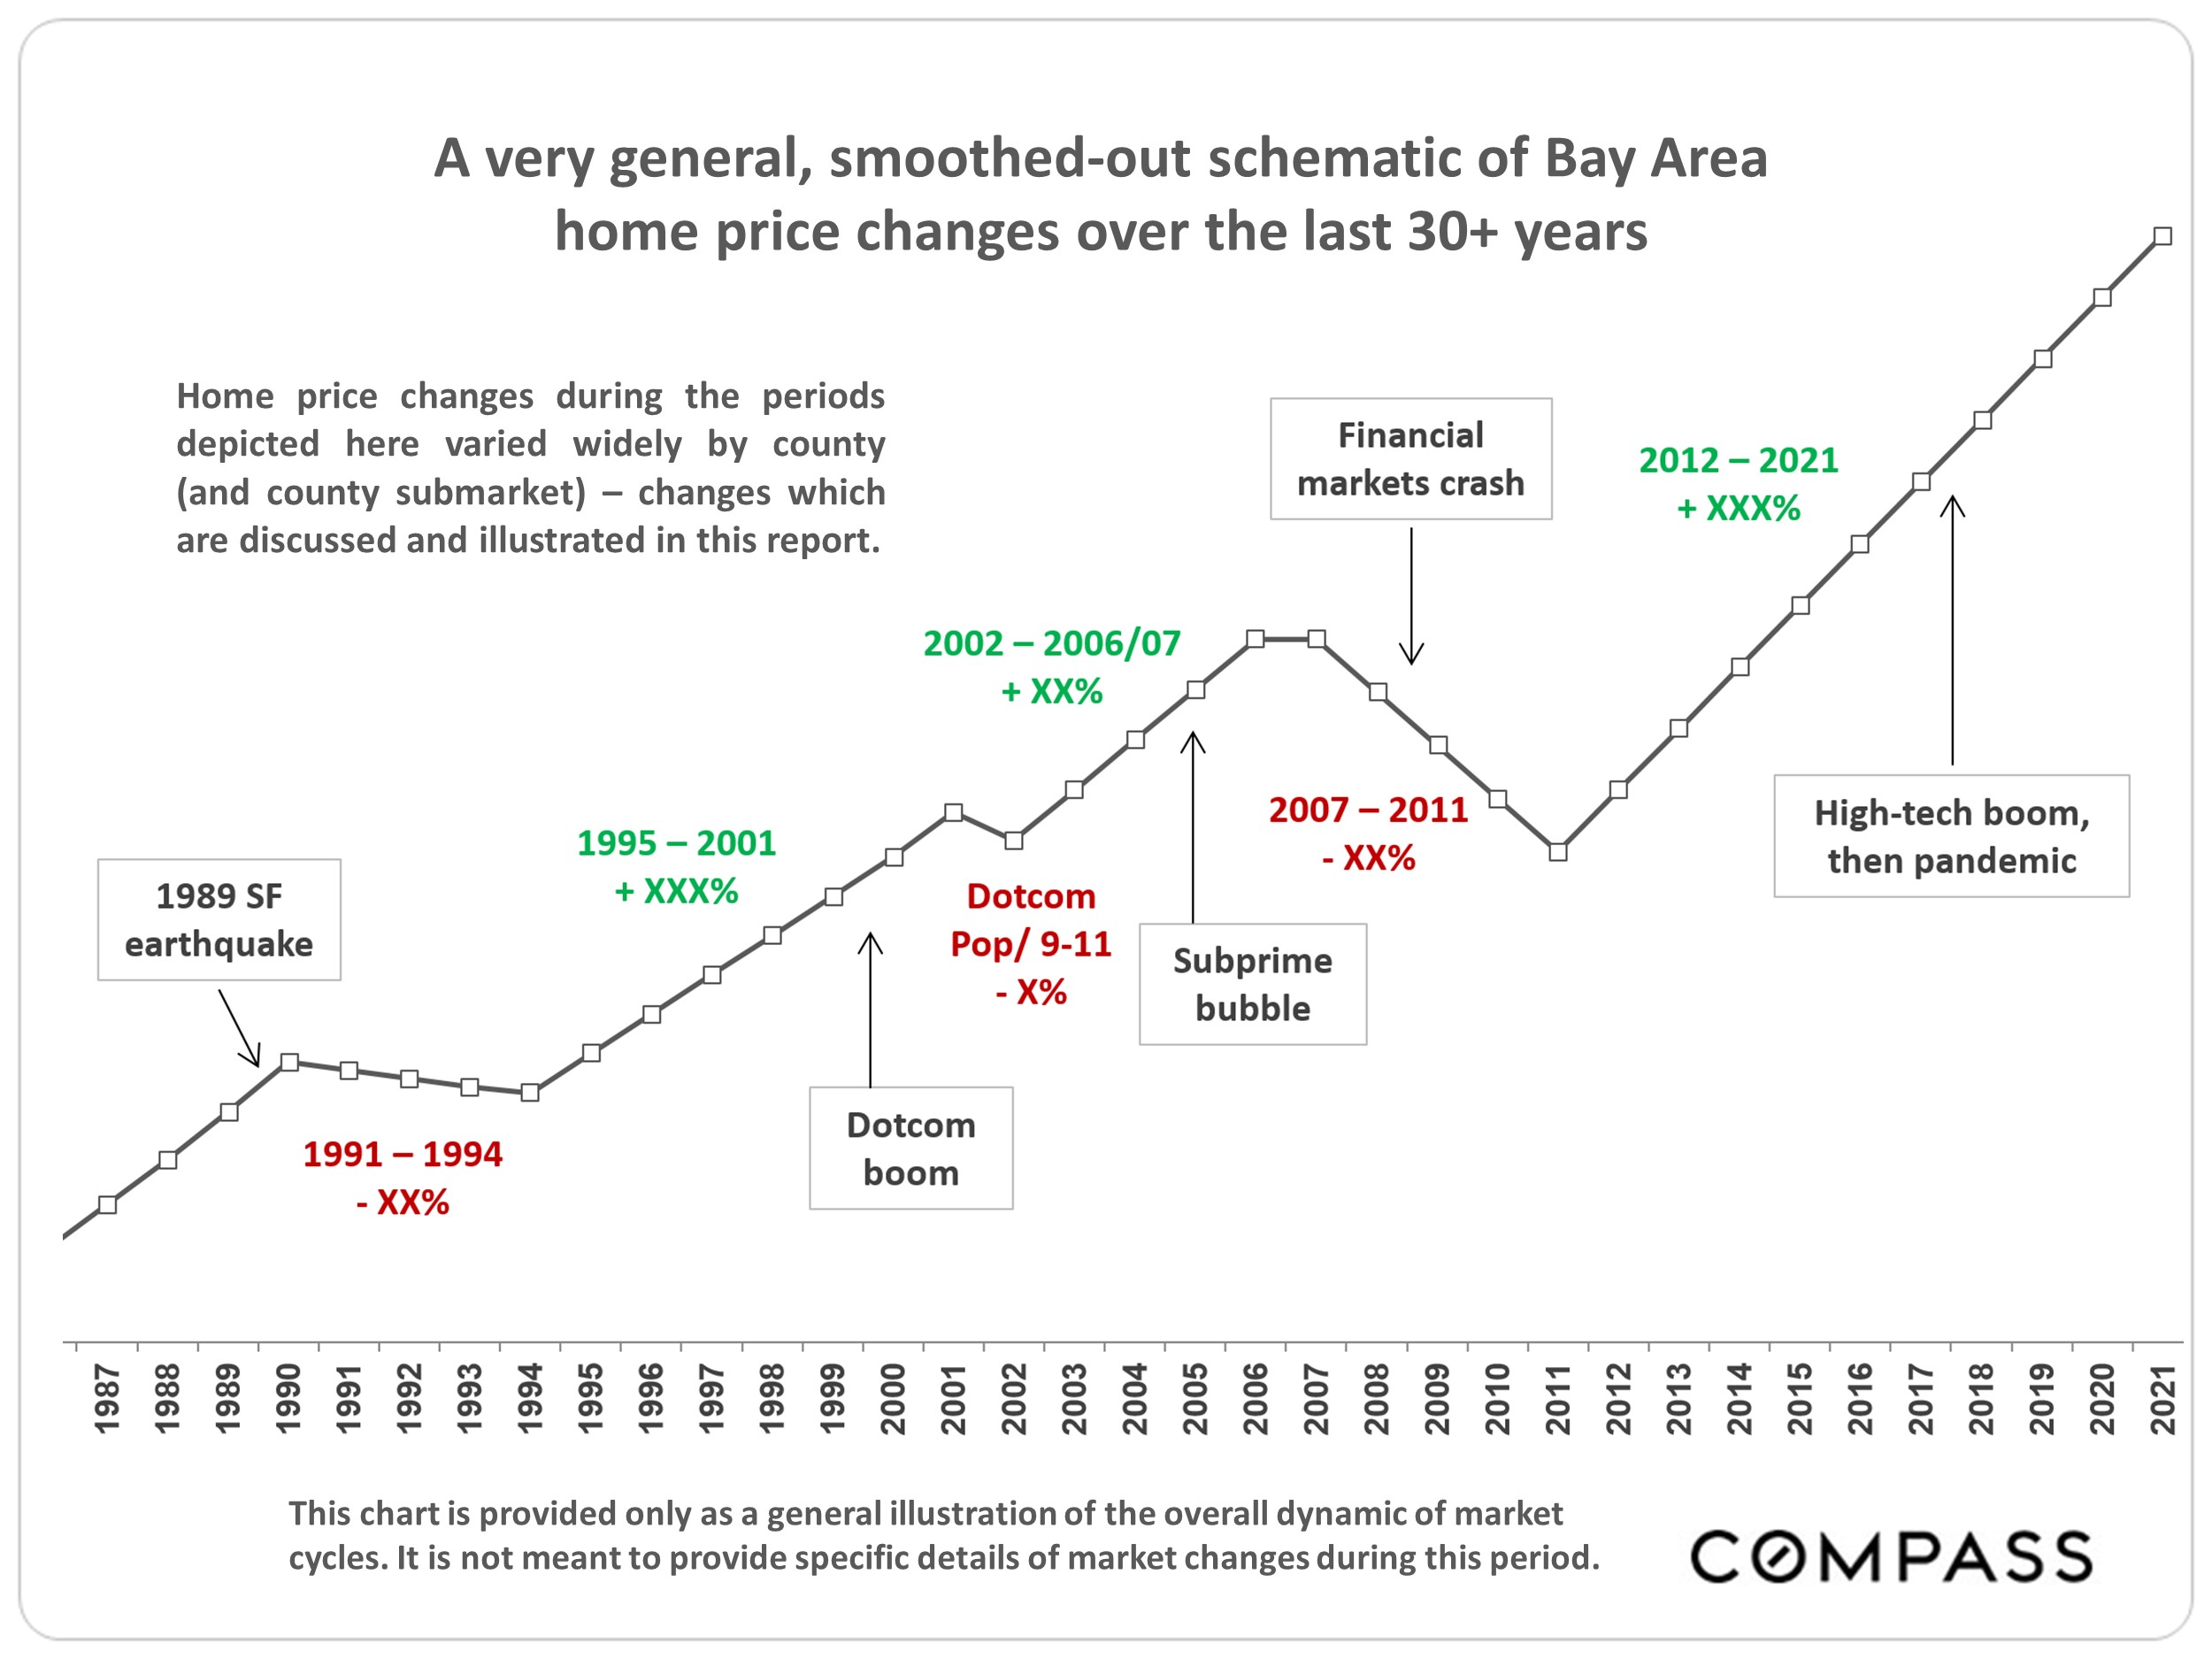
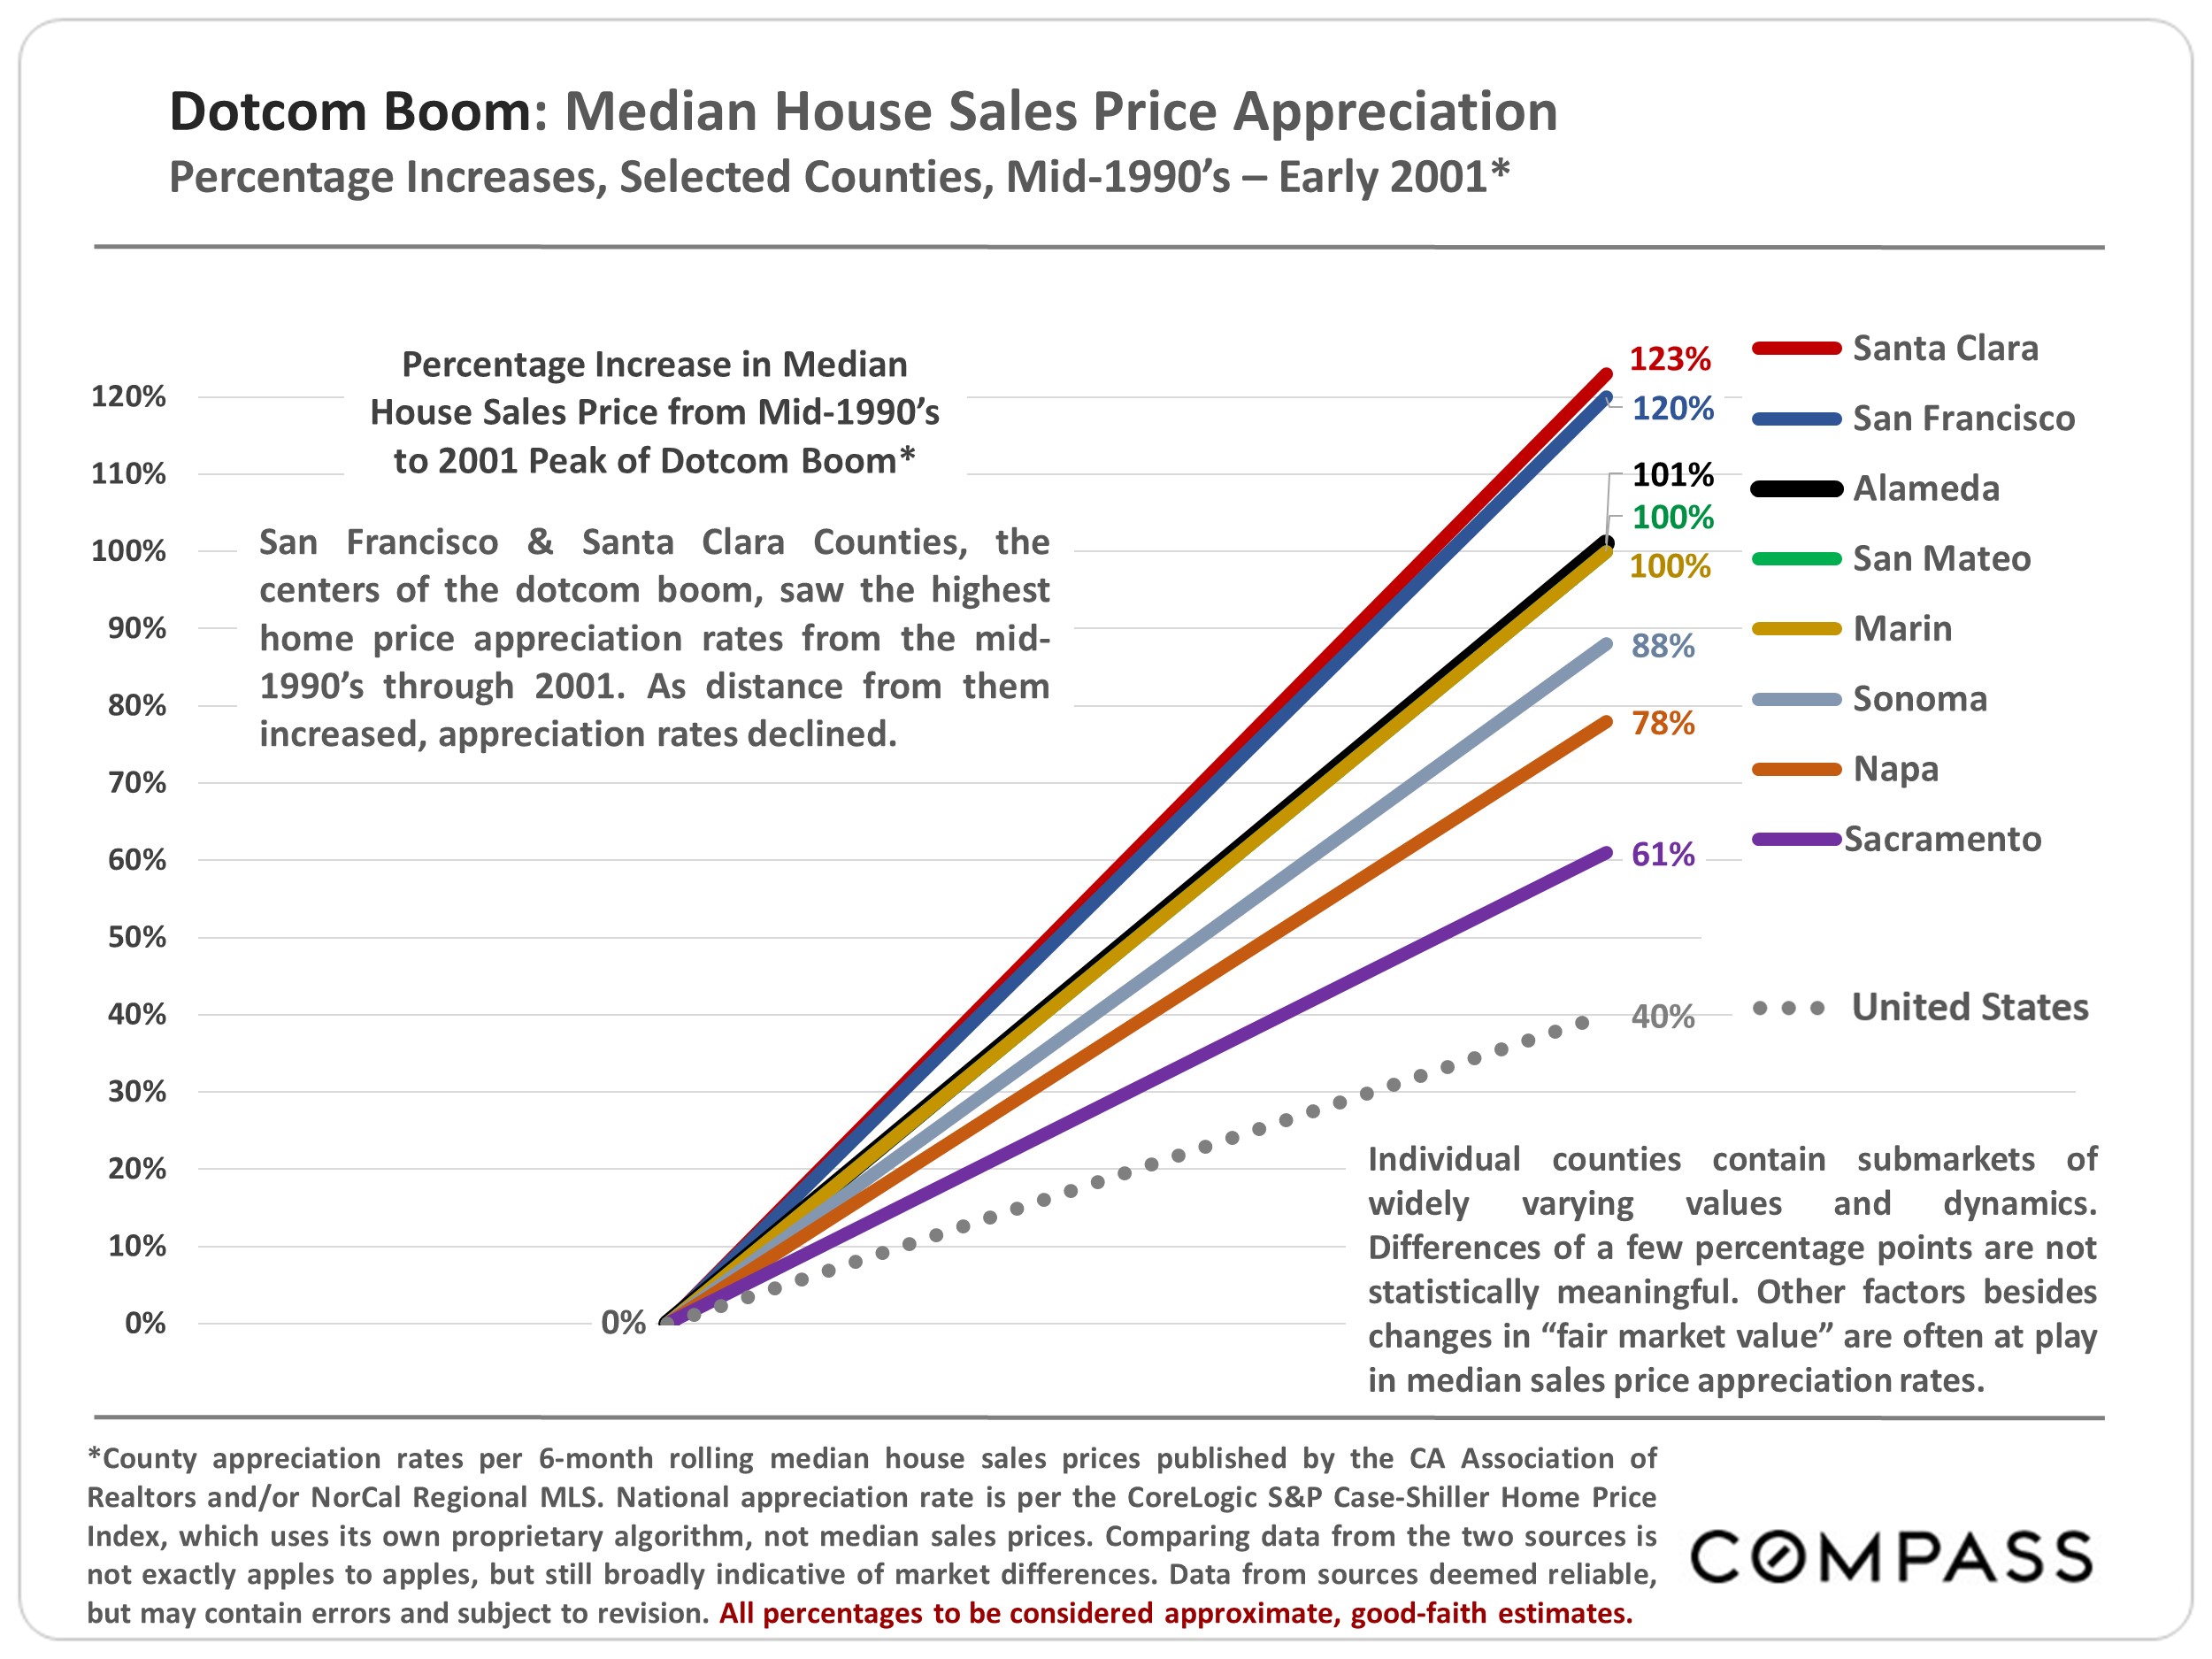
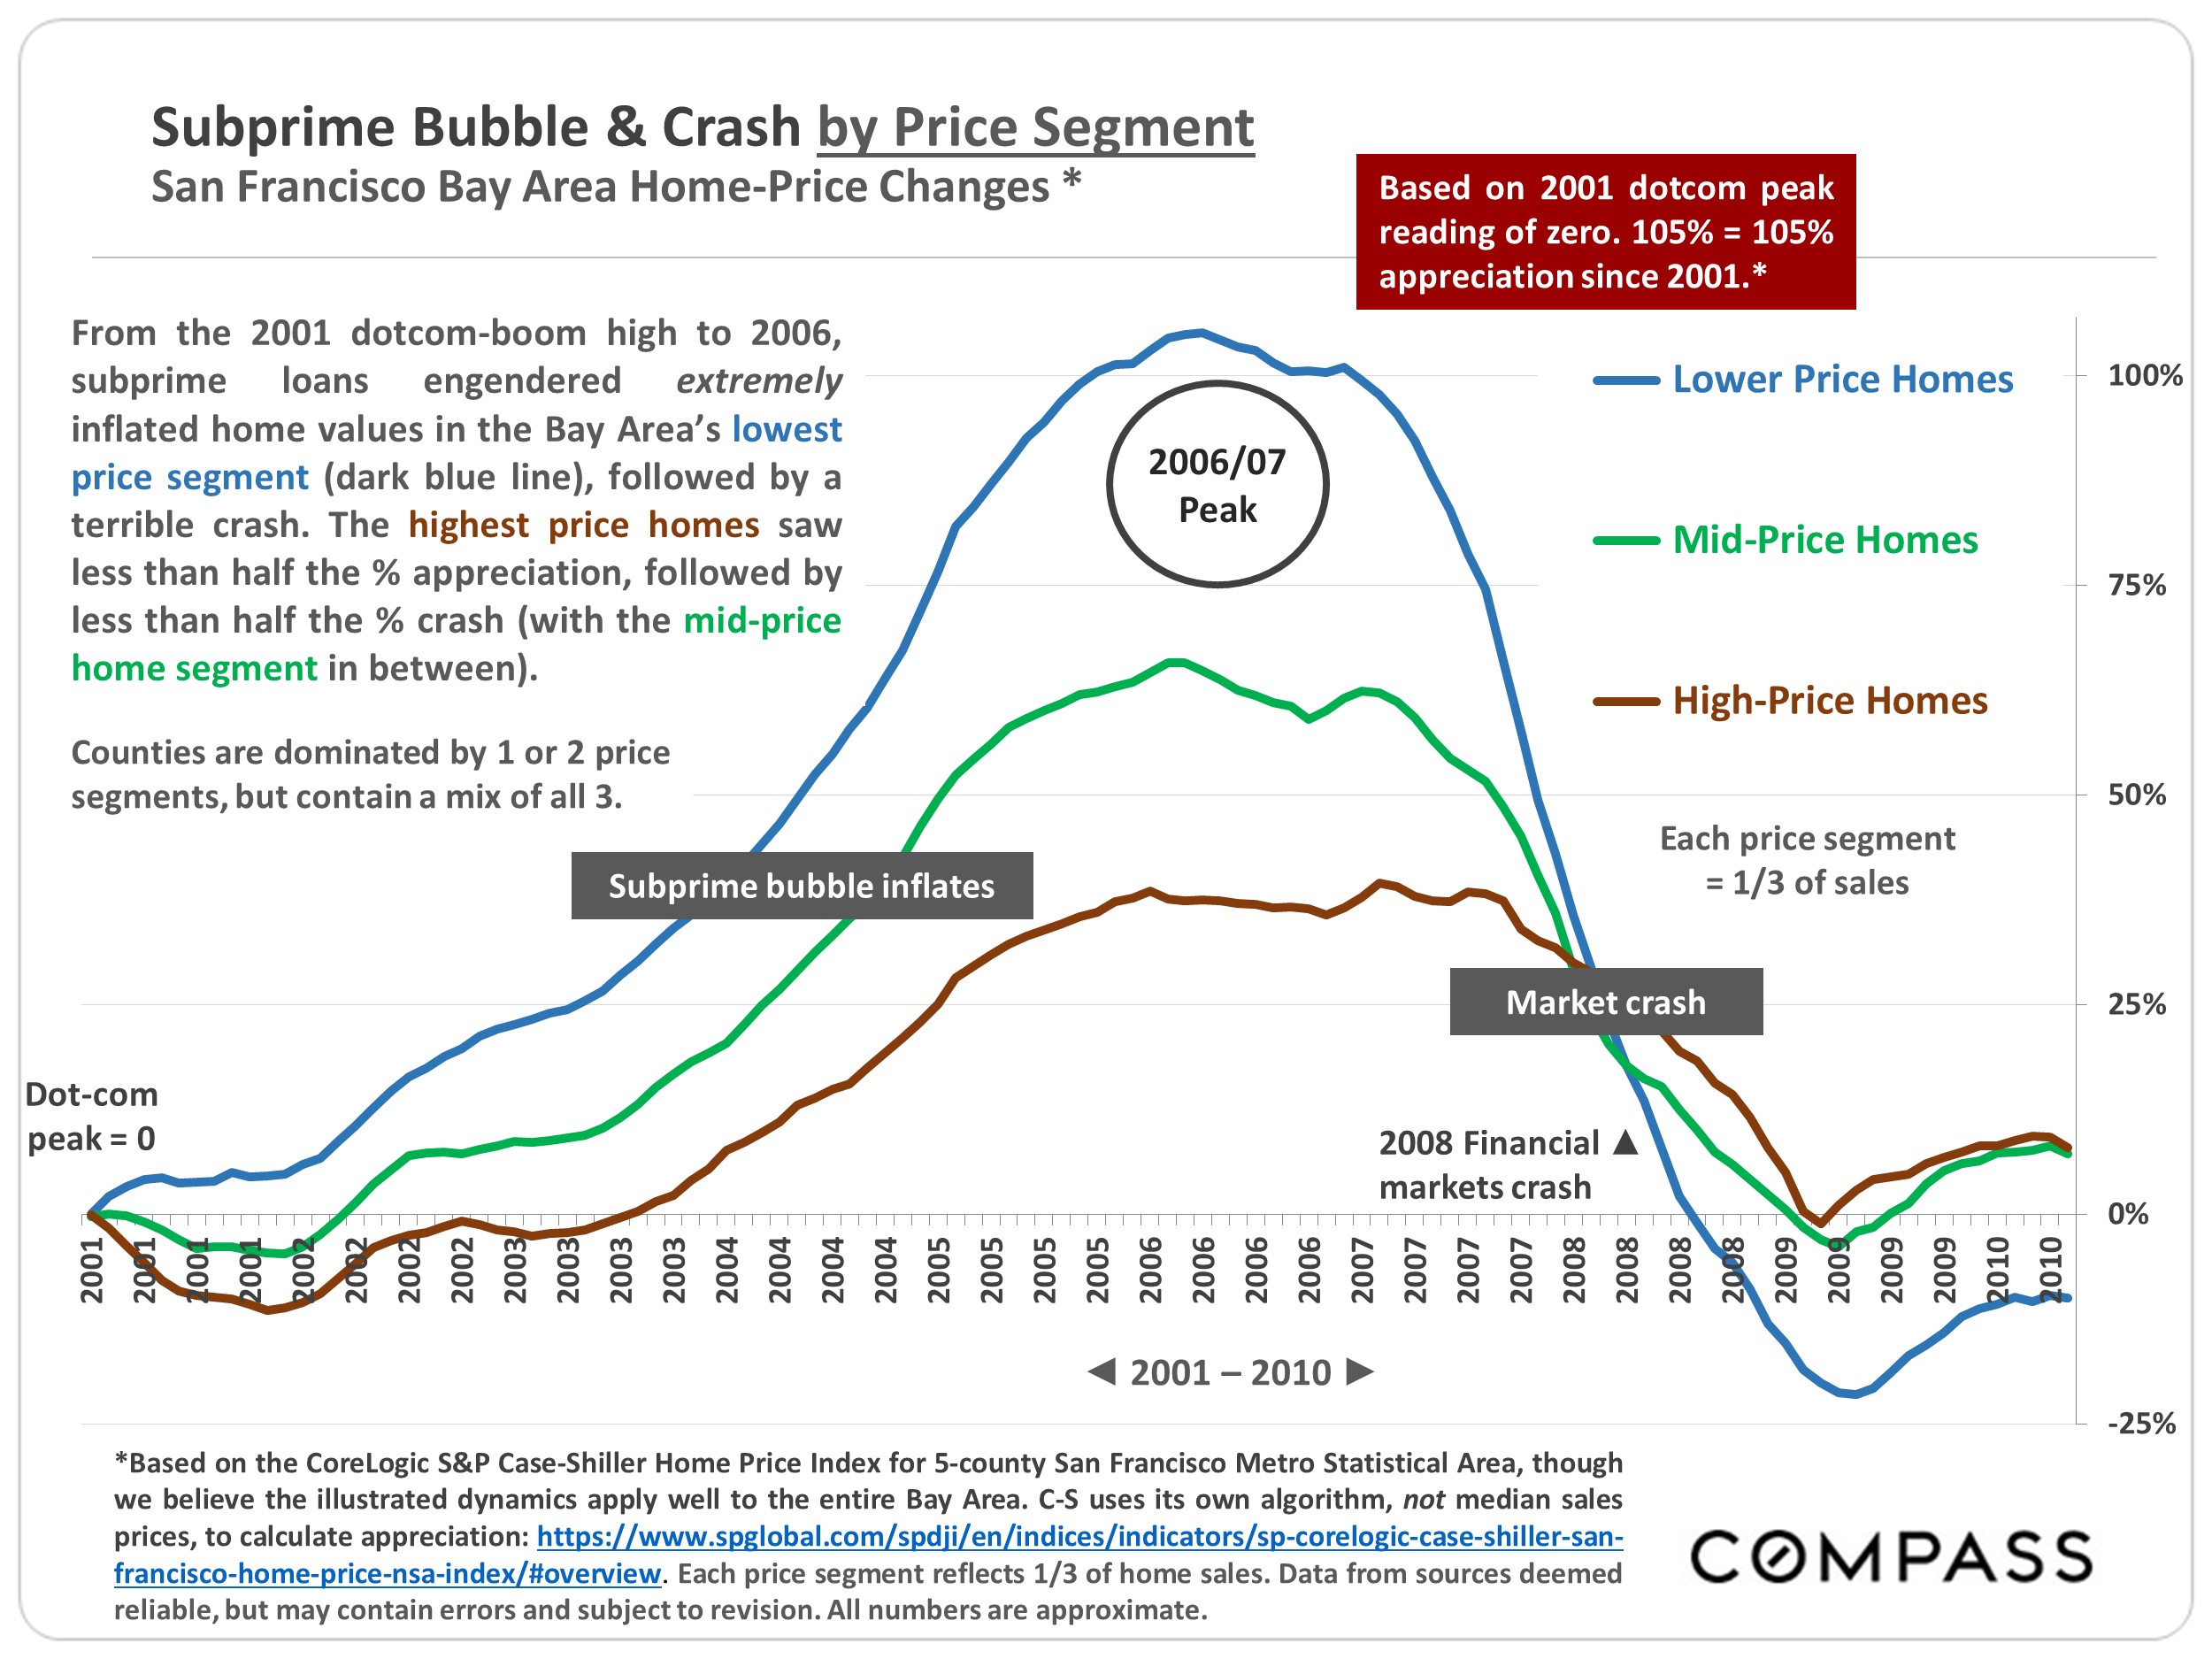
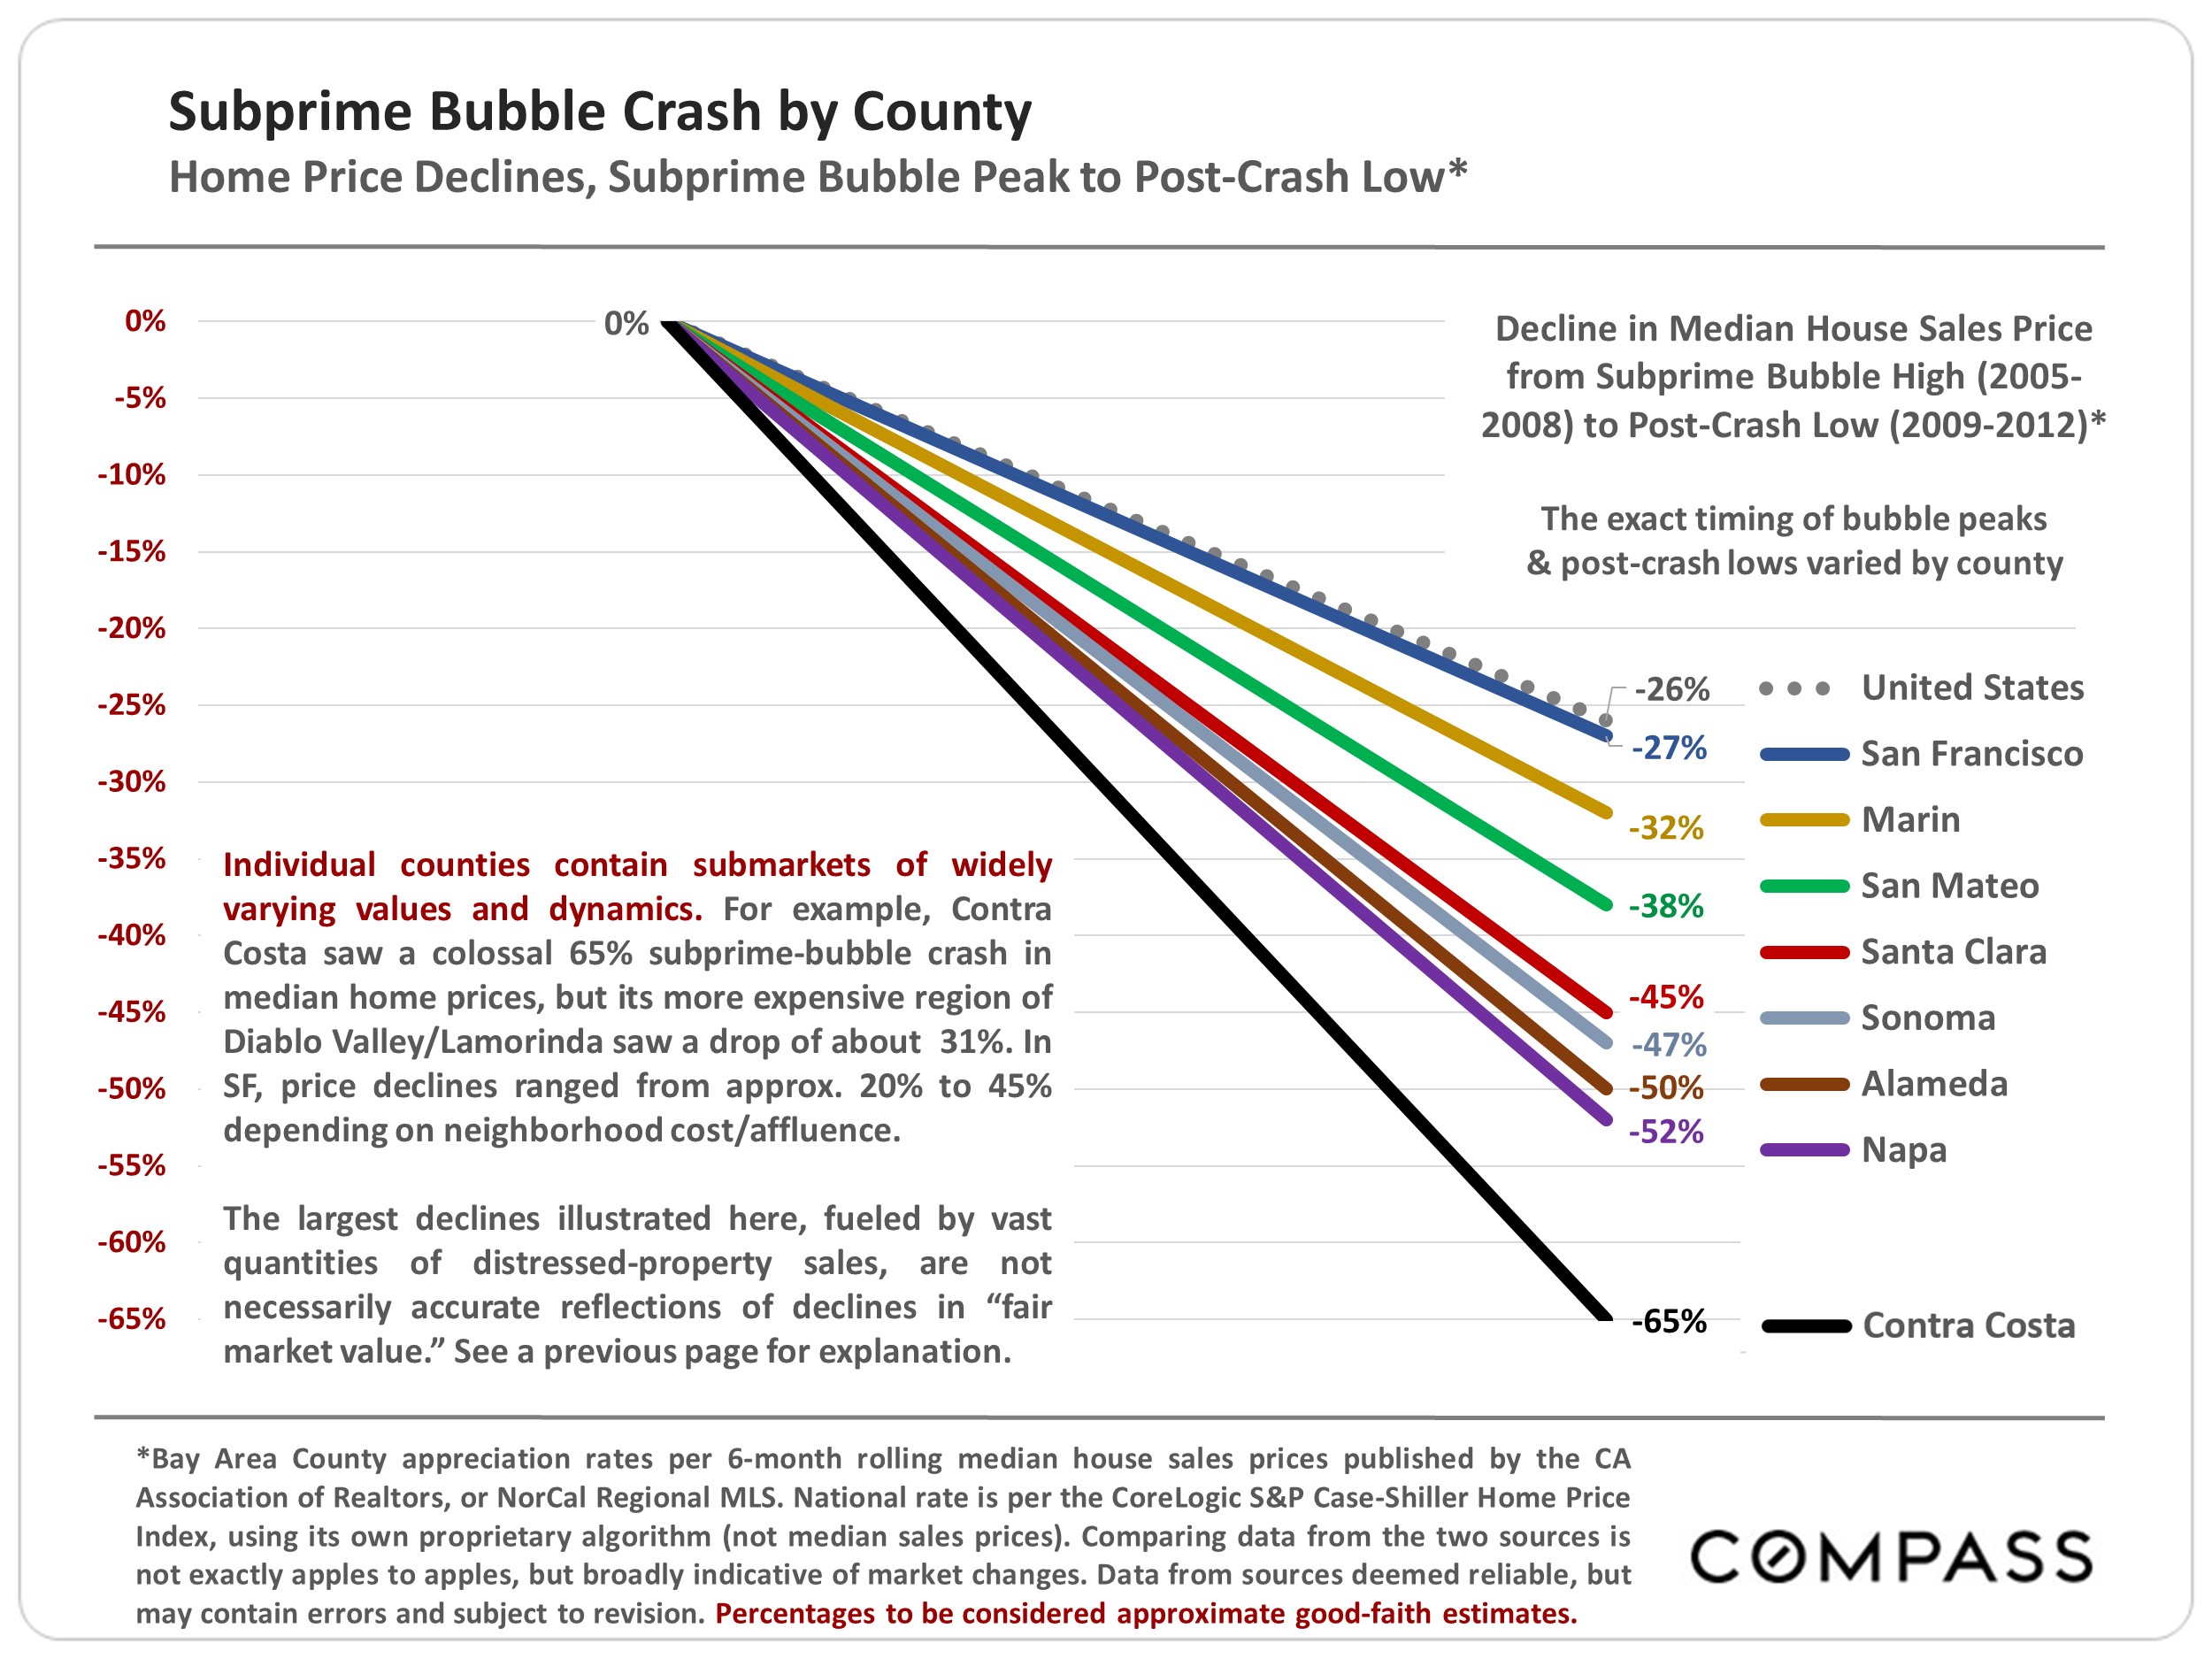
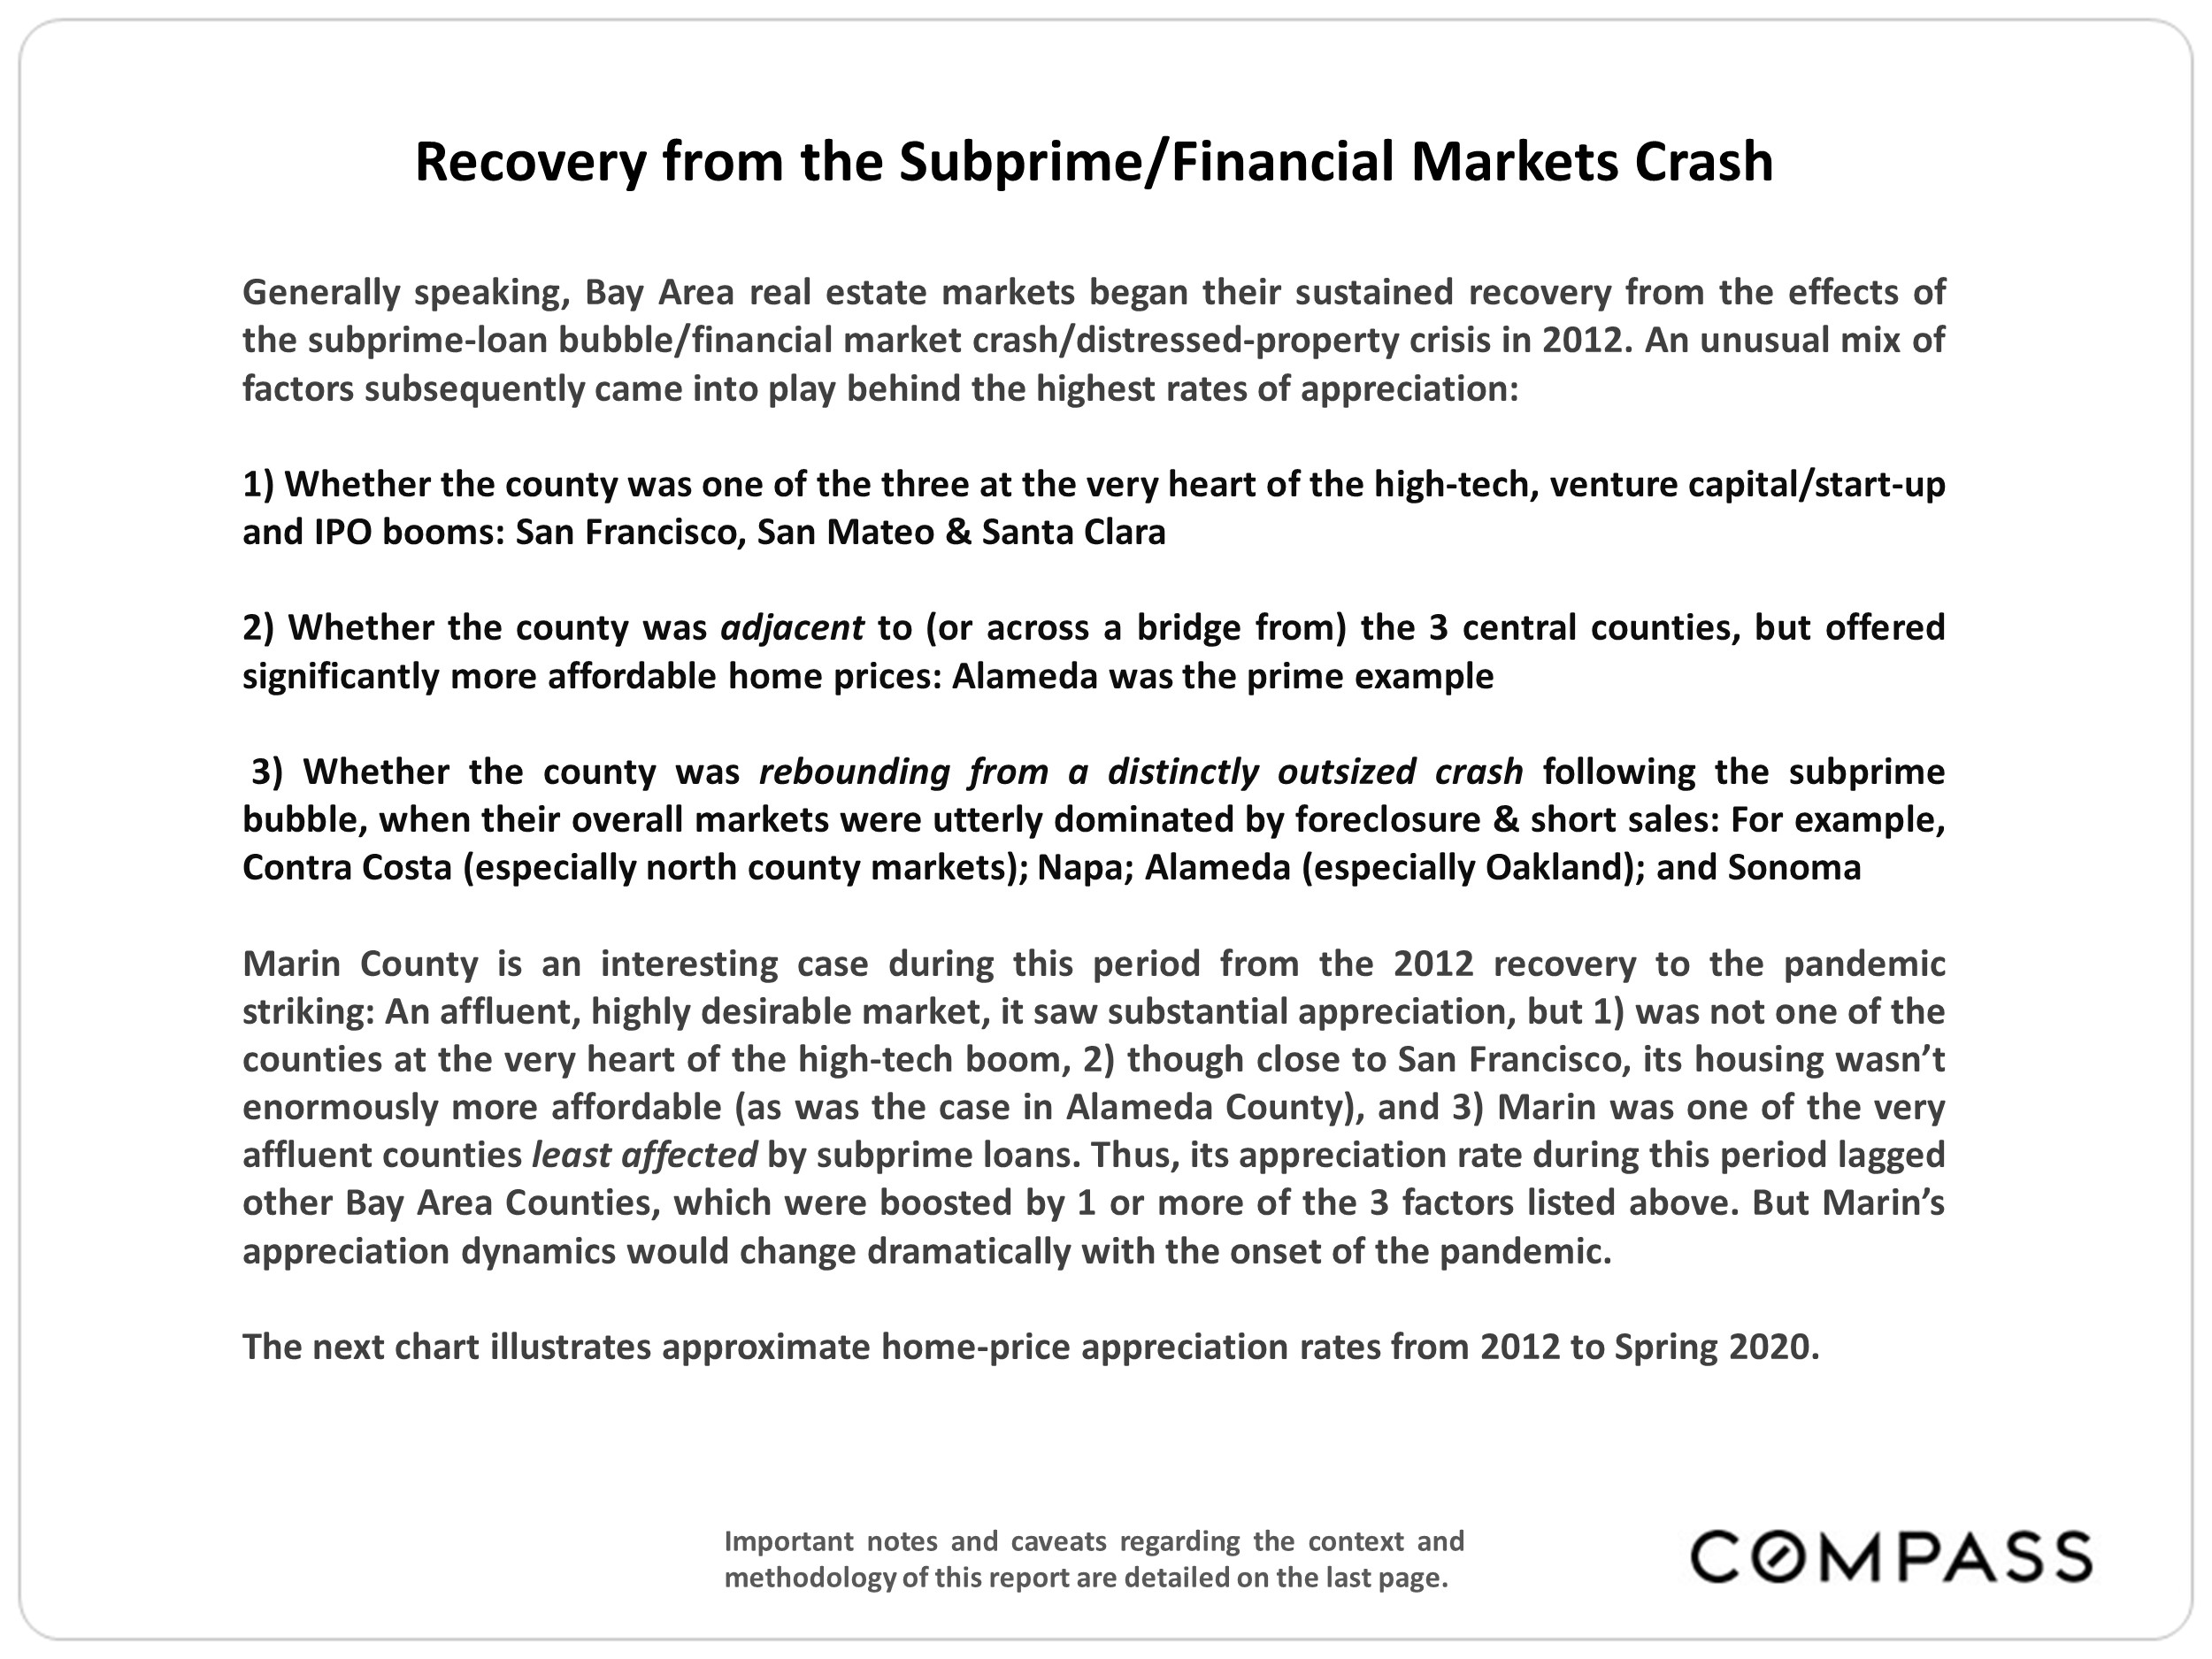
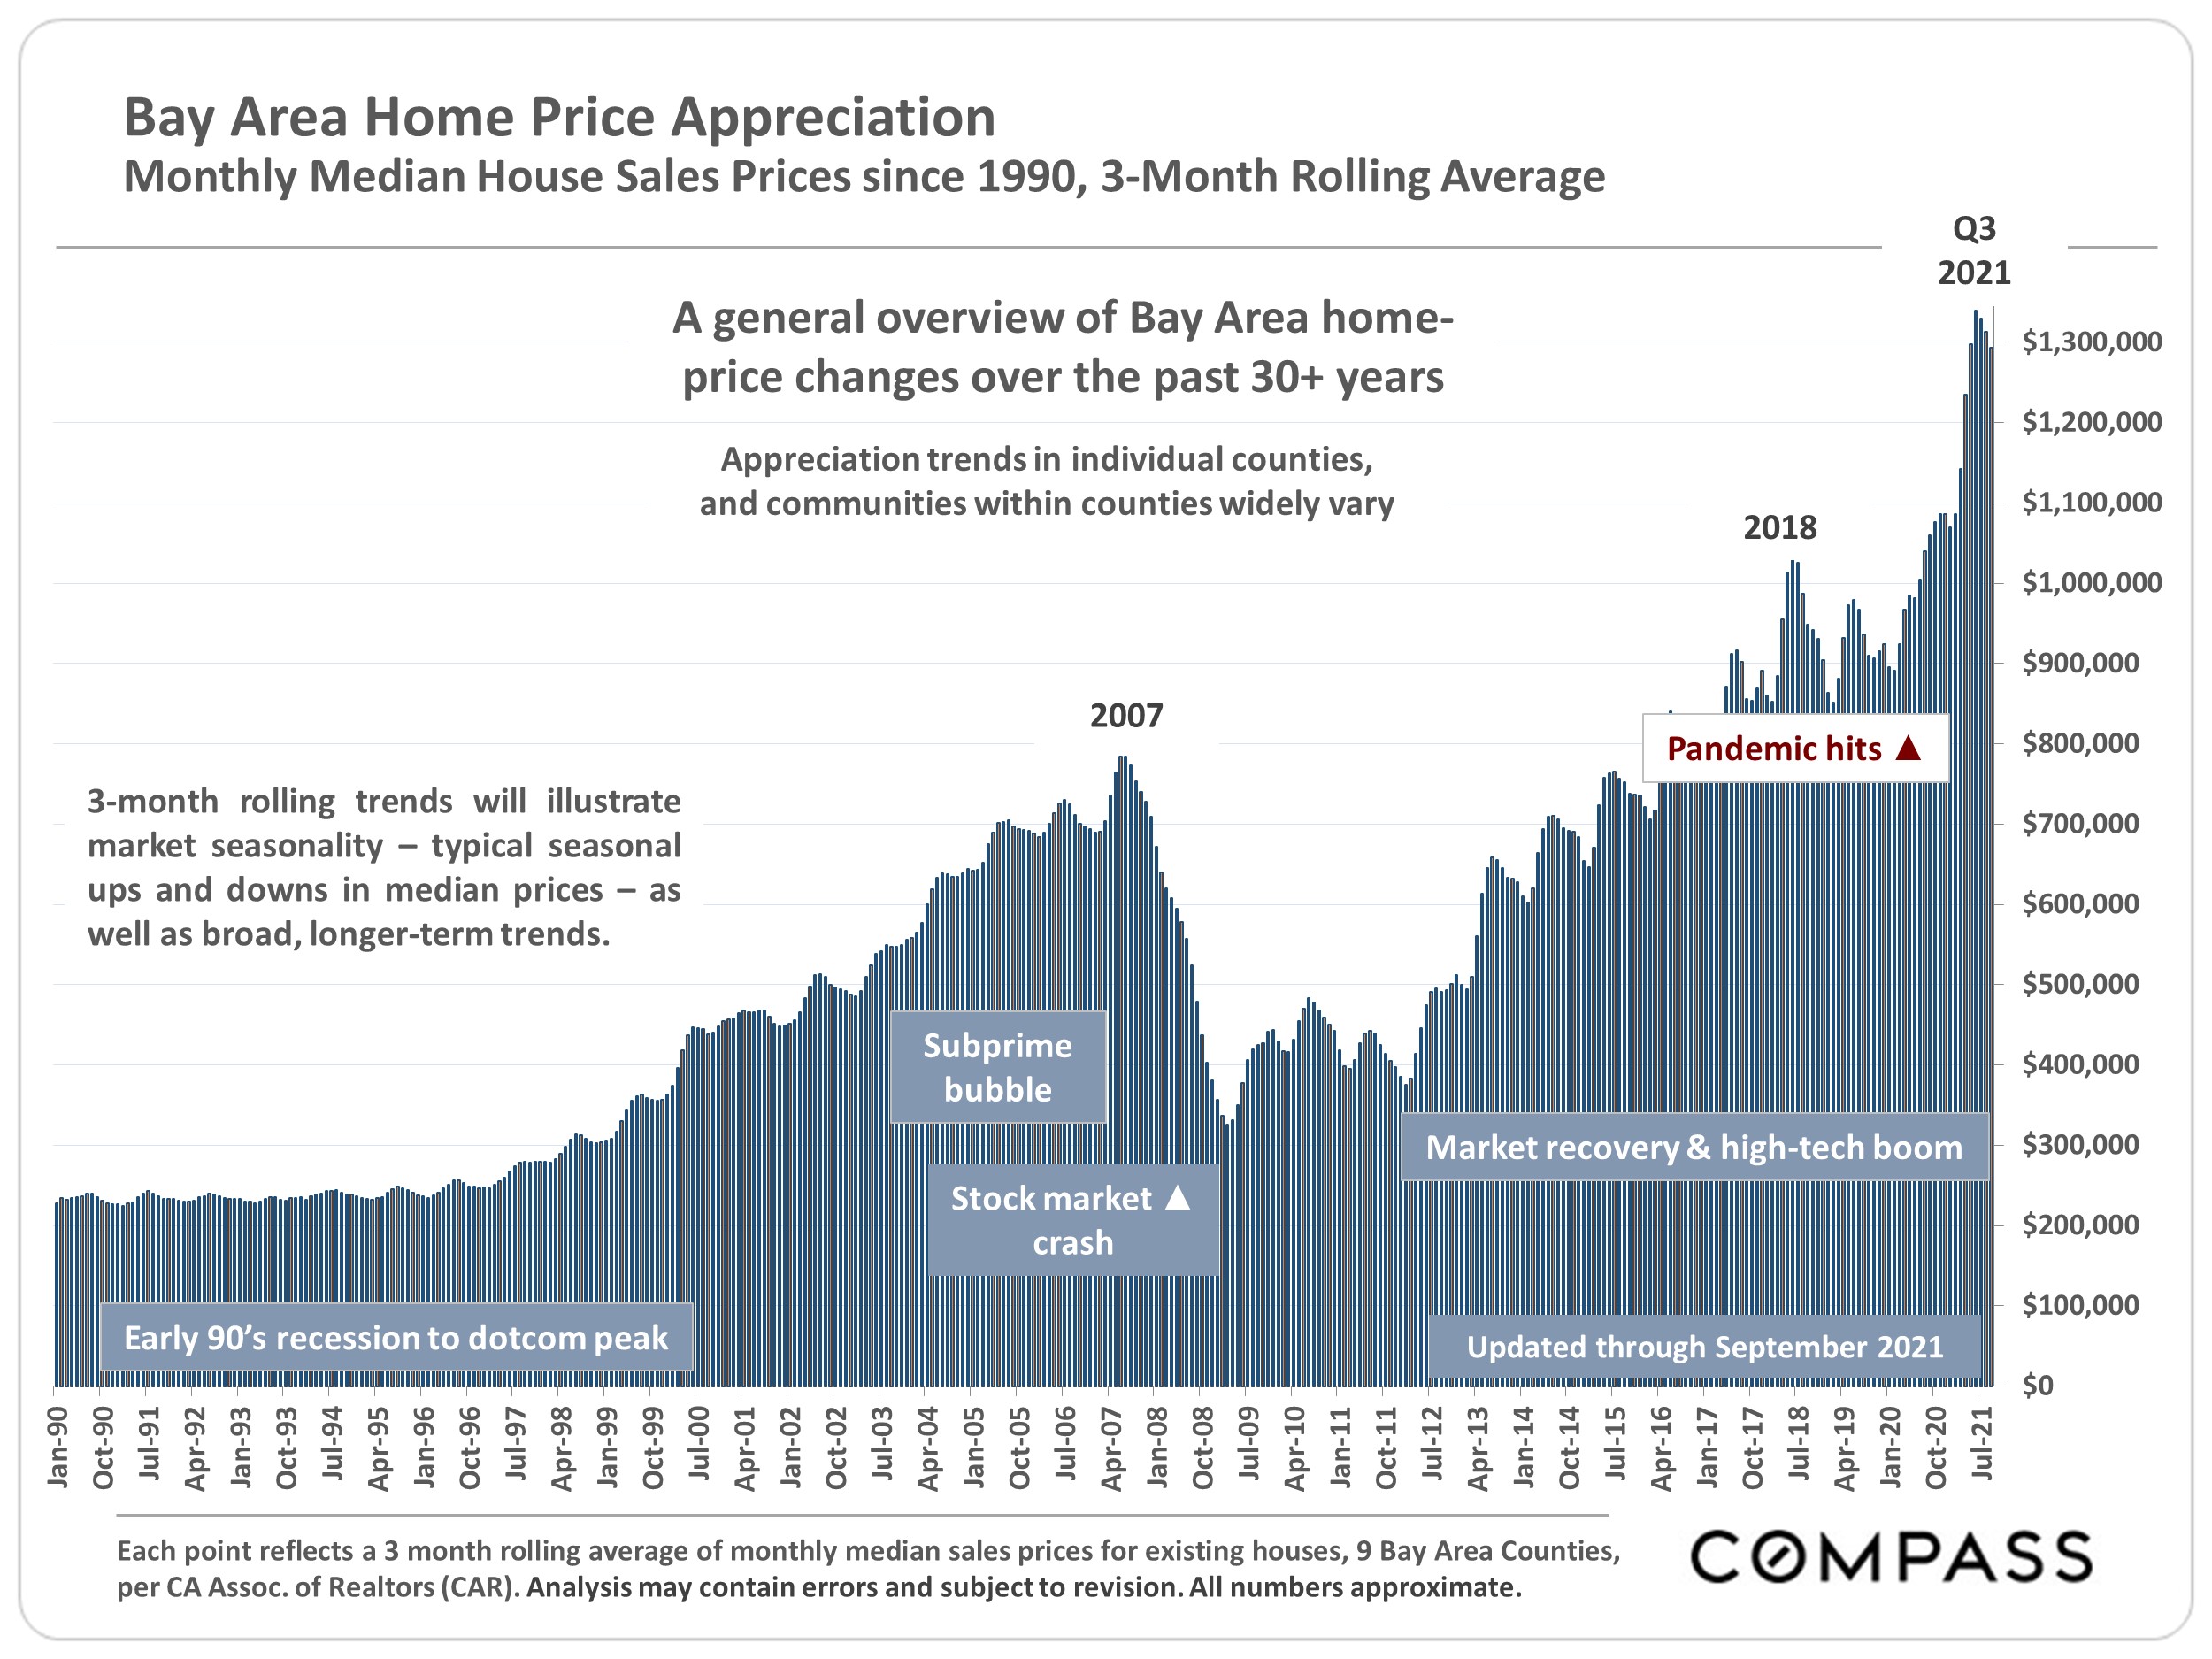
Bay Area market cycles since 1990
Psychology in Buyer and Seller markets
Bay Area Real Estate Survey
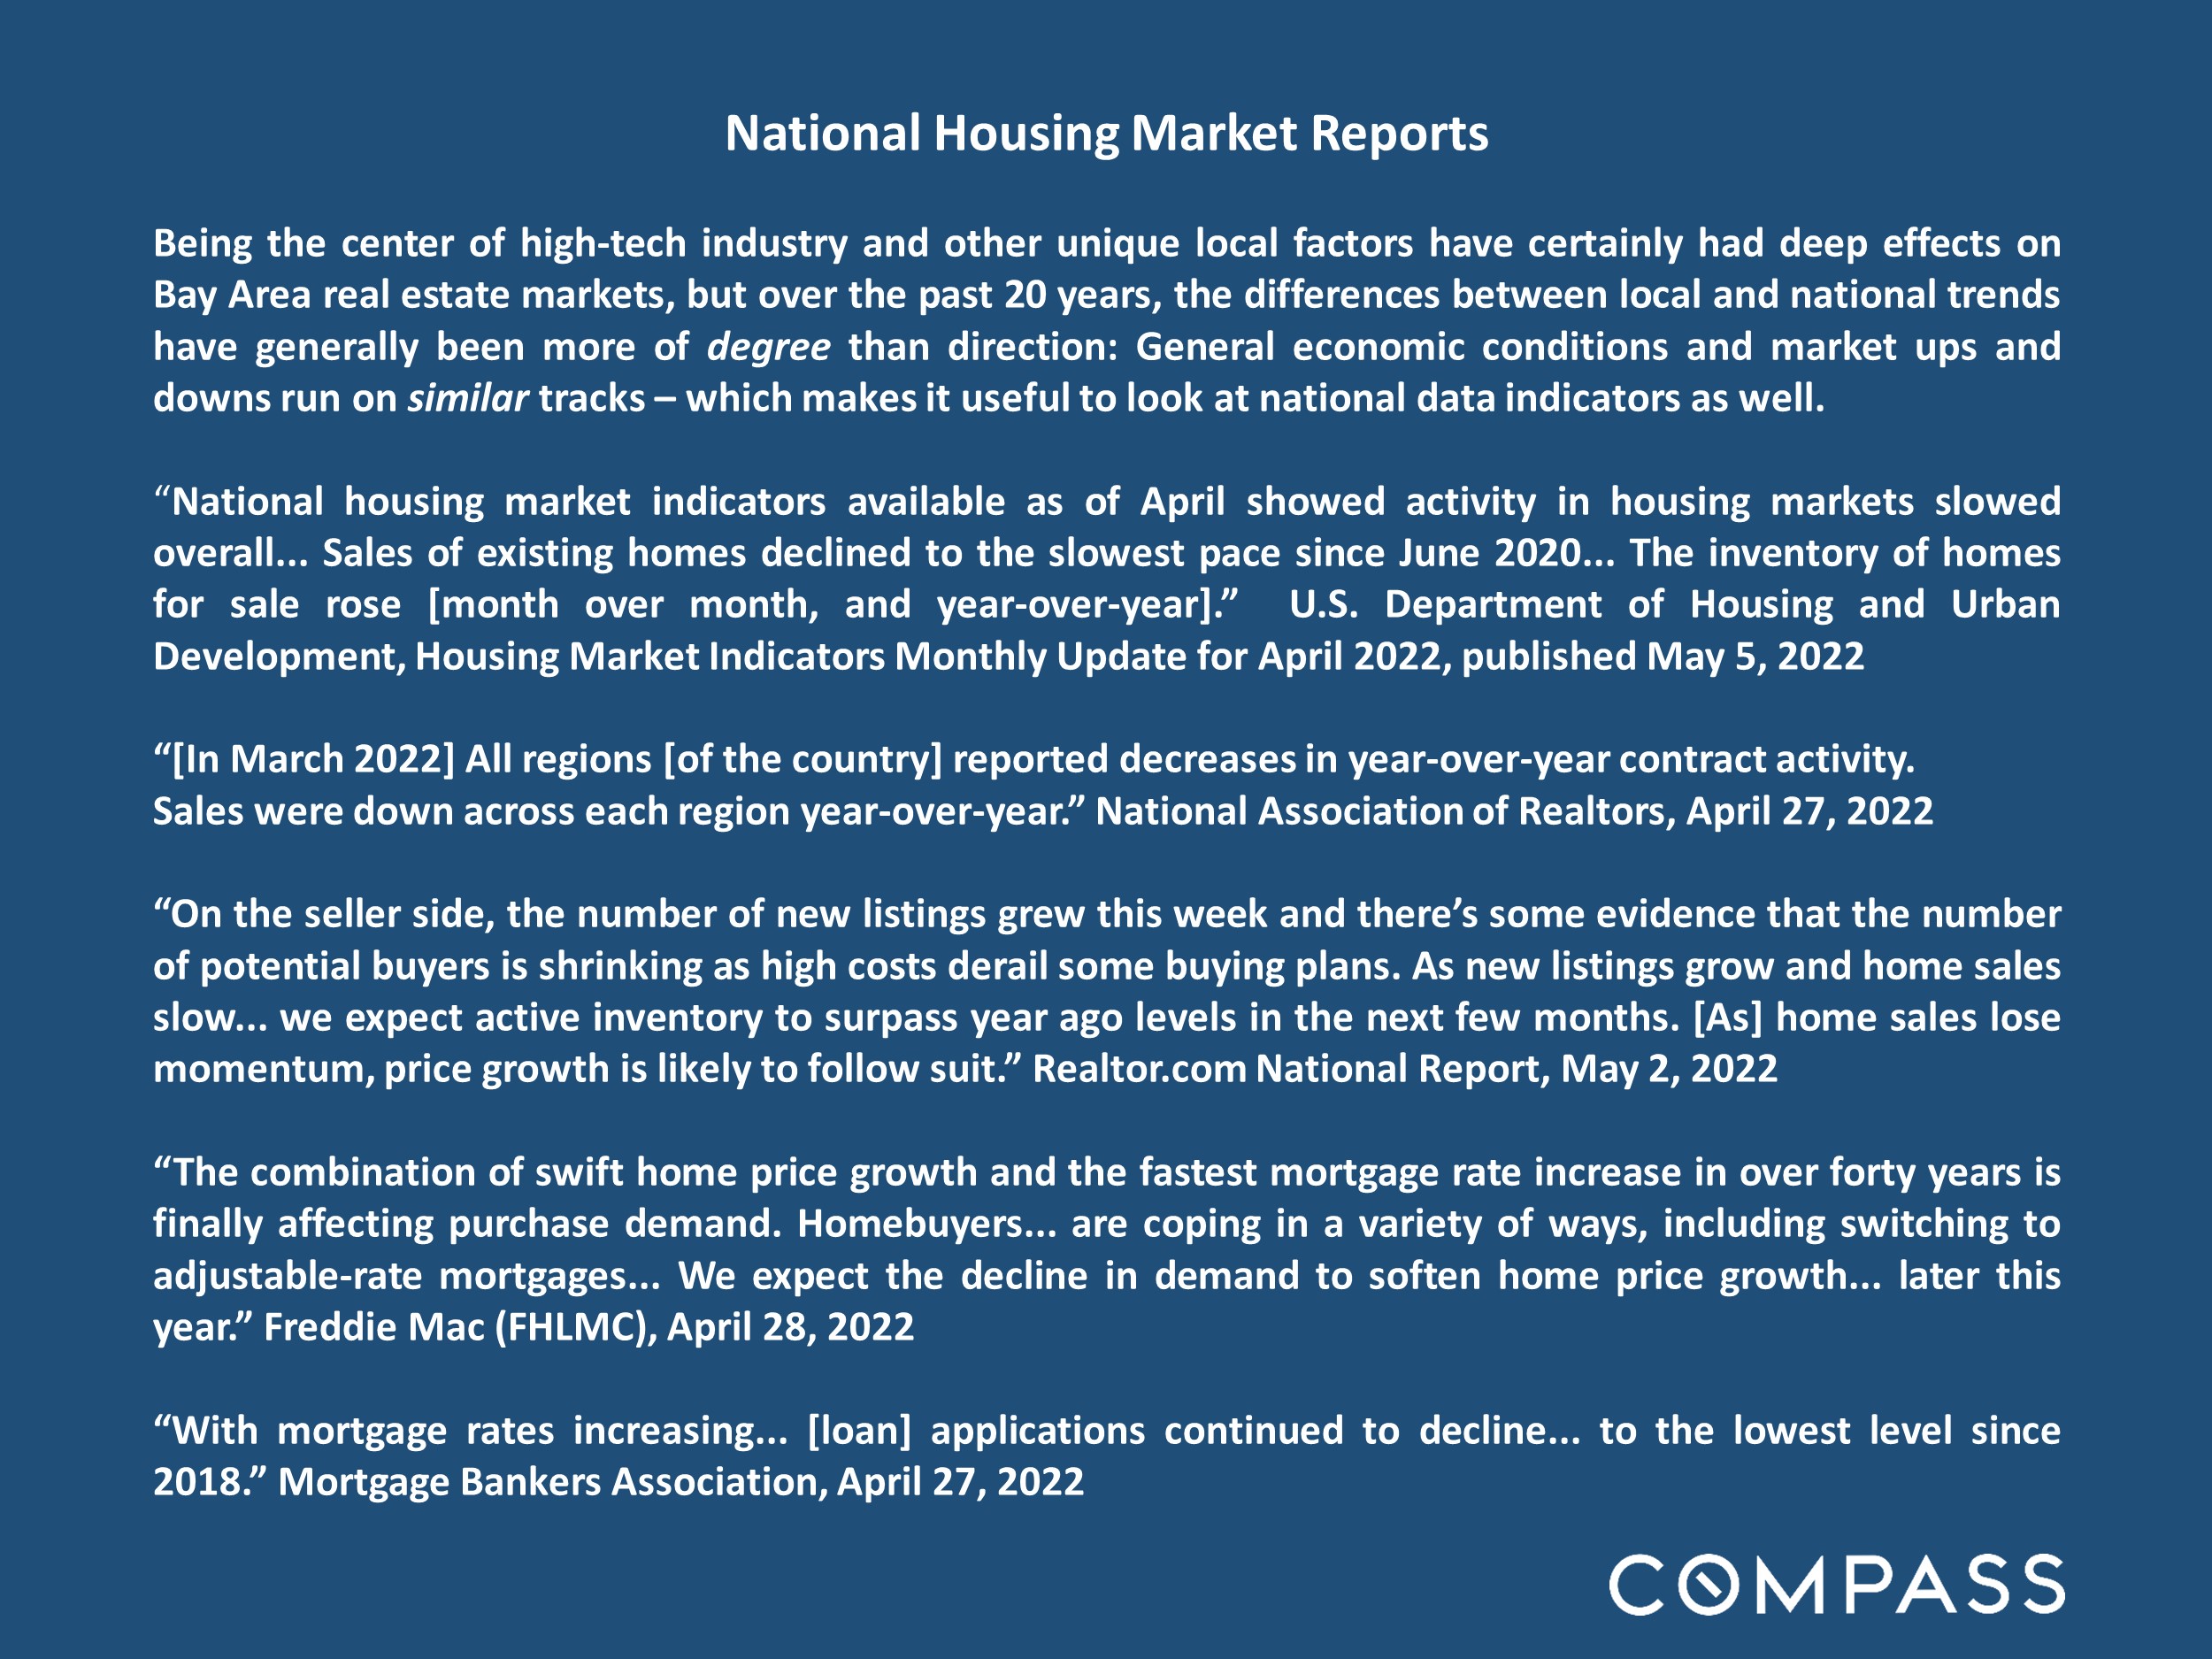
Bay Area market reports
Just click on the image to see a flip book containing the report. It provides many metrics of the current market as well as a discussion about whether it is a Buyer’s market or a Seller’s market.
From my personal perspective, there has definitely been a slow down in activity since our very busy spring season. Open houses have been sparsely attended. However, all my listings have successfully sold even if it takes a bit longer than we’ve been used to. There are definitely buyers out there looking to take advantage of the adjustment in prices.
As always, I would love to hear from you to reconnect. If you have any real estate questions or referral needs, please feel free to reach out. Happy Halloween!
Best,
Pota
From our analyst about the market:
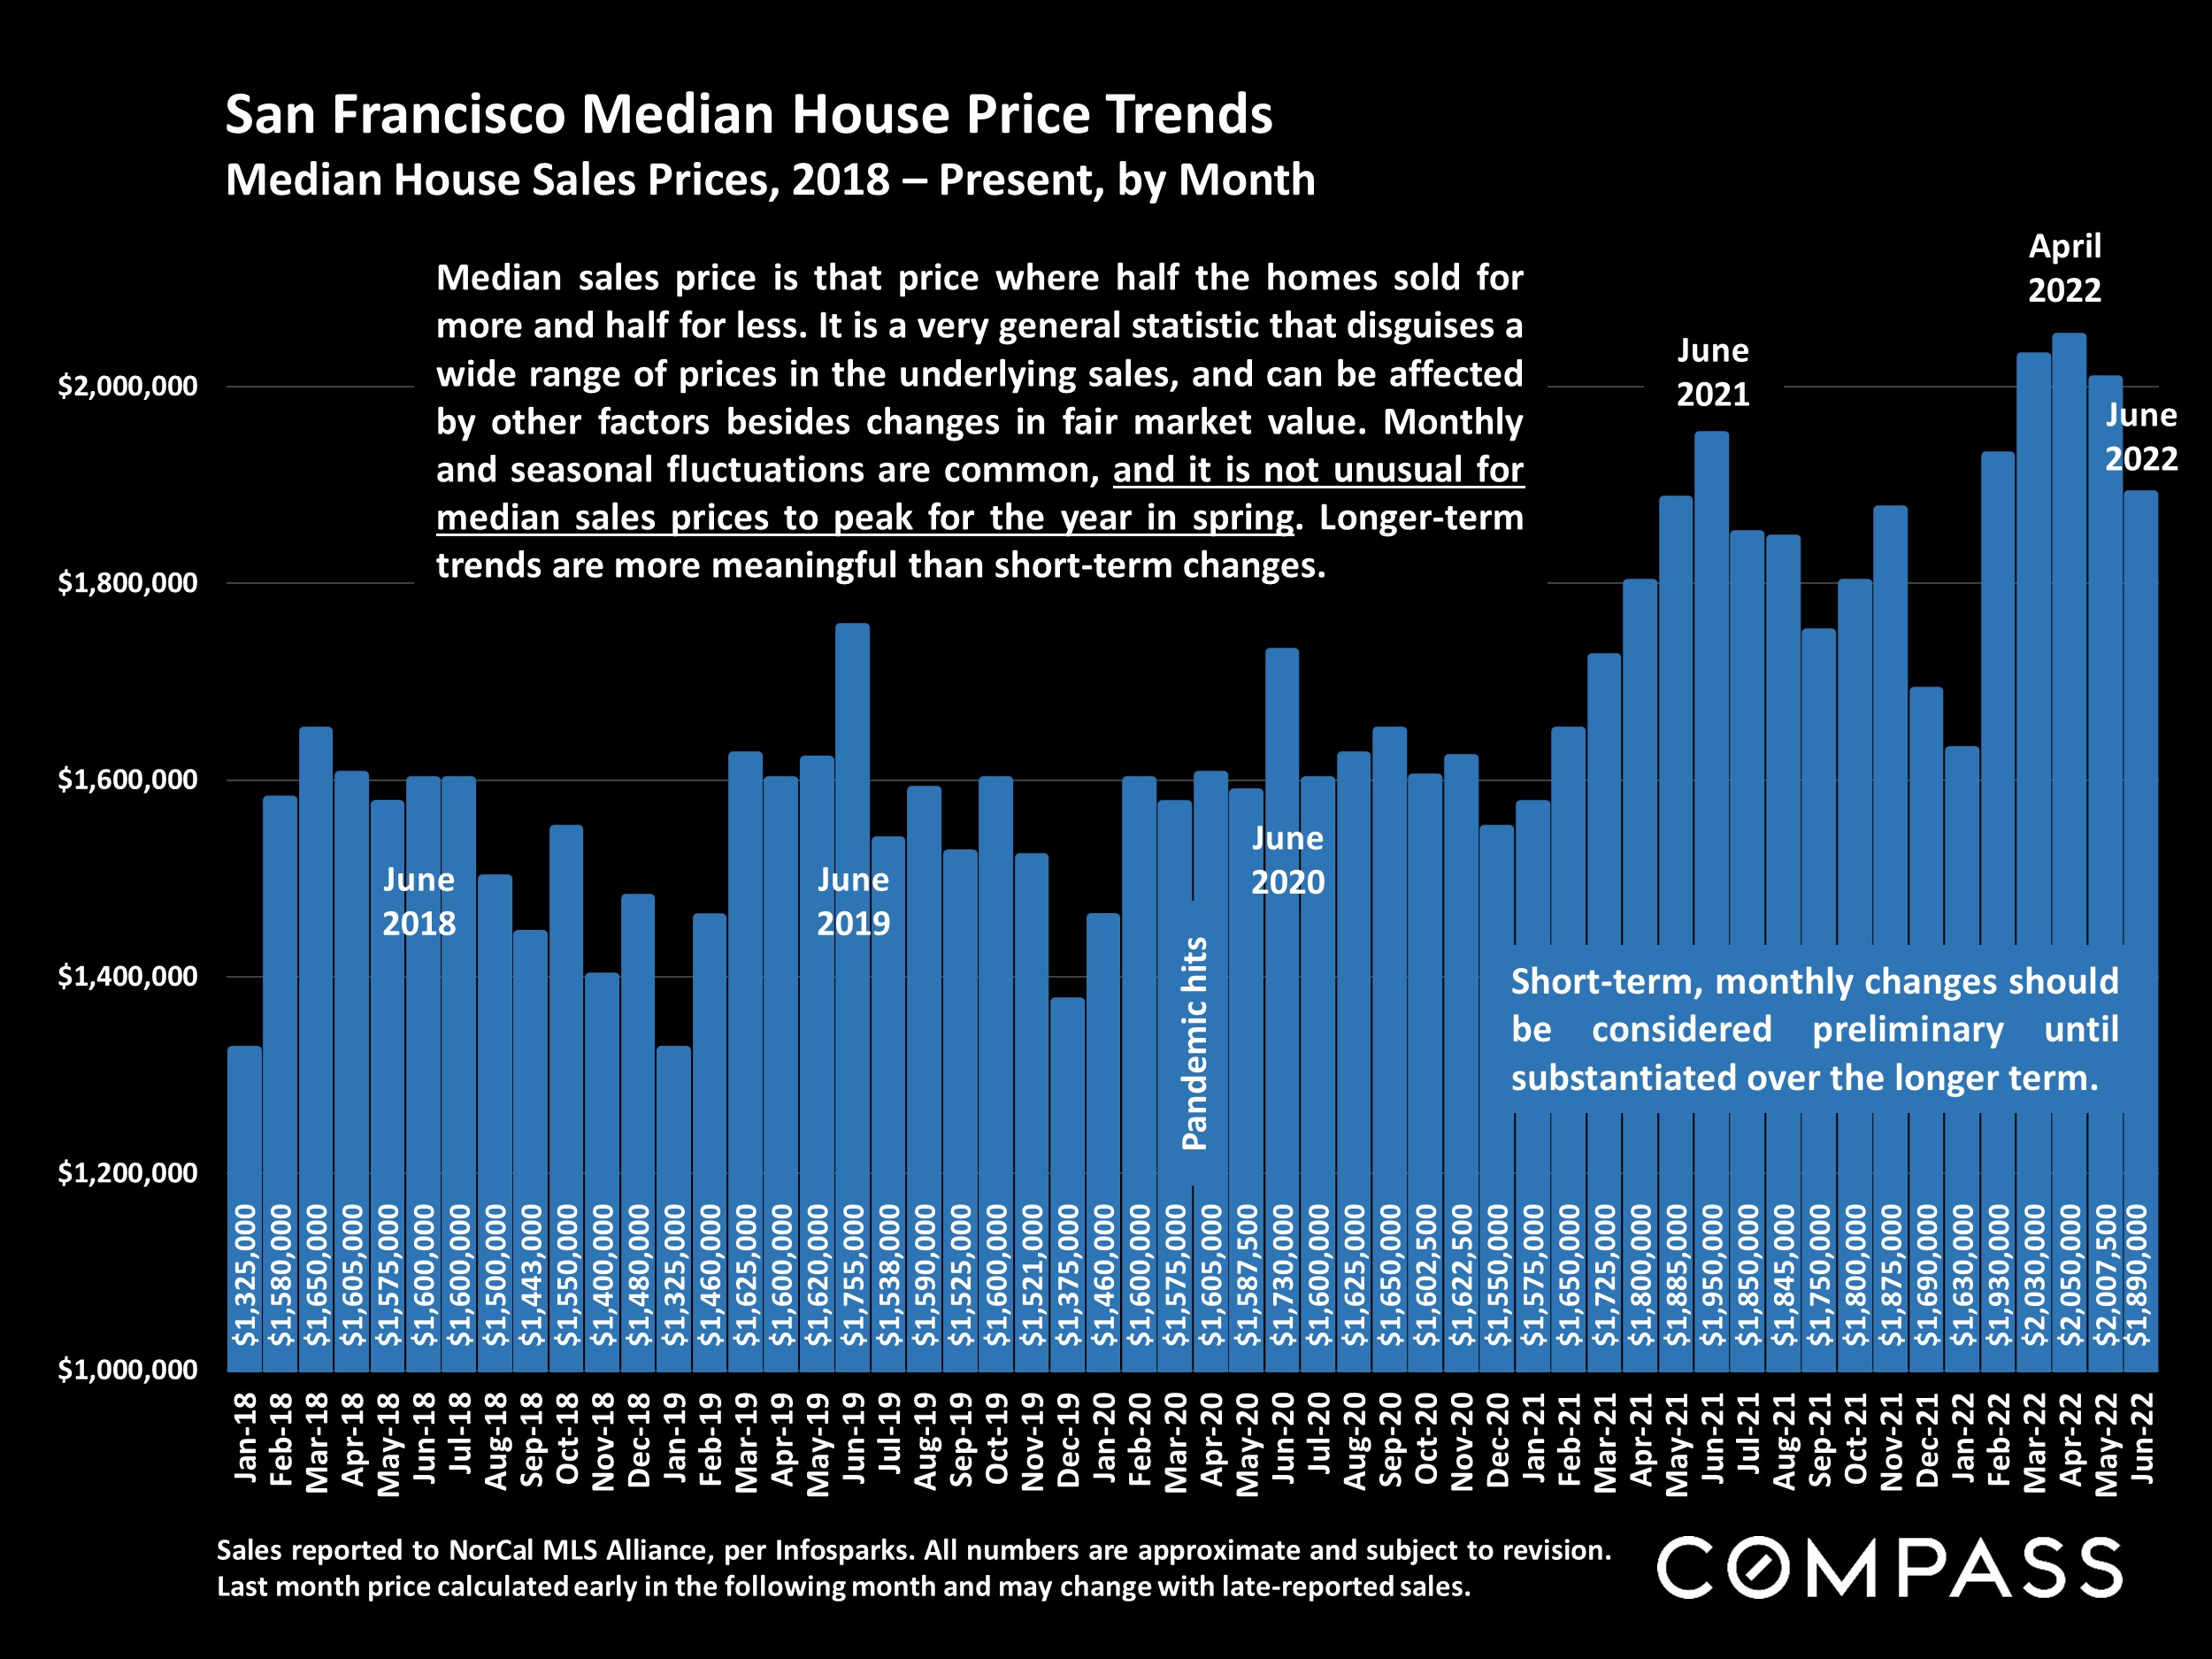
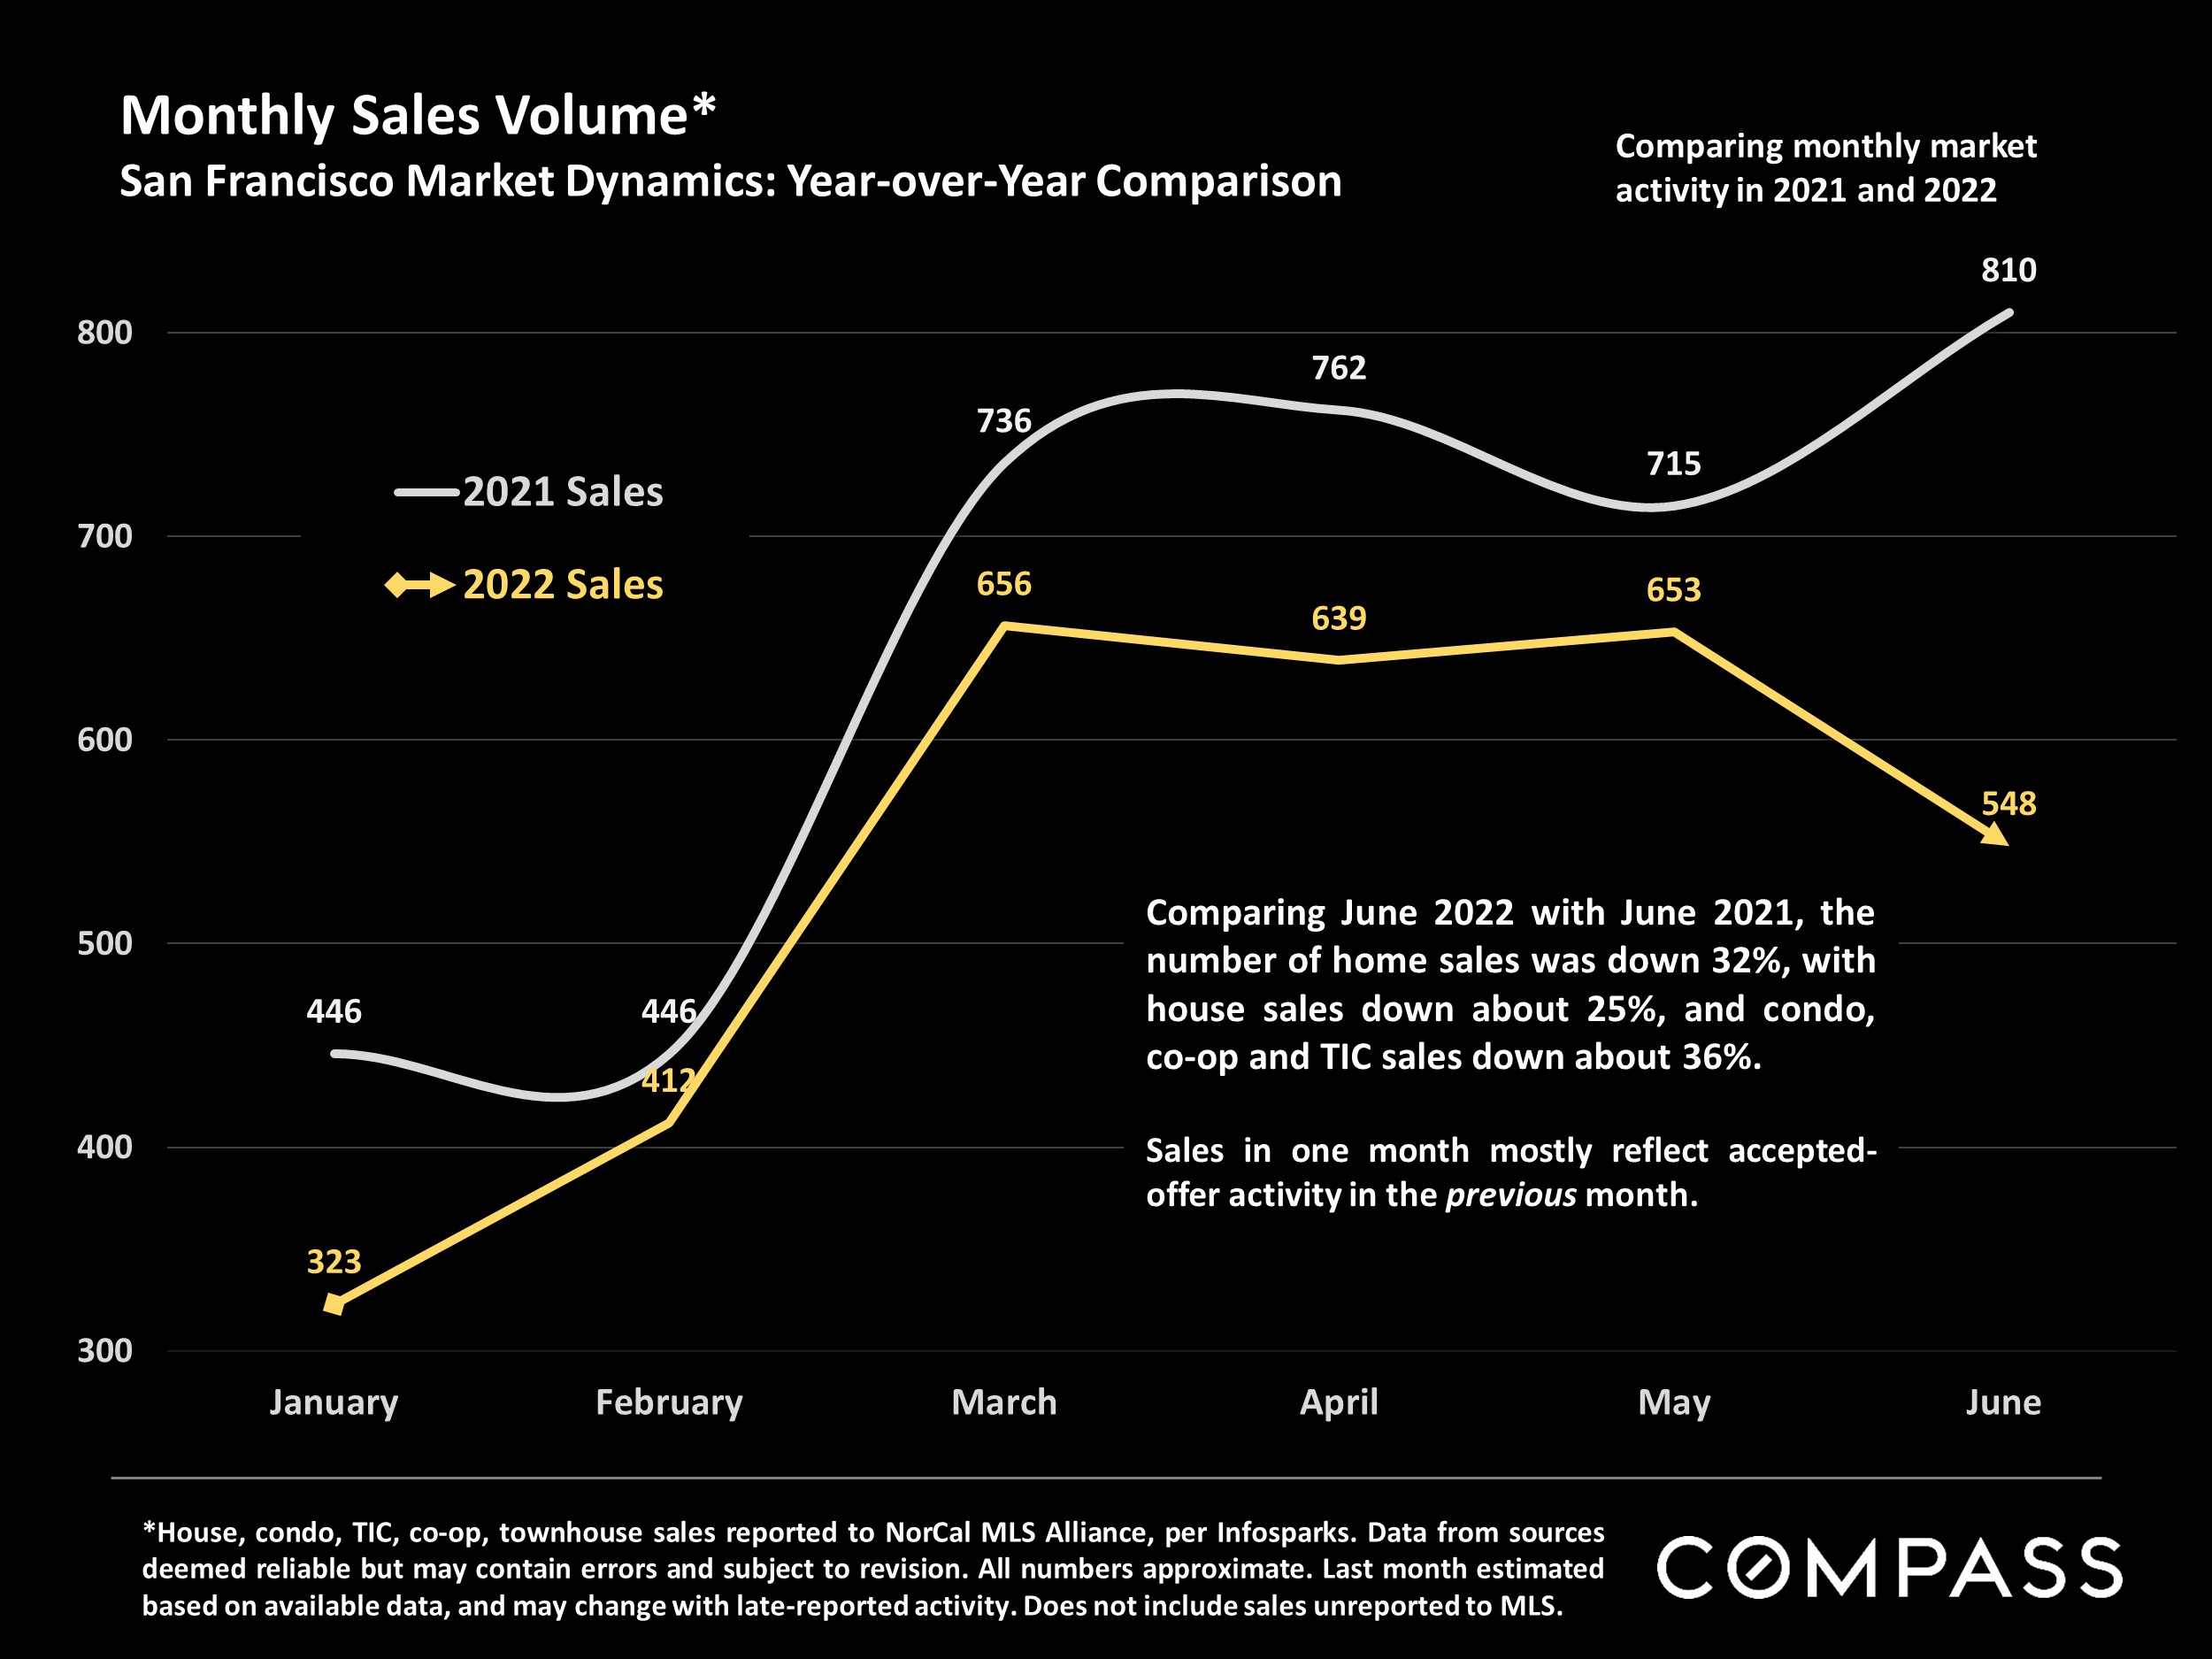
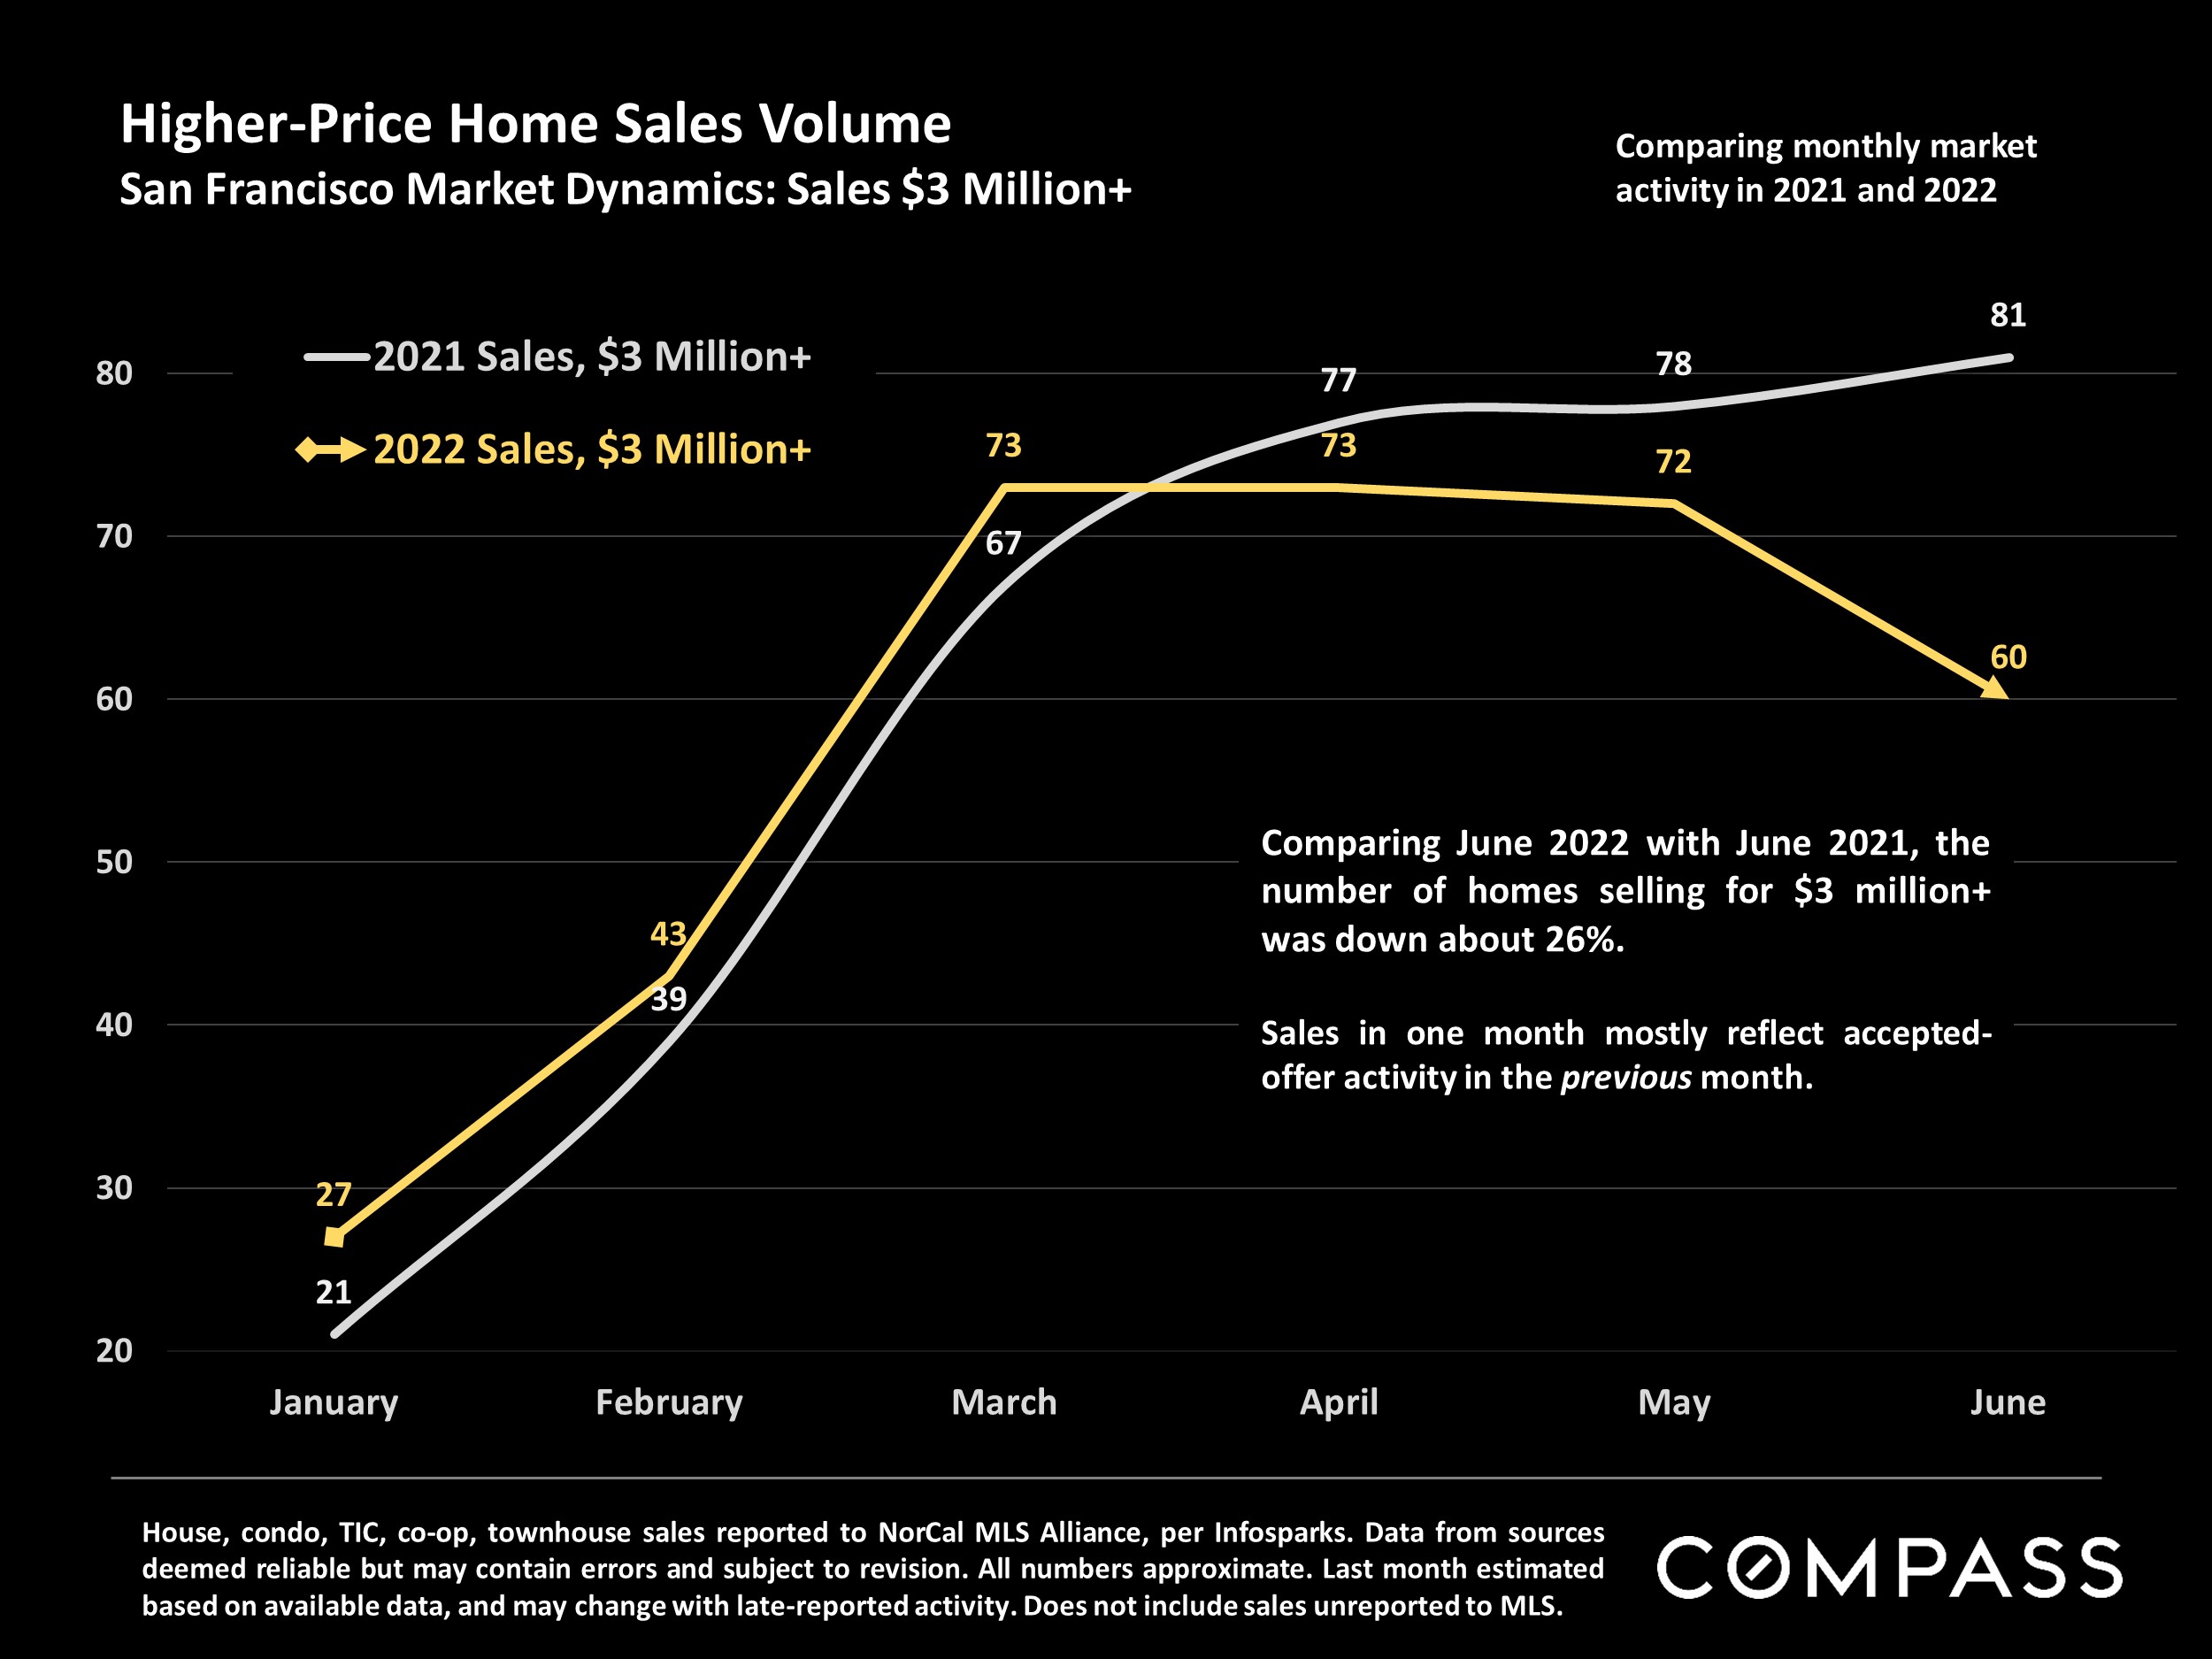
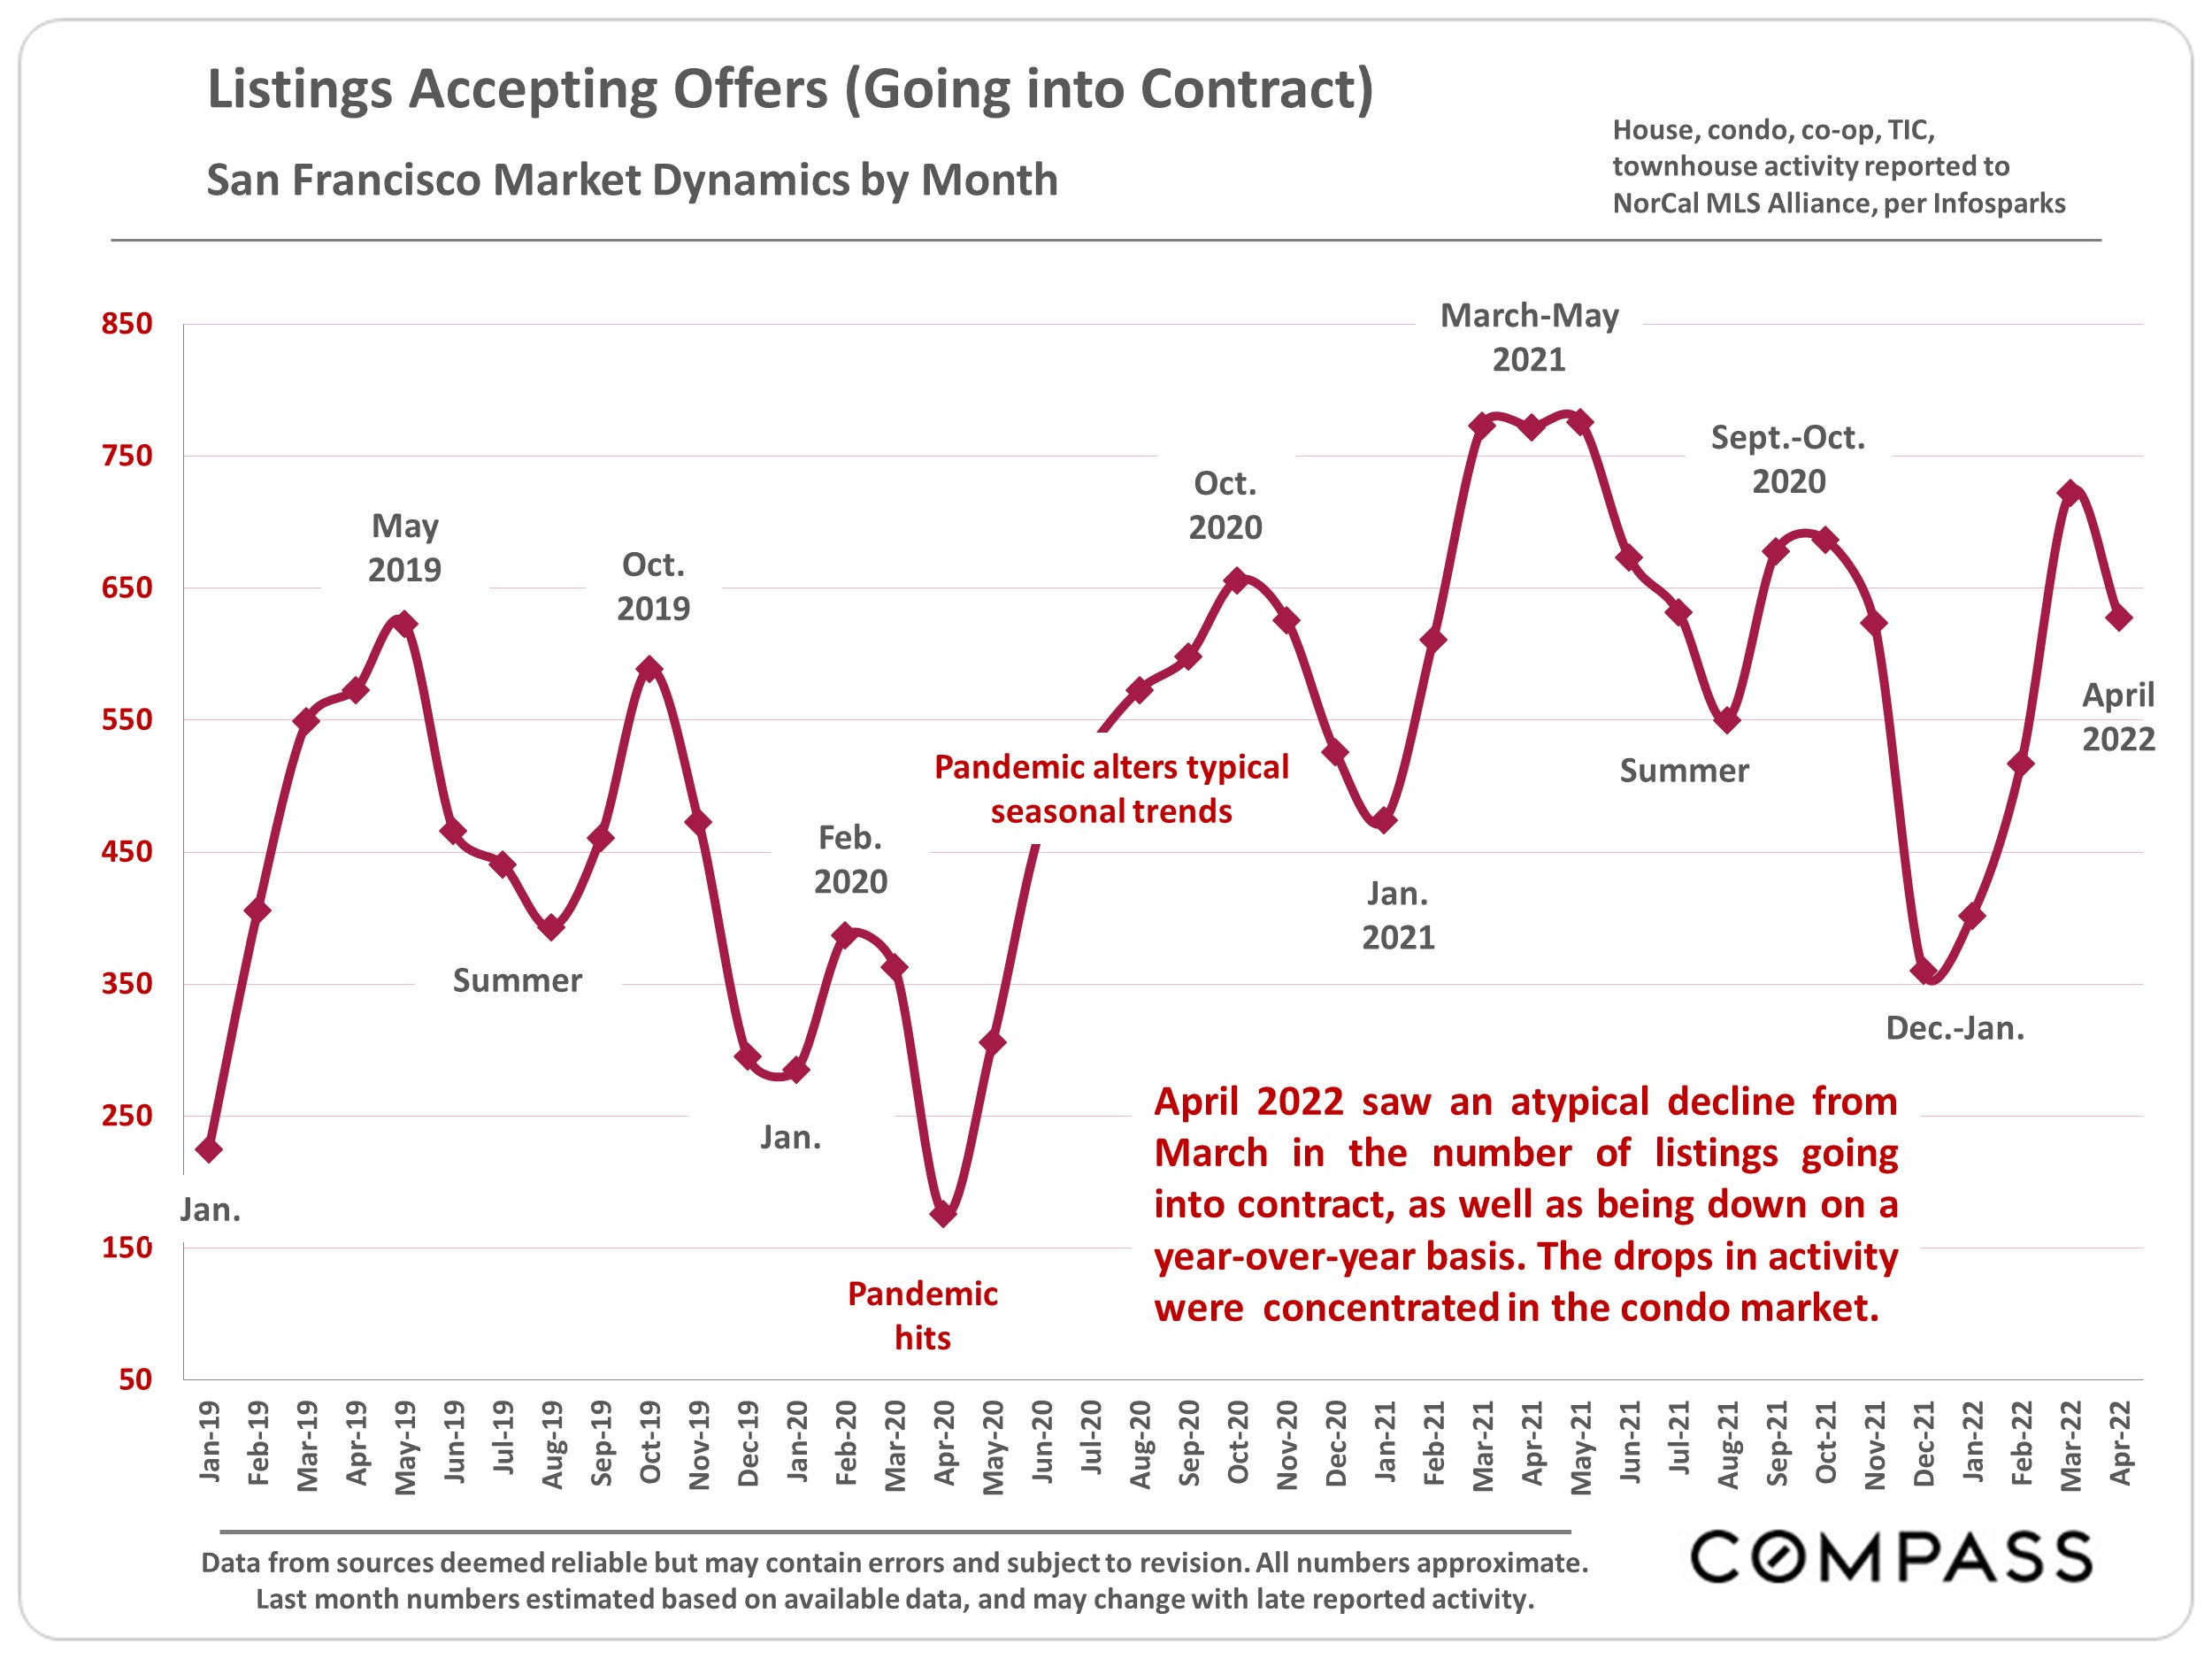
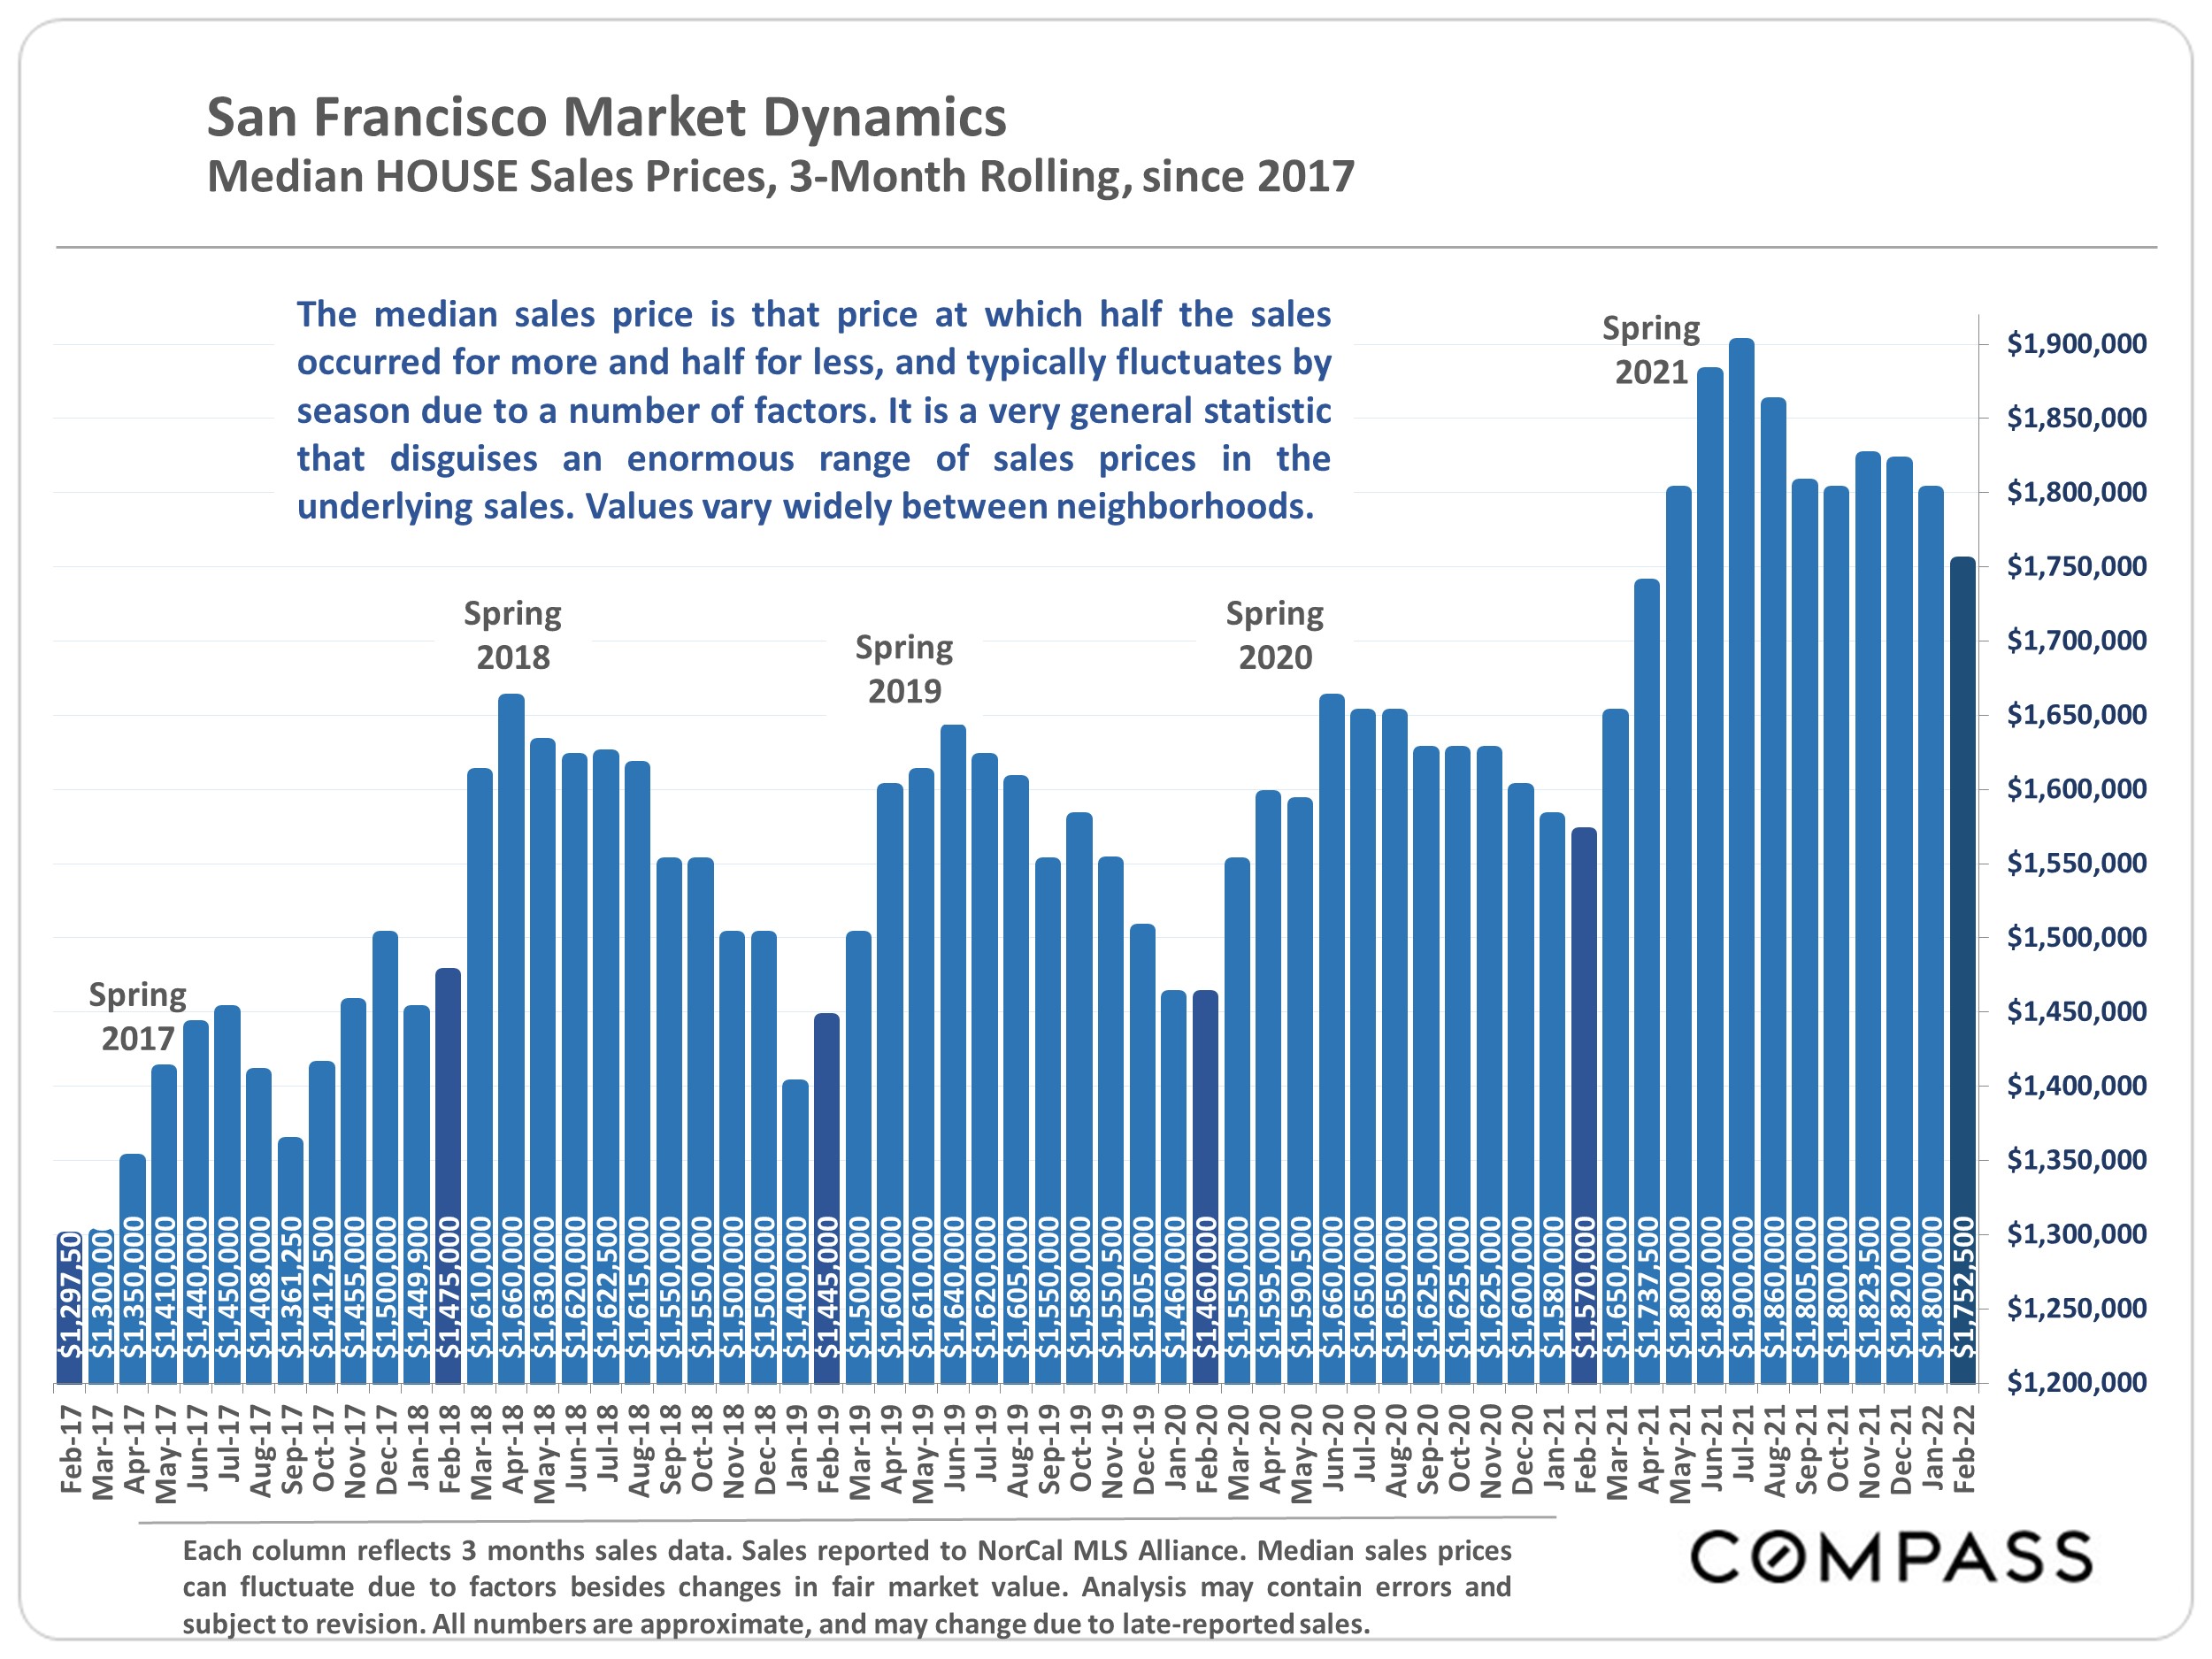
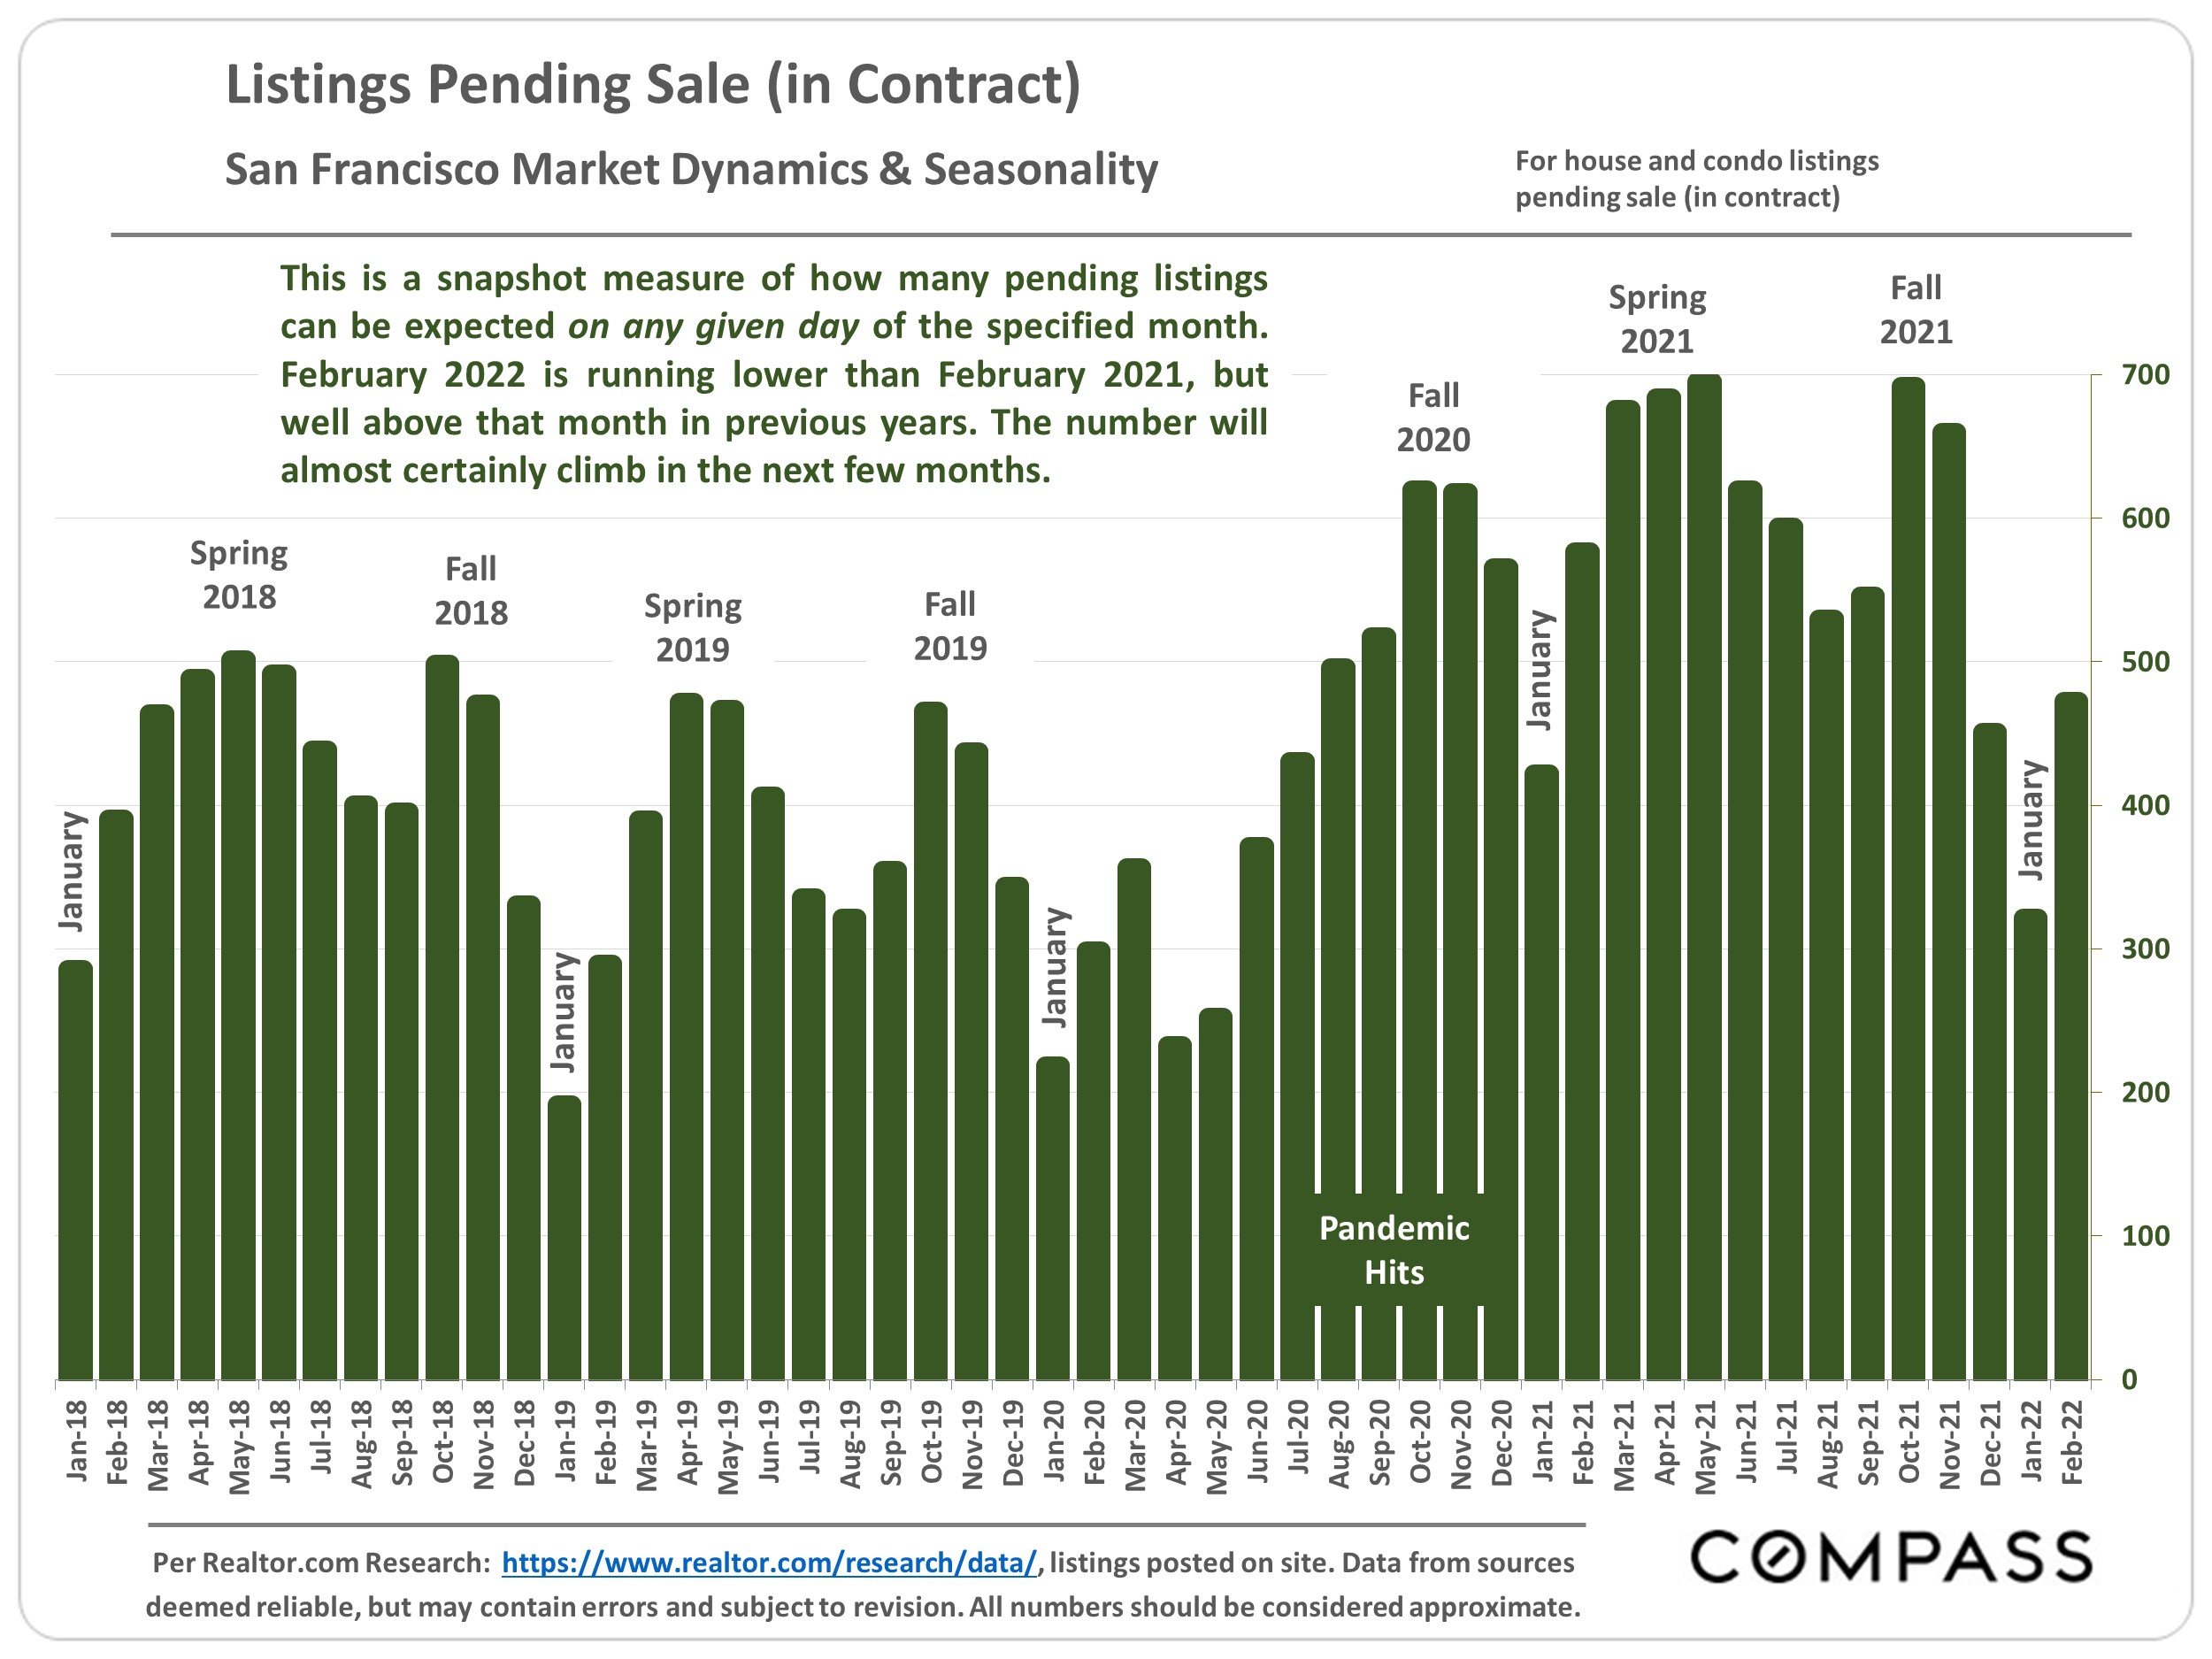
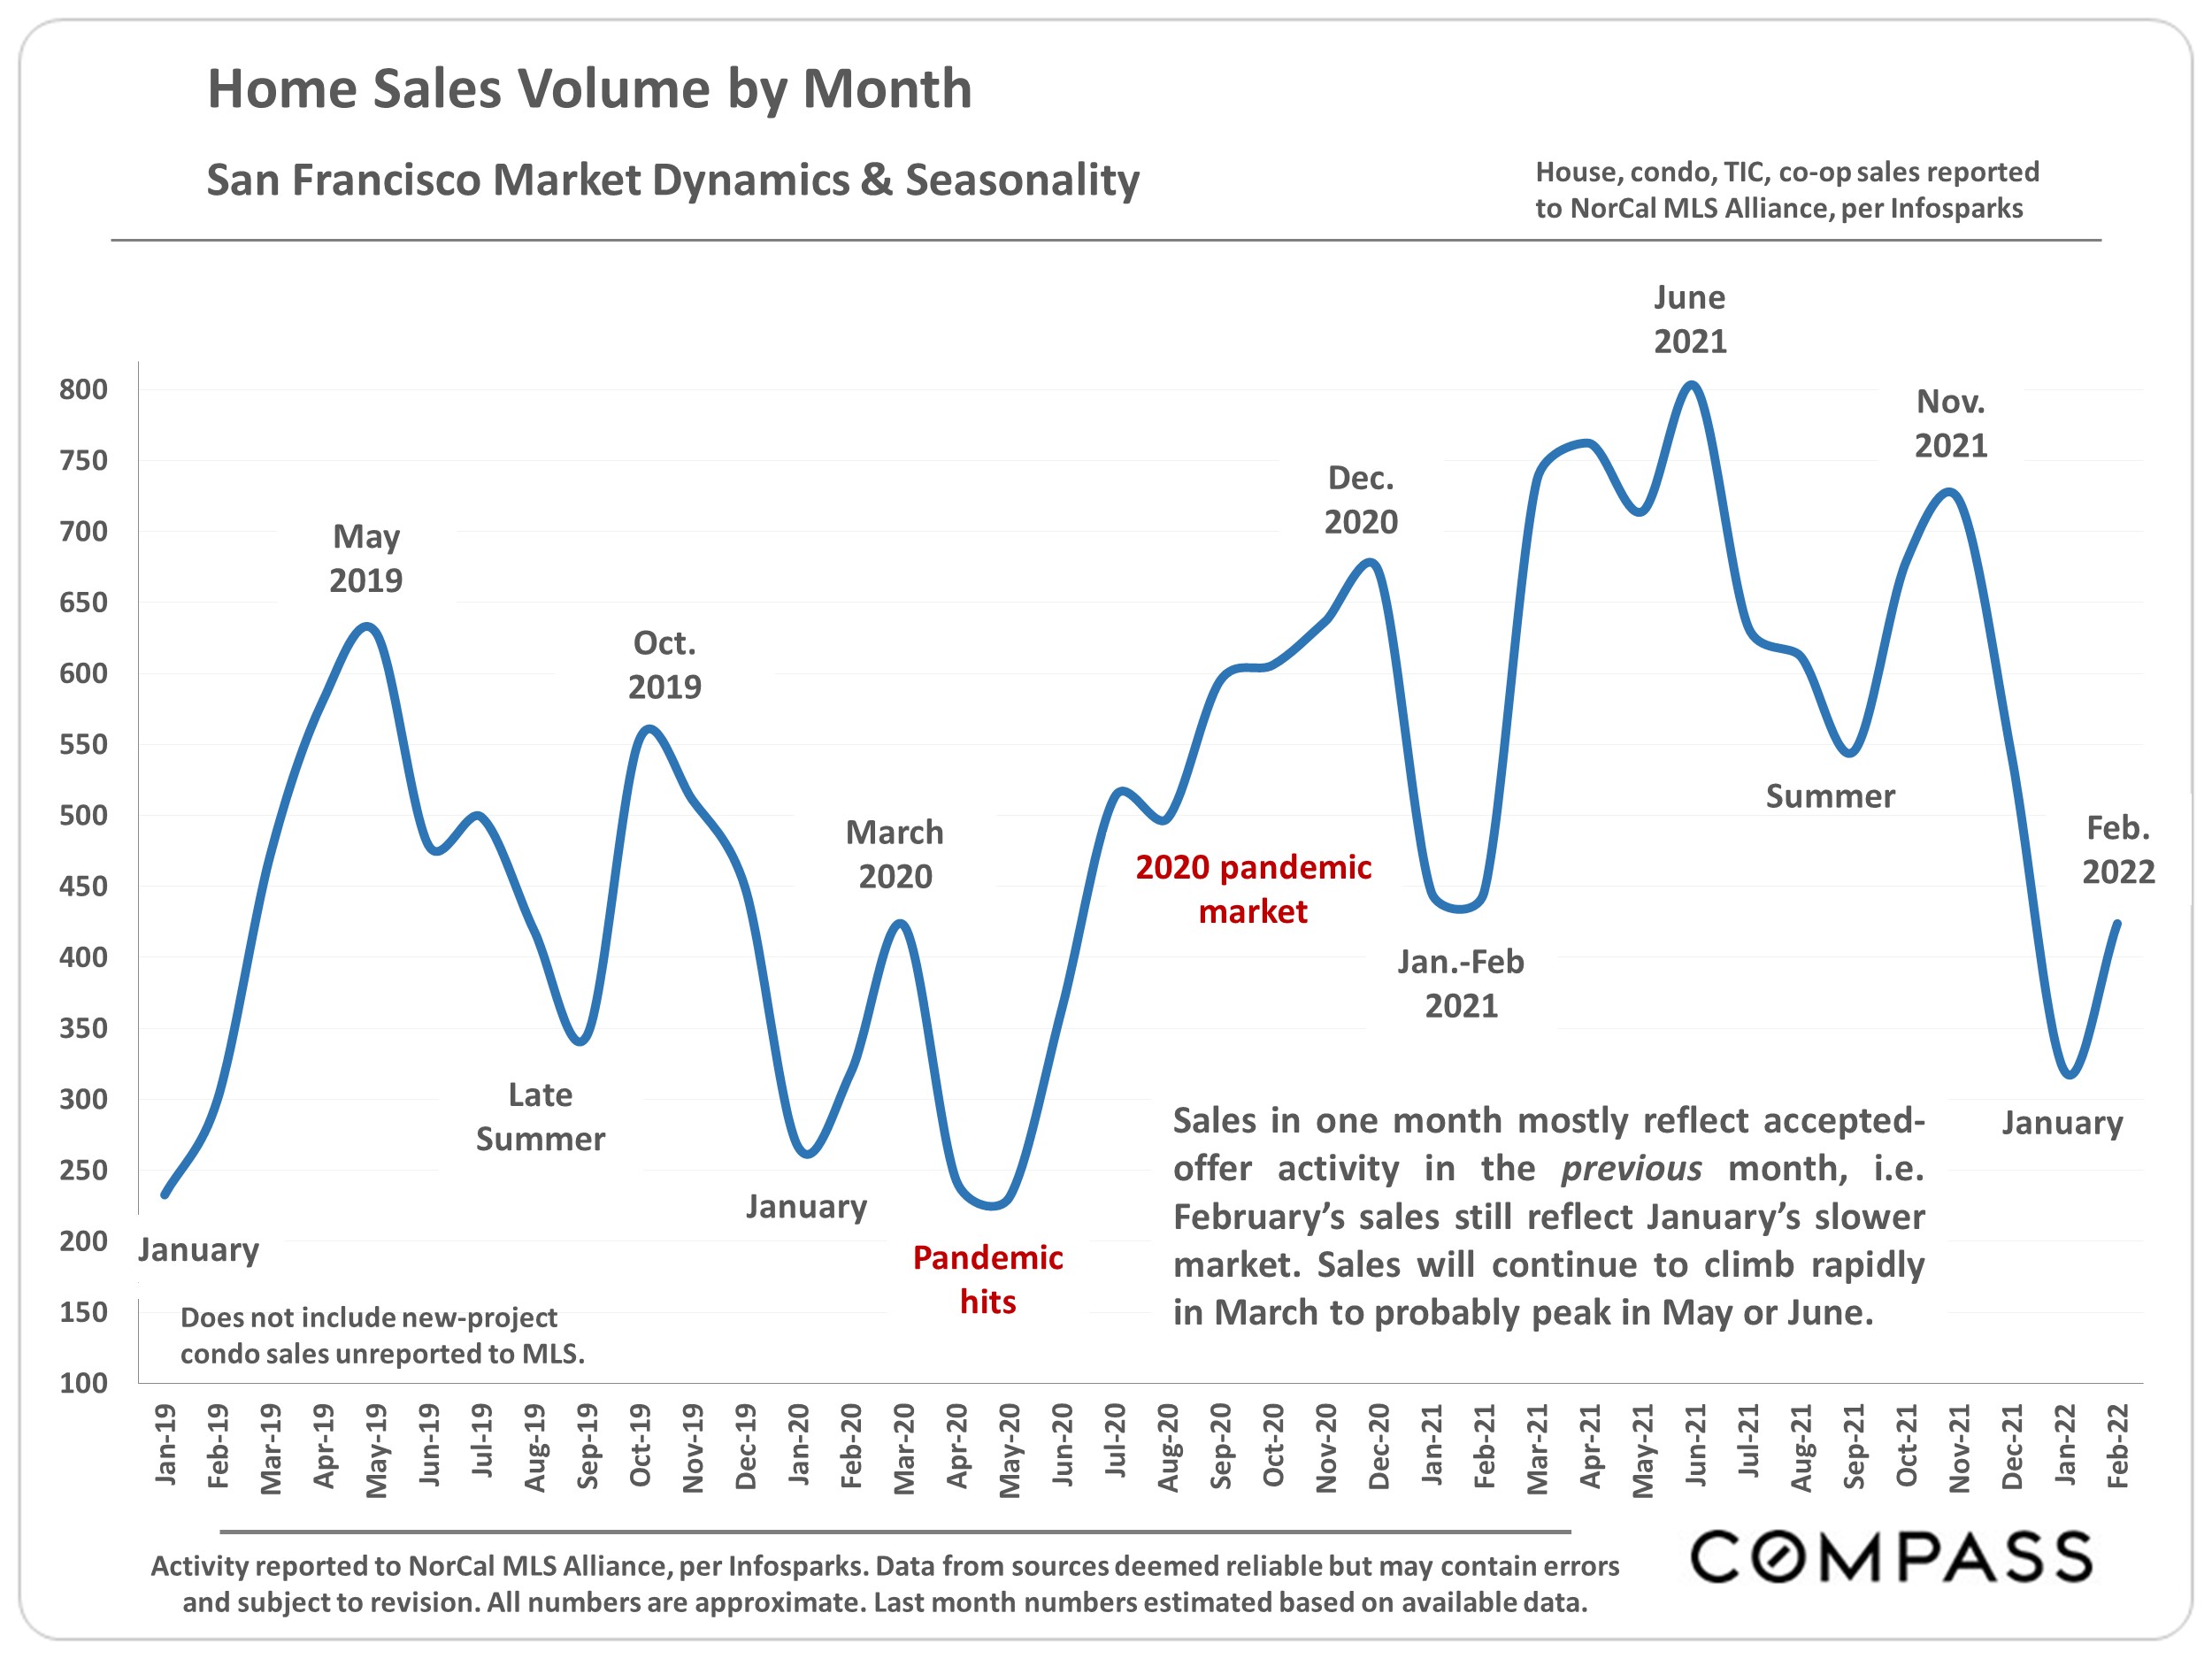
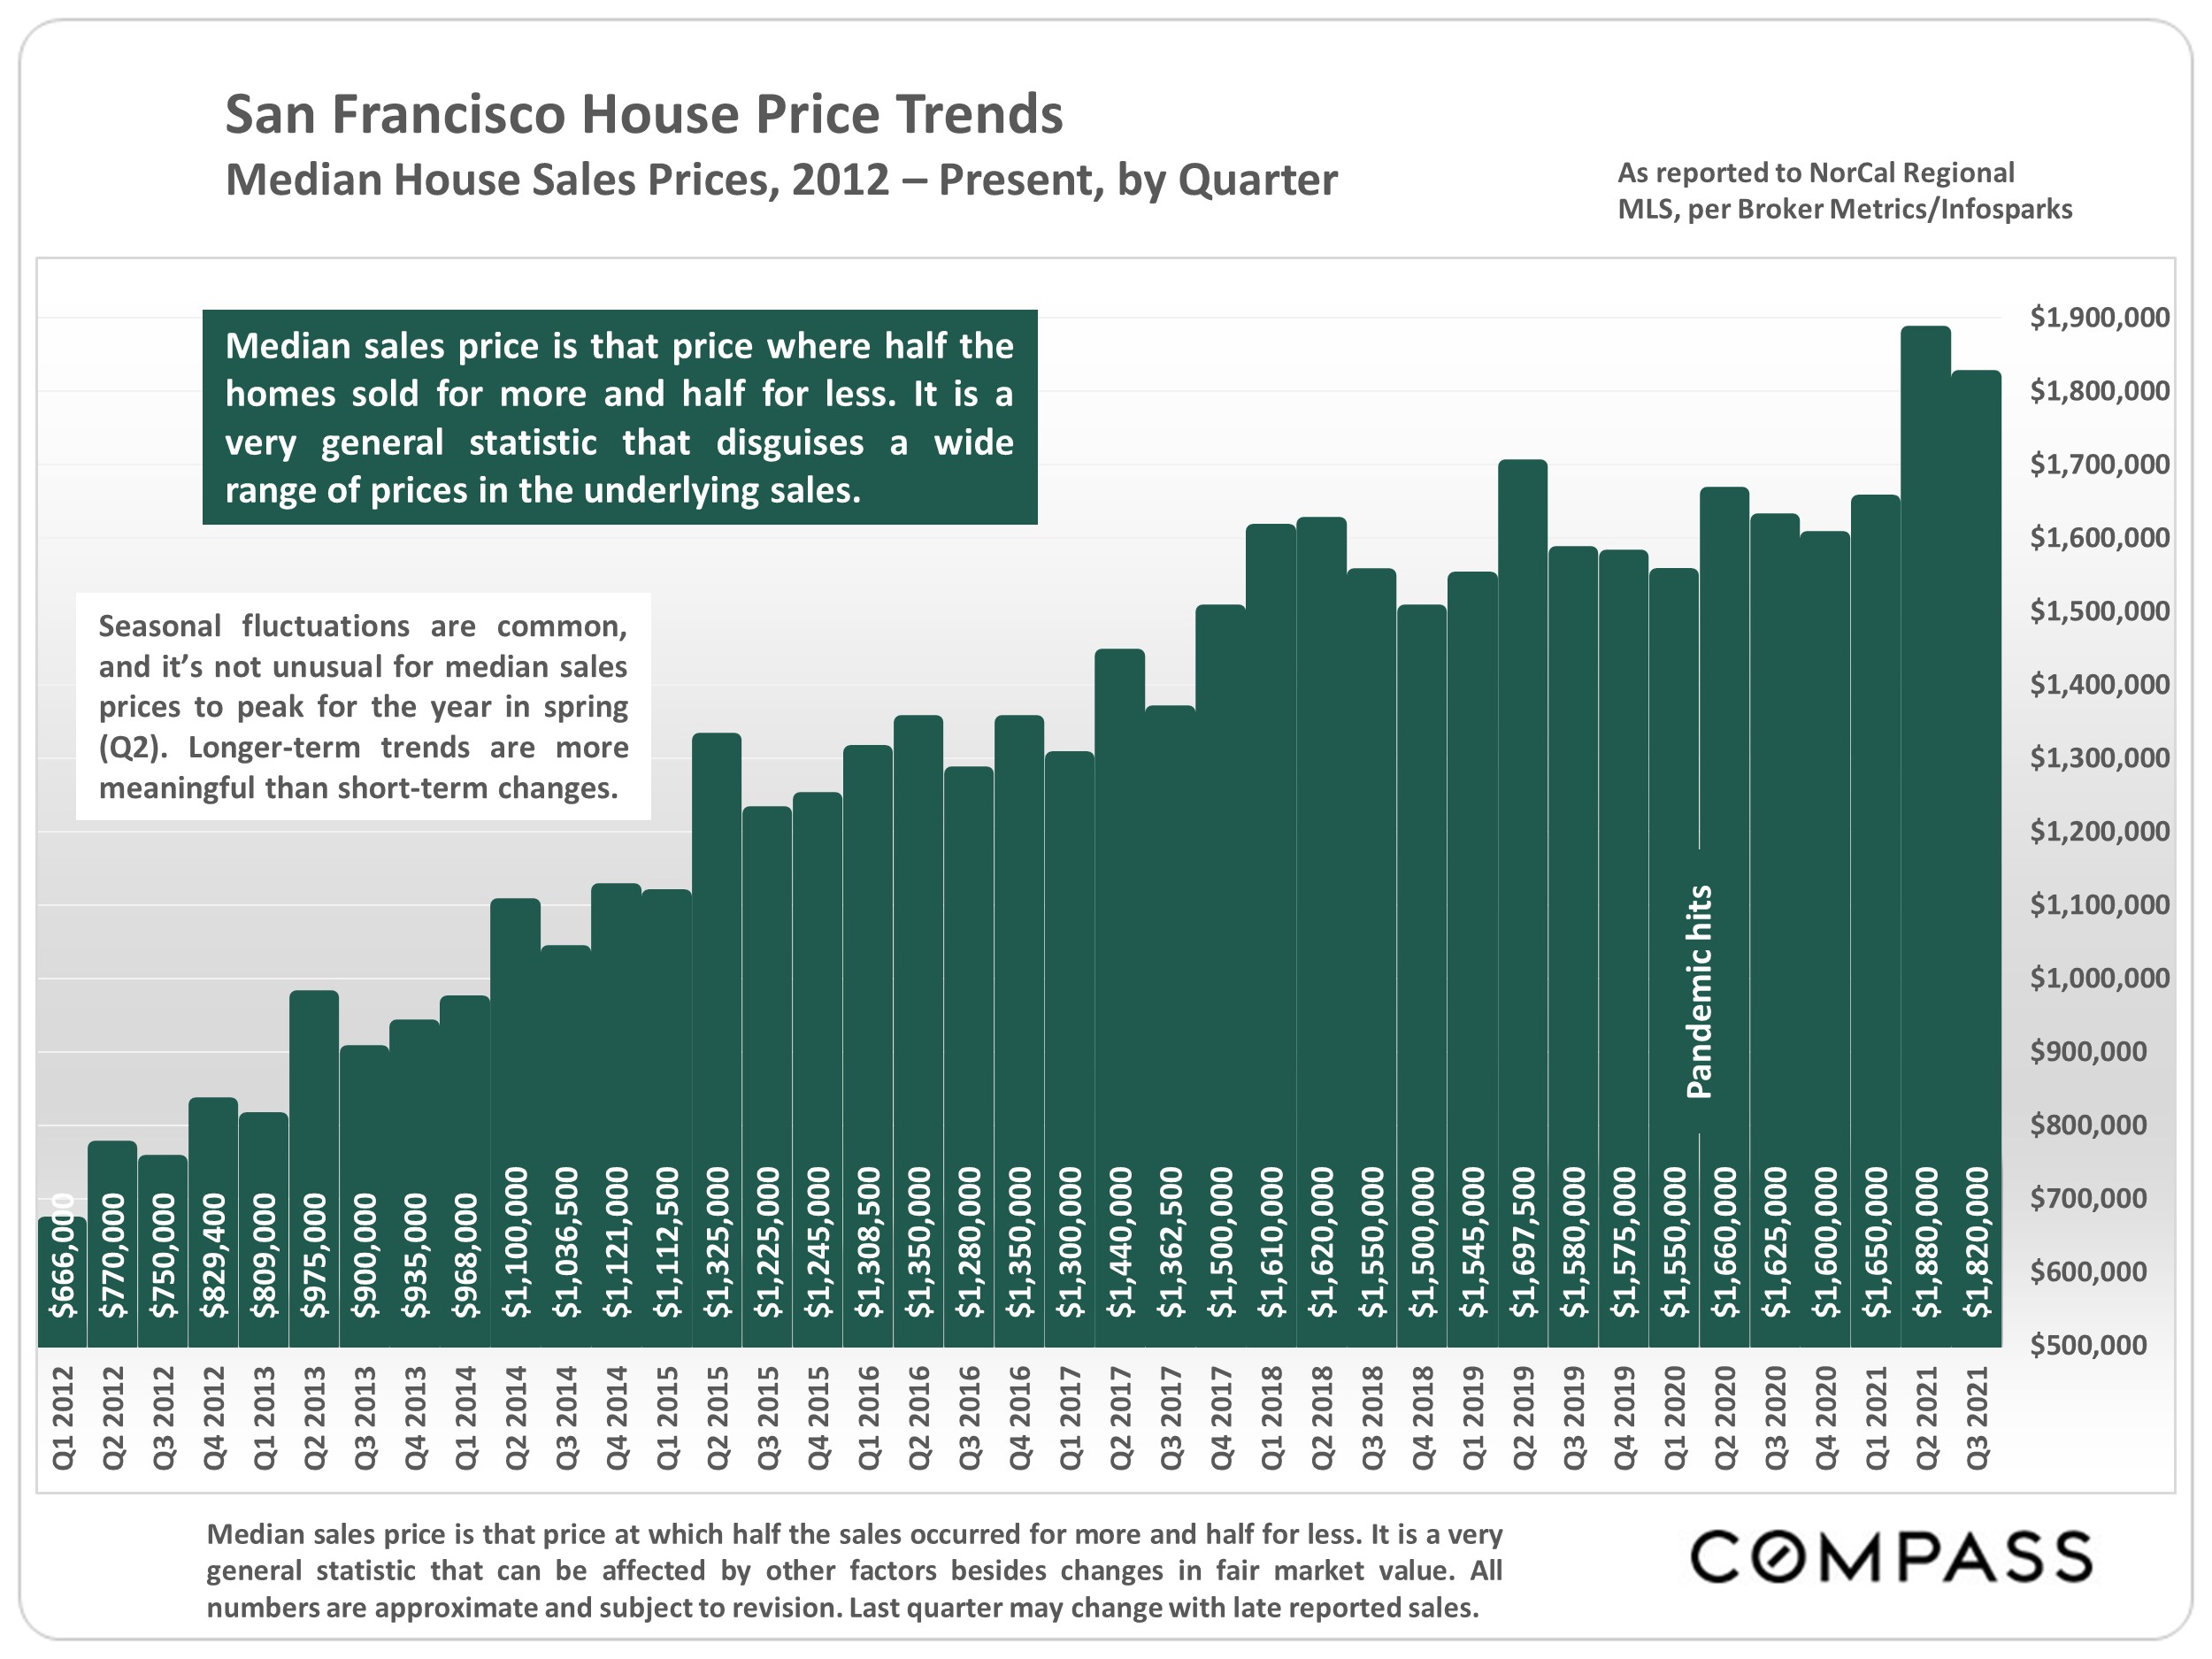
Virtually across the Bay Area, Q3 median sales prices retreated dramatically from their spring peaks, and SF was hit
harder than most area markets. Part of this was due to seasonal trends – median sales prices often peak for the
calendar year in Q2, then drop in summer – but part of the decline was clearly due to changing market conditions
prompted by shifts in interest rates, inflation, stock markets, and consumer confidence.
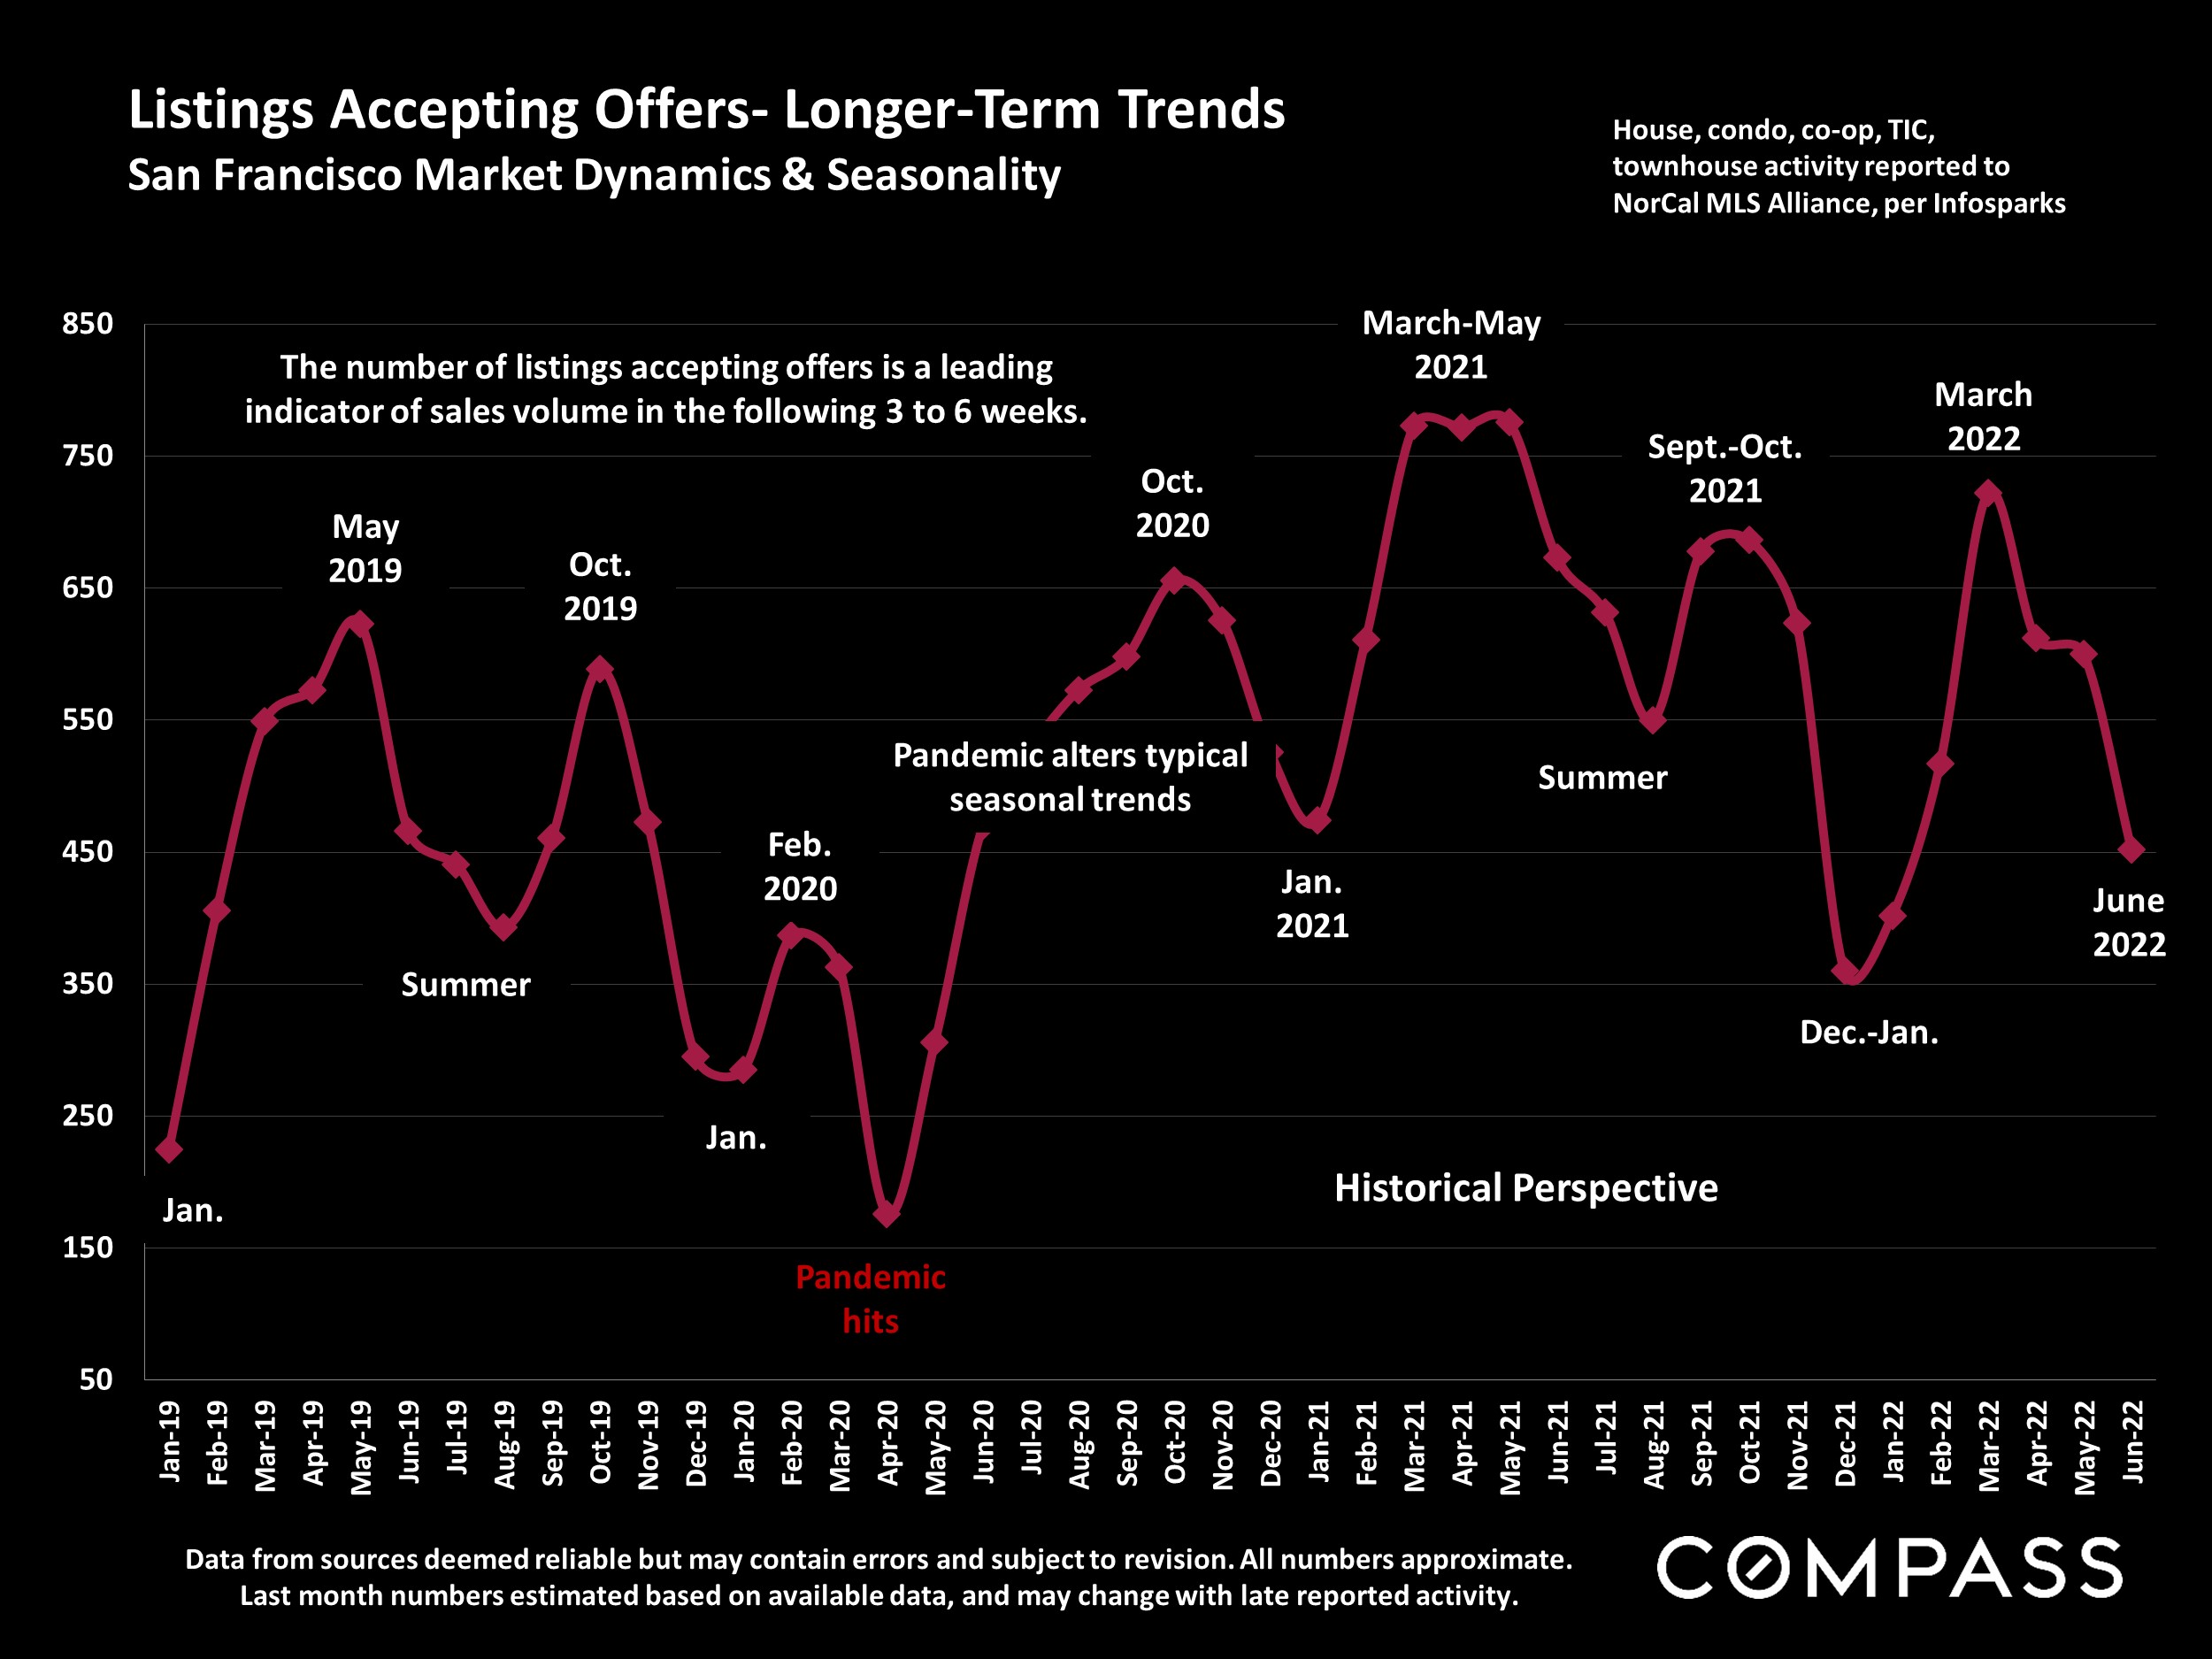
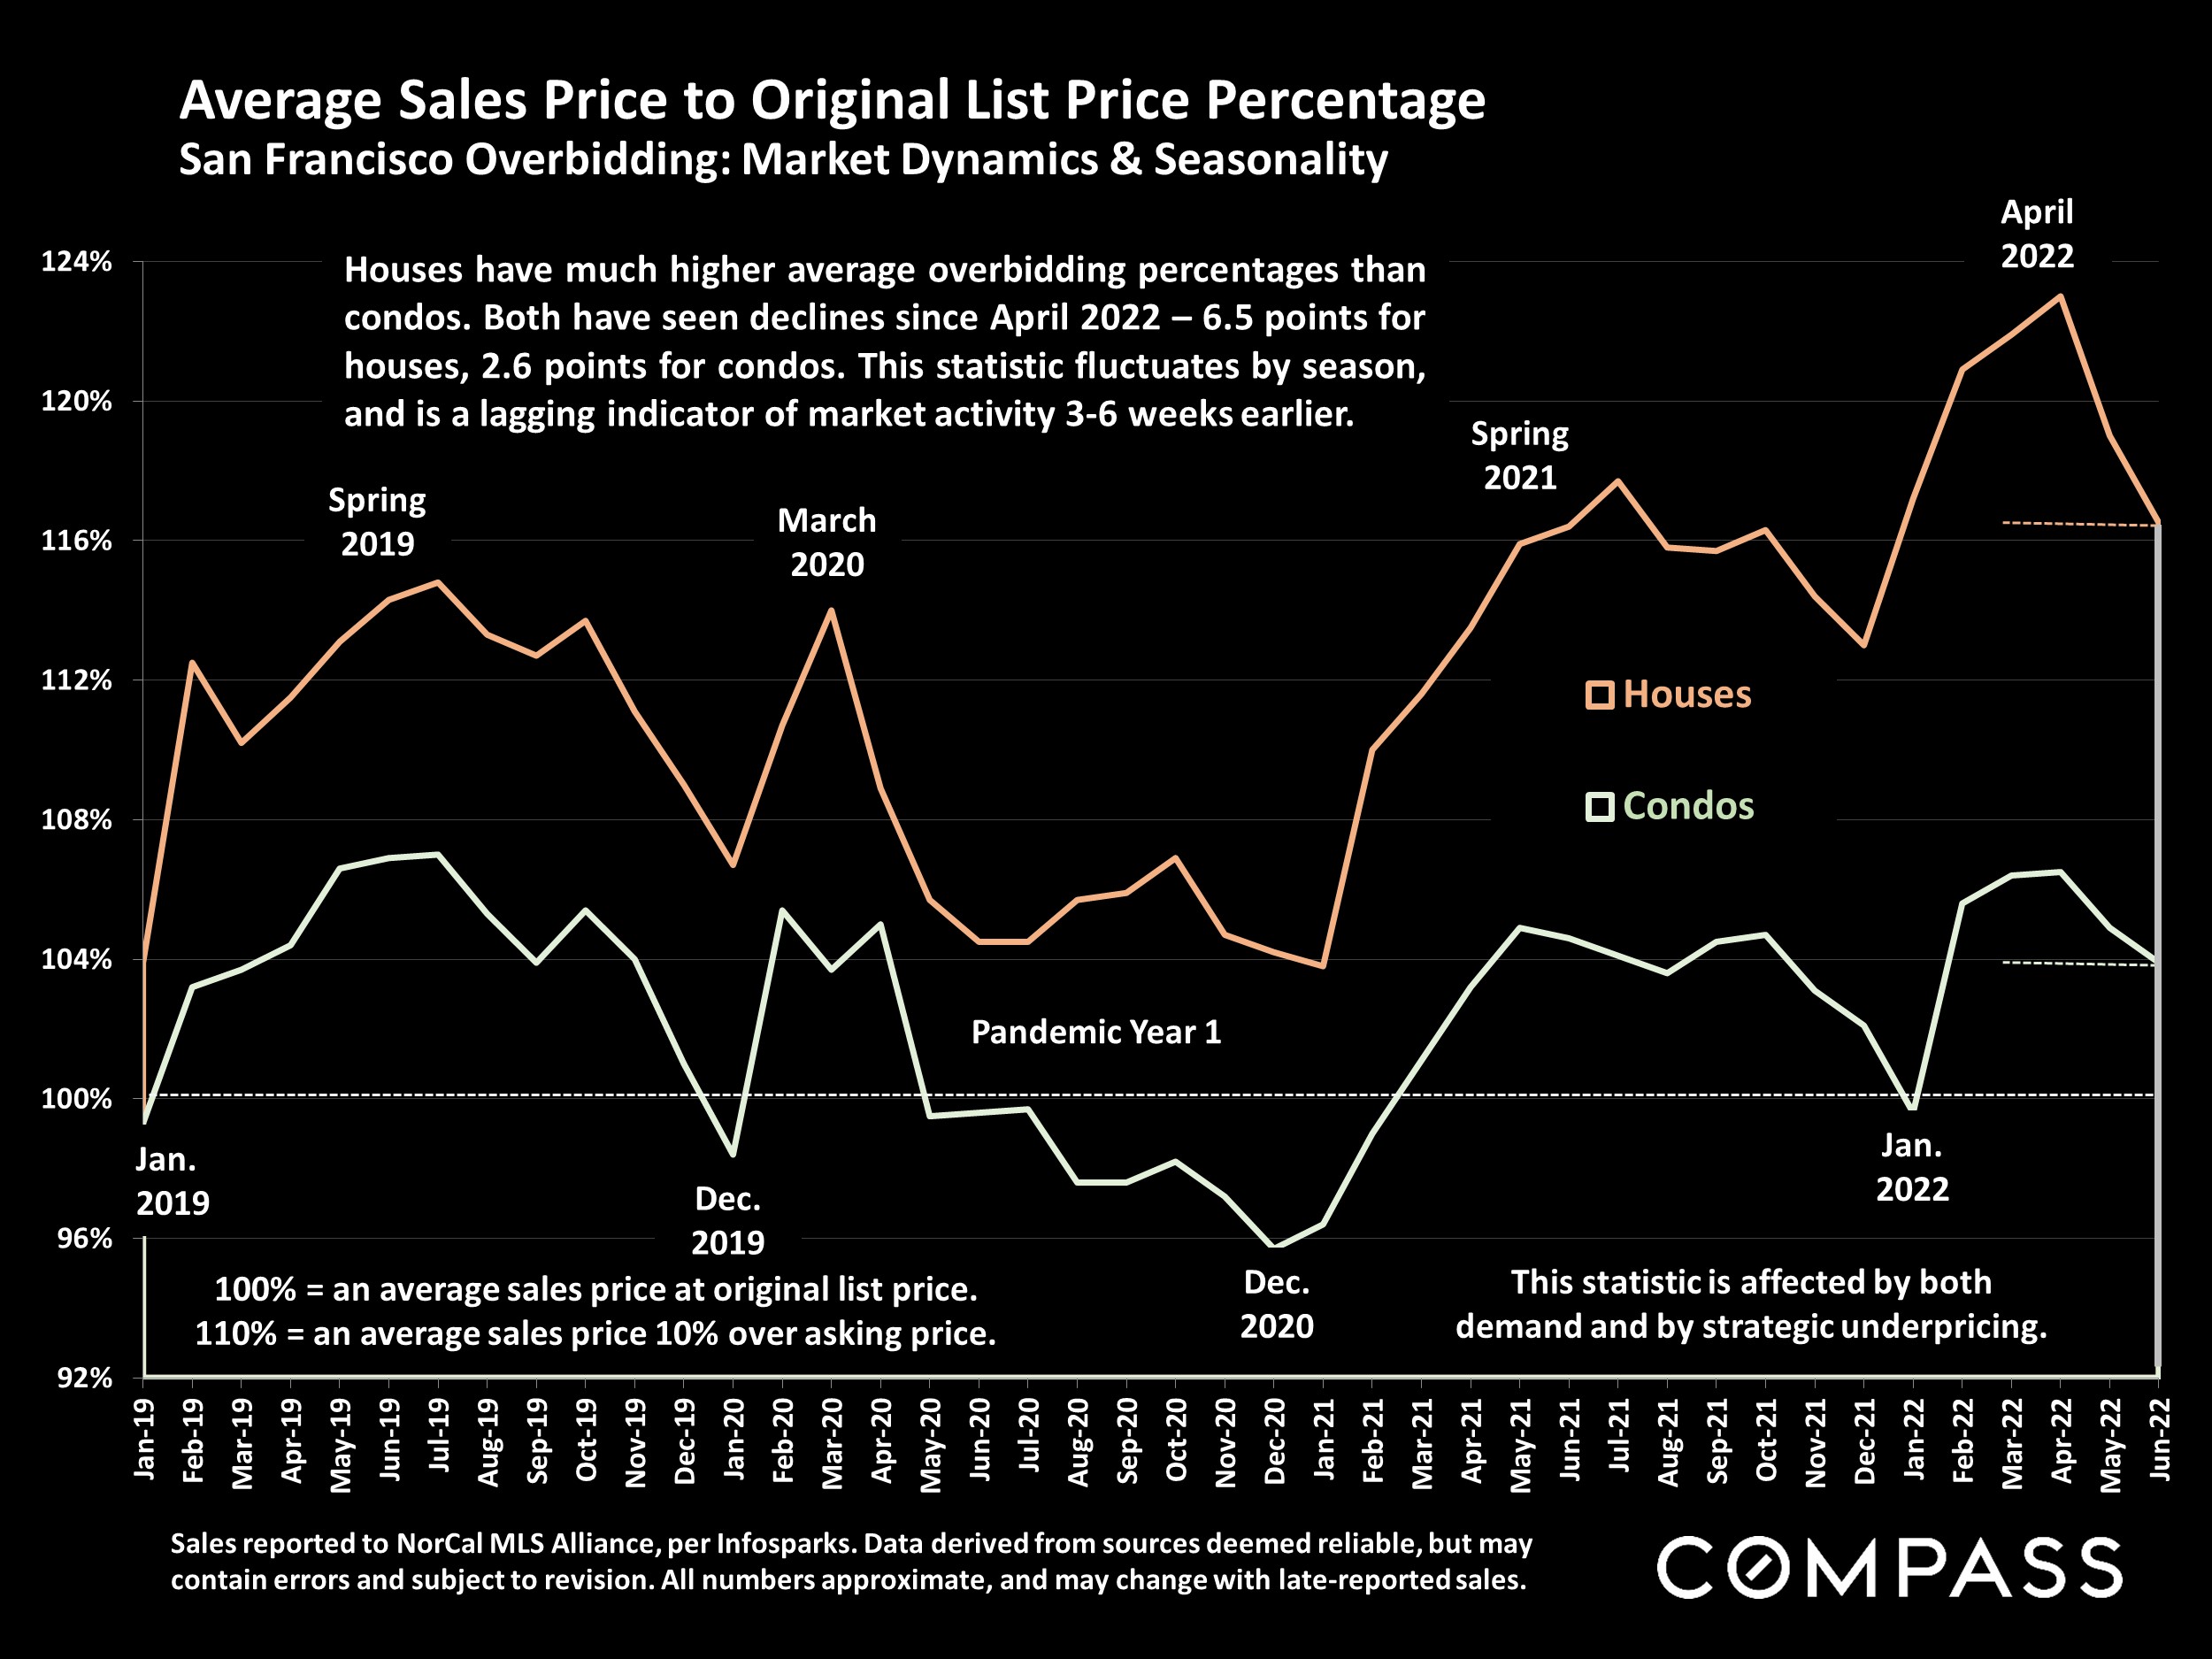
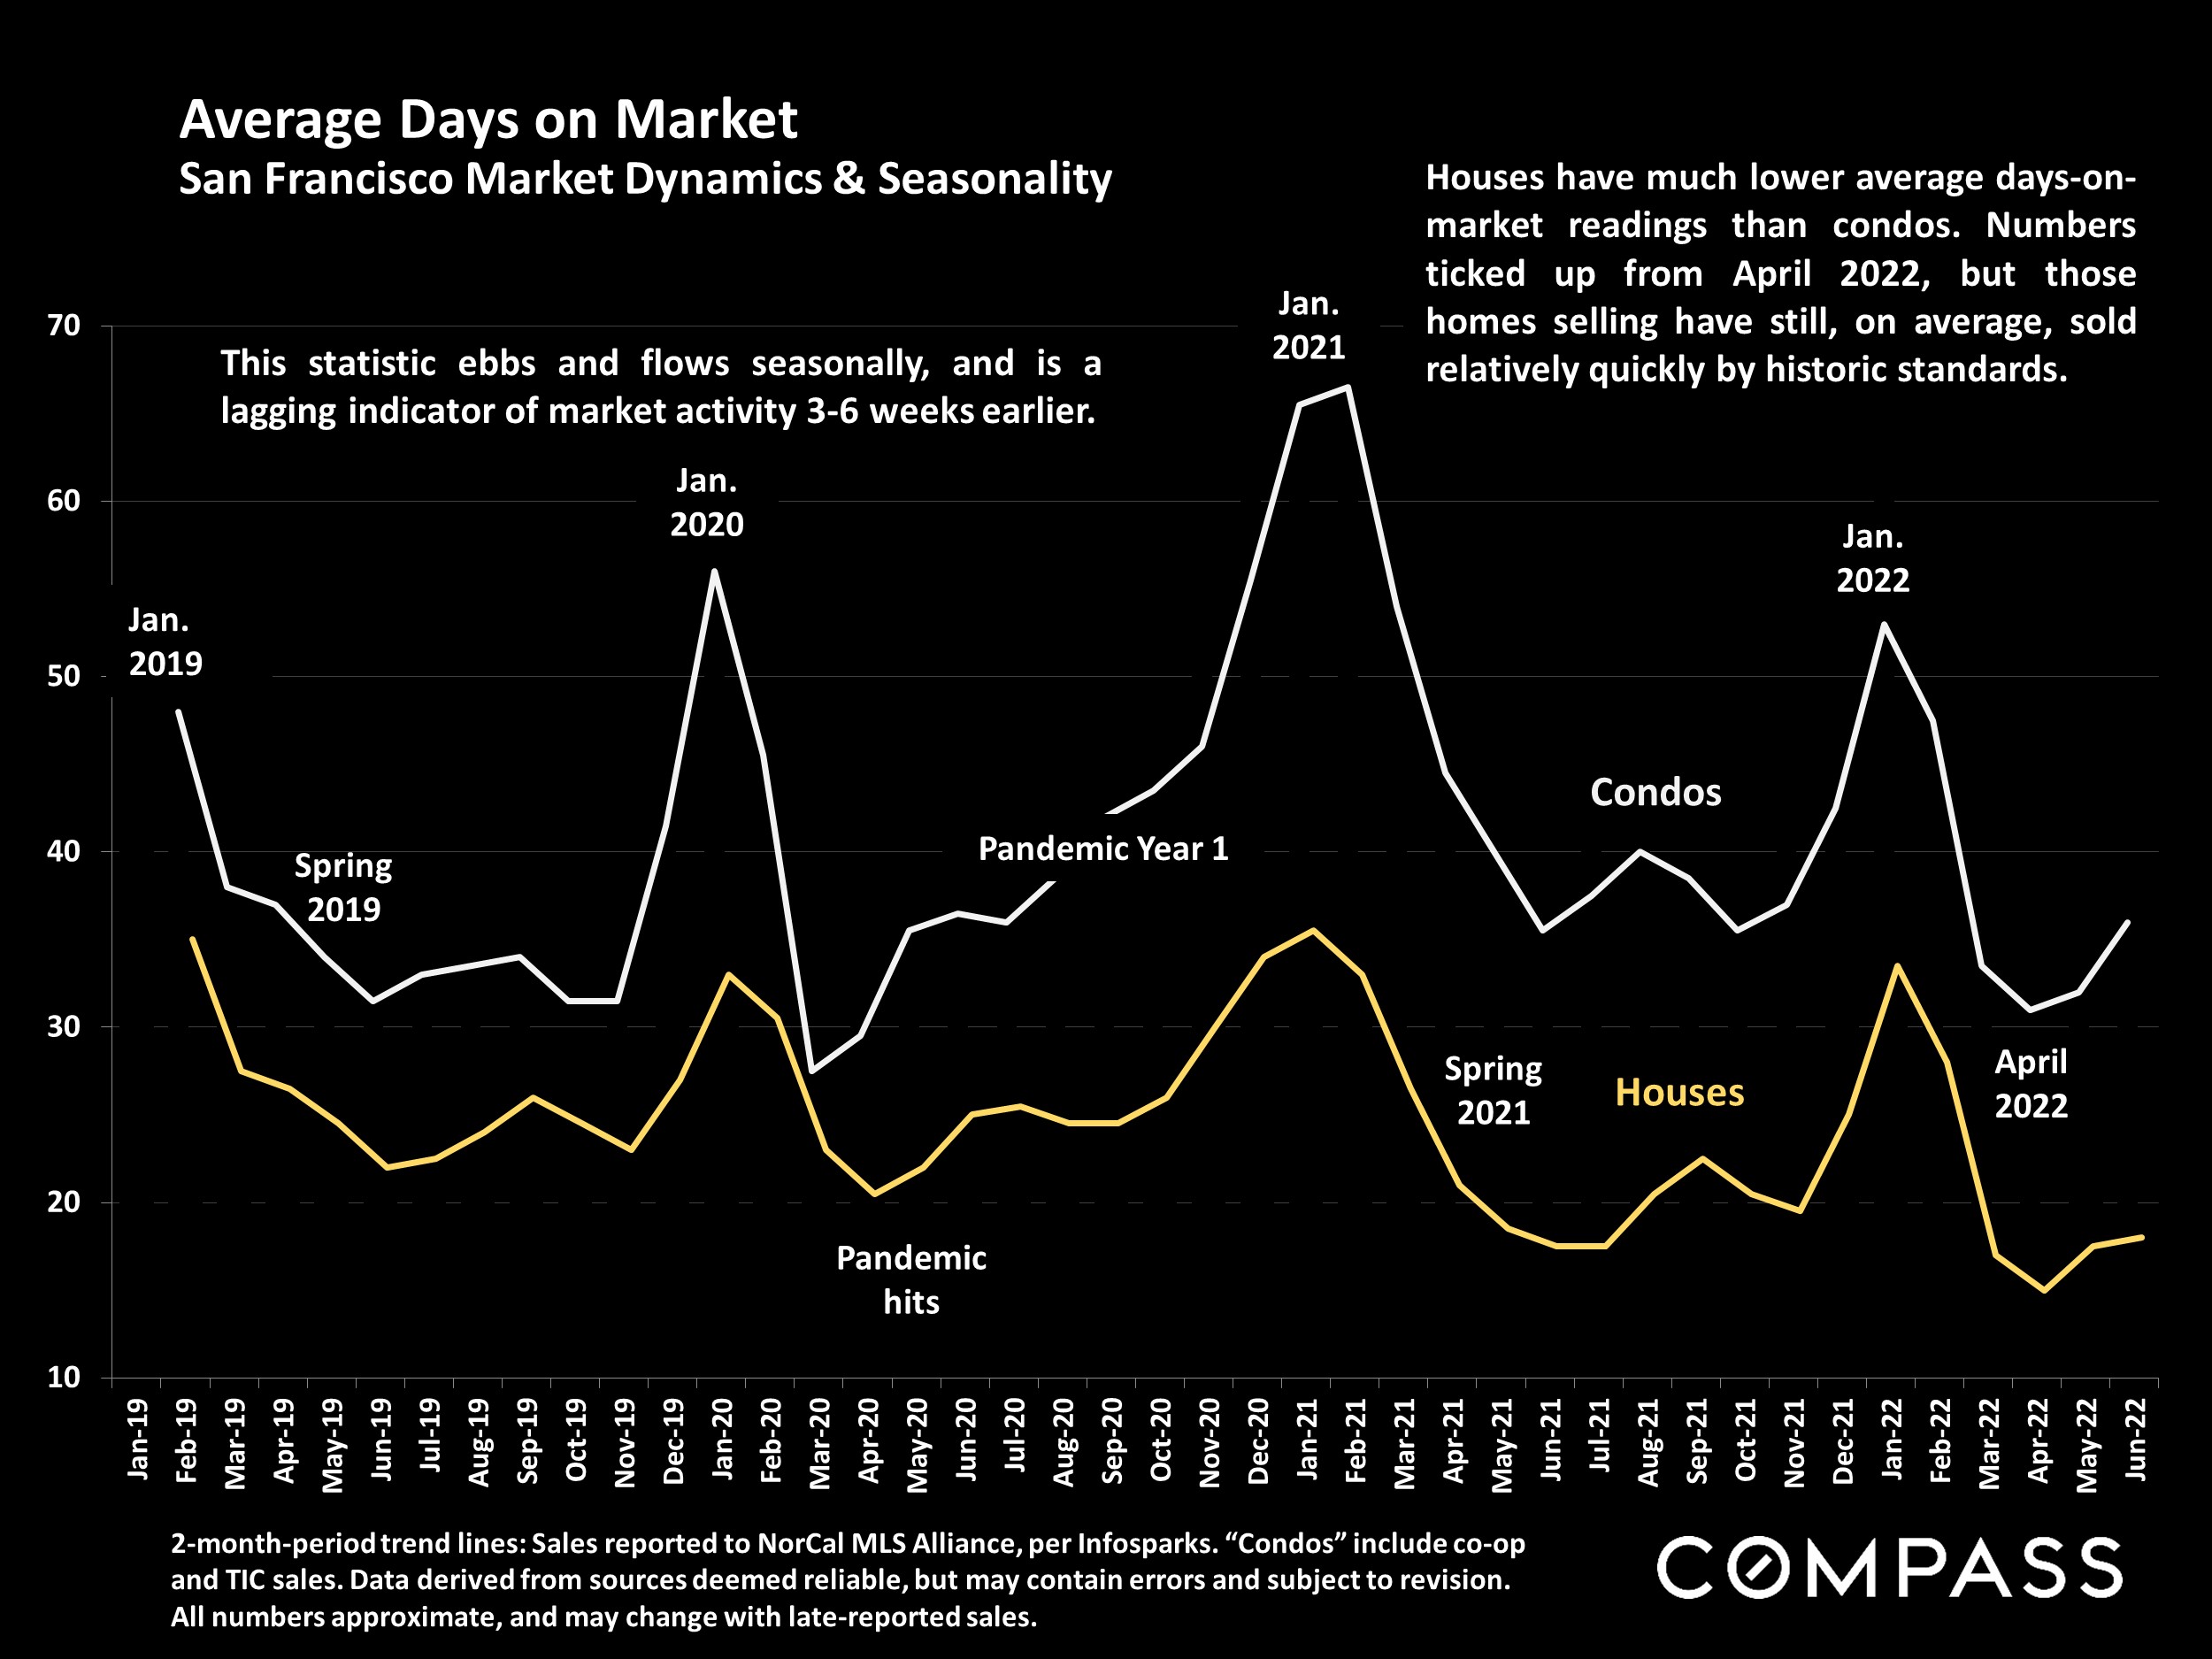
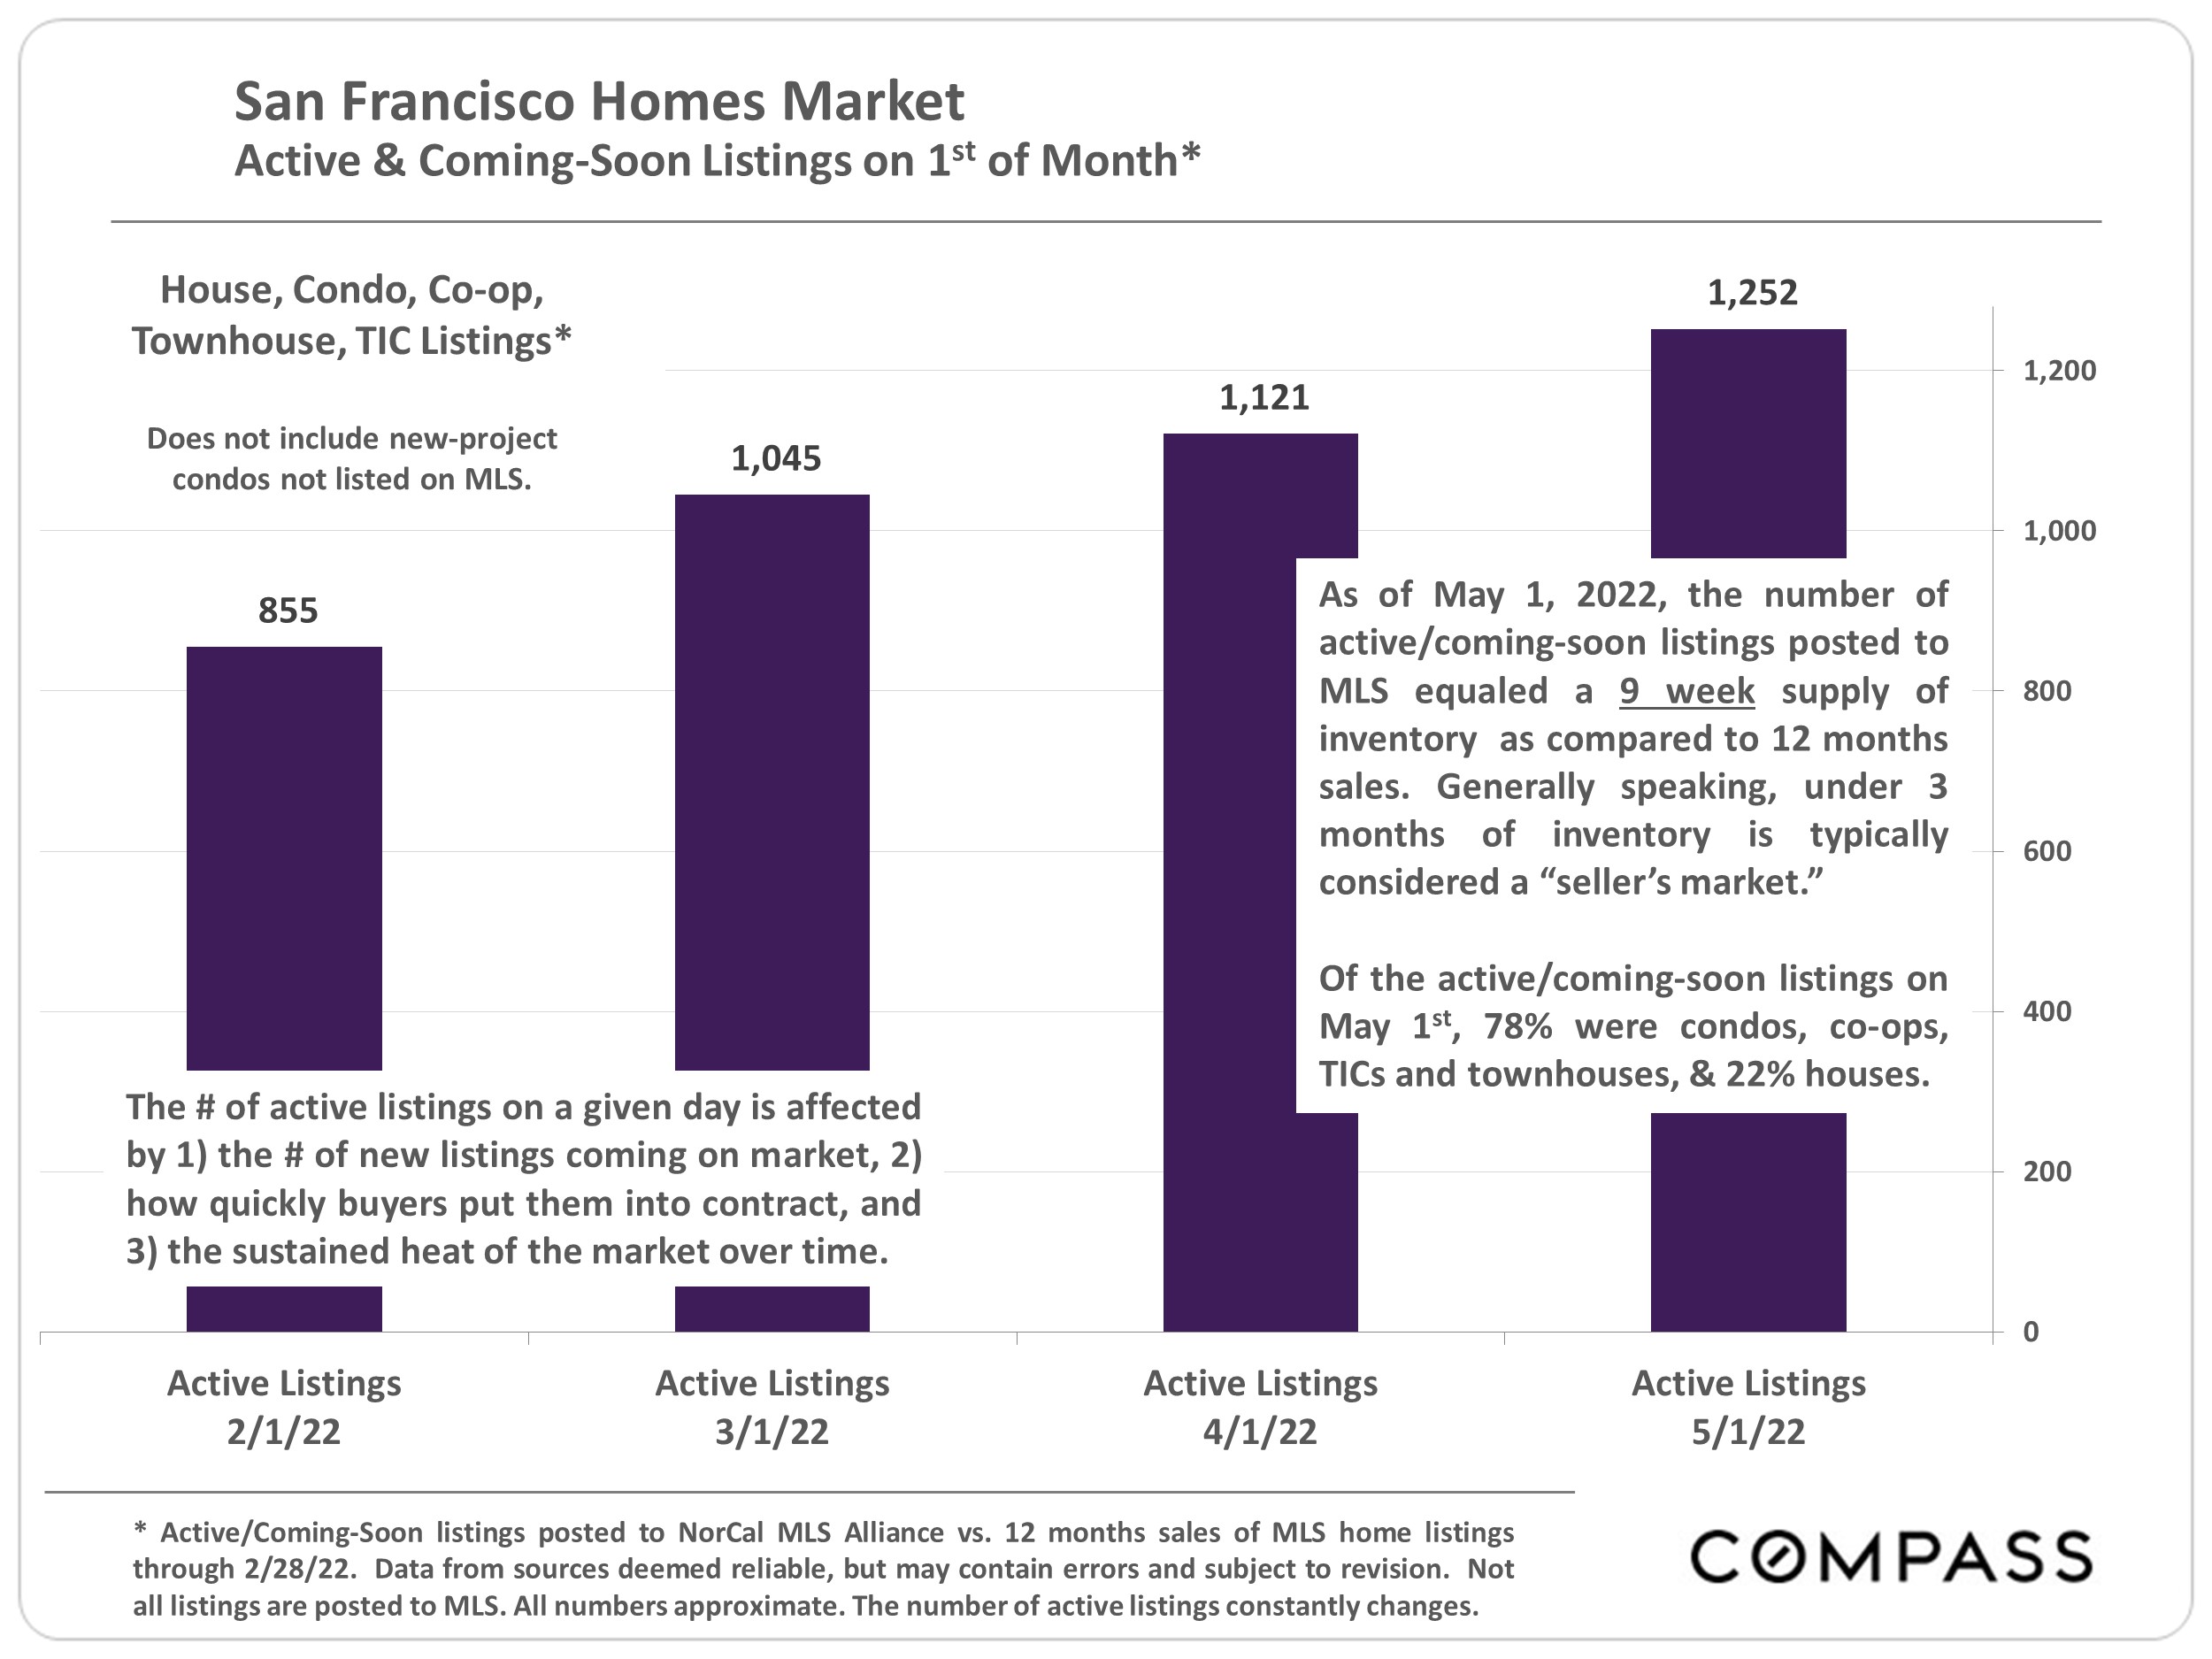
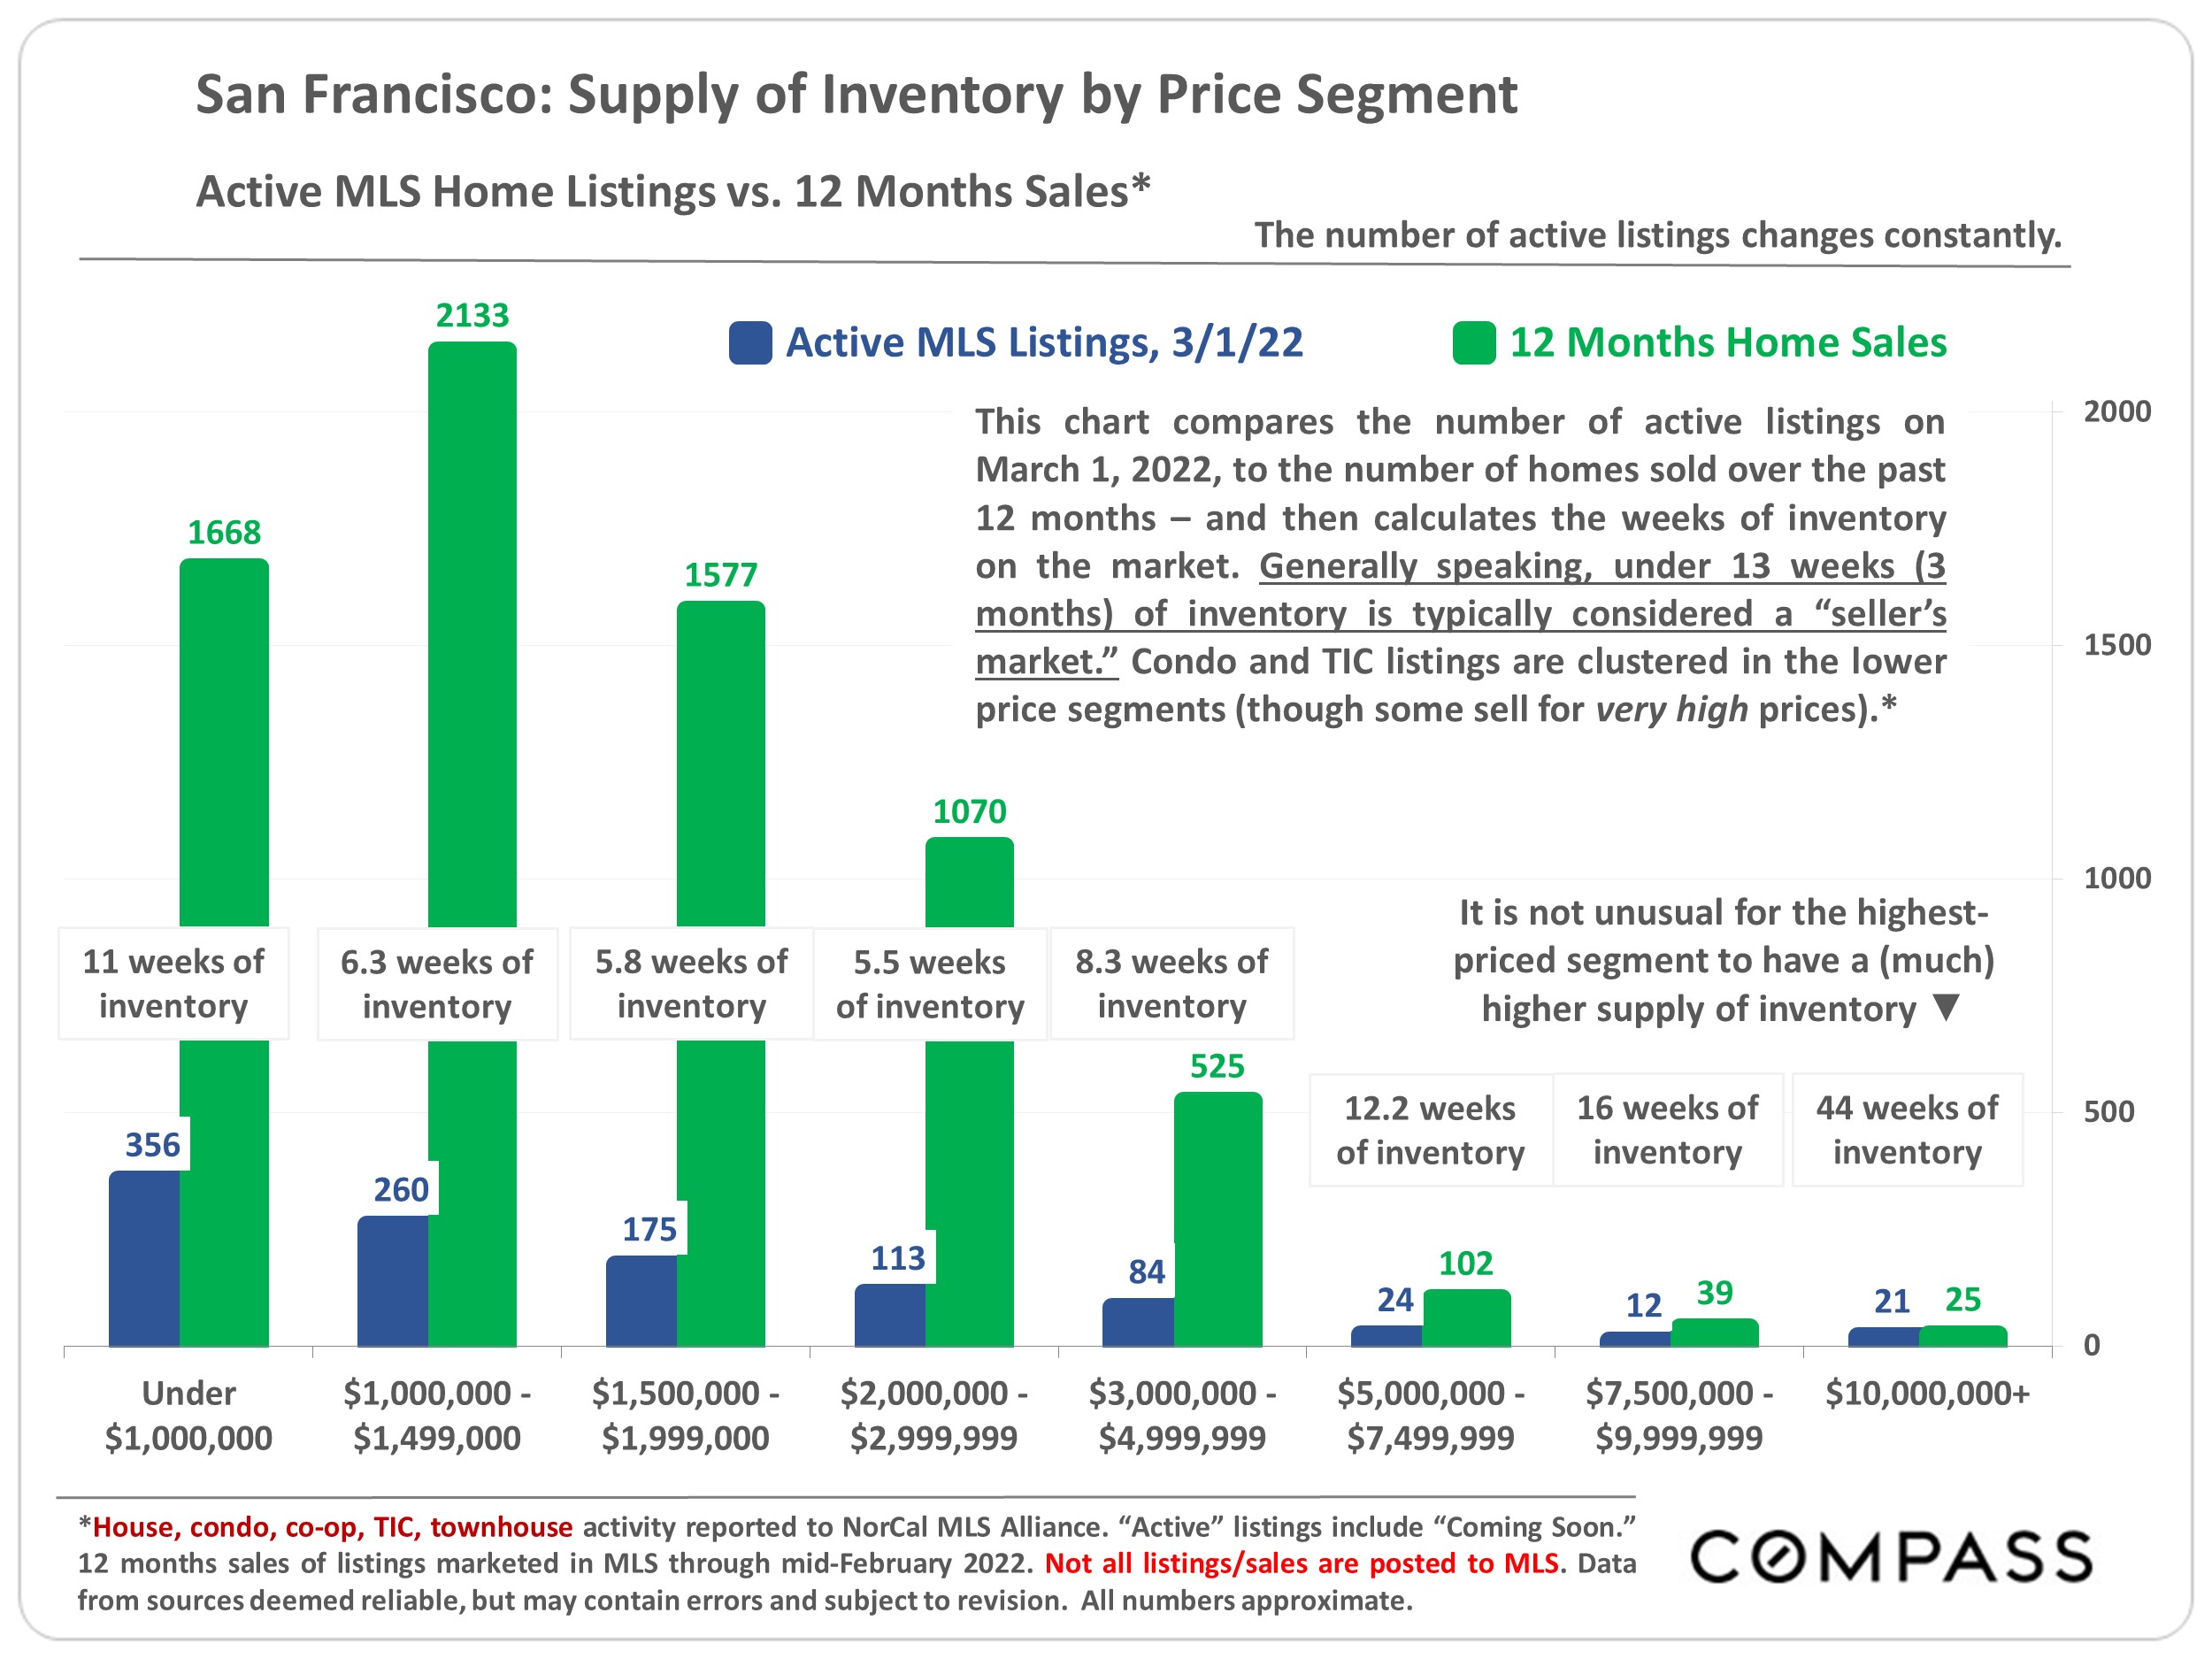
On the supply and demand
side, it appears that after the big drop in demand in early-mid summer, conditions have mostly stabilized.
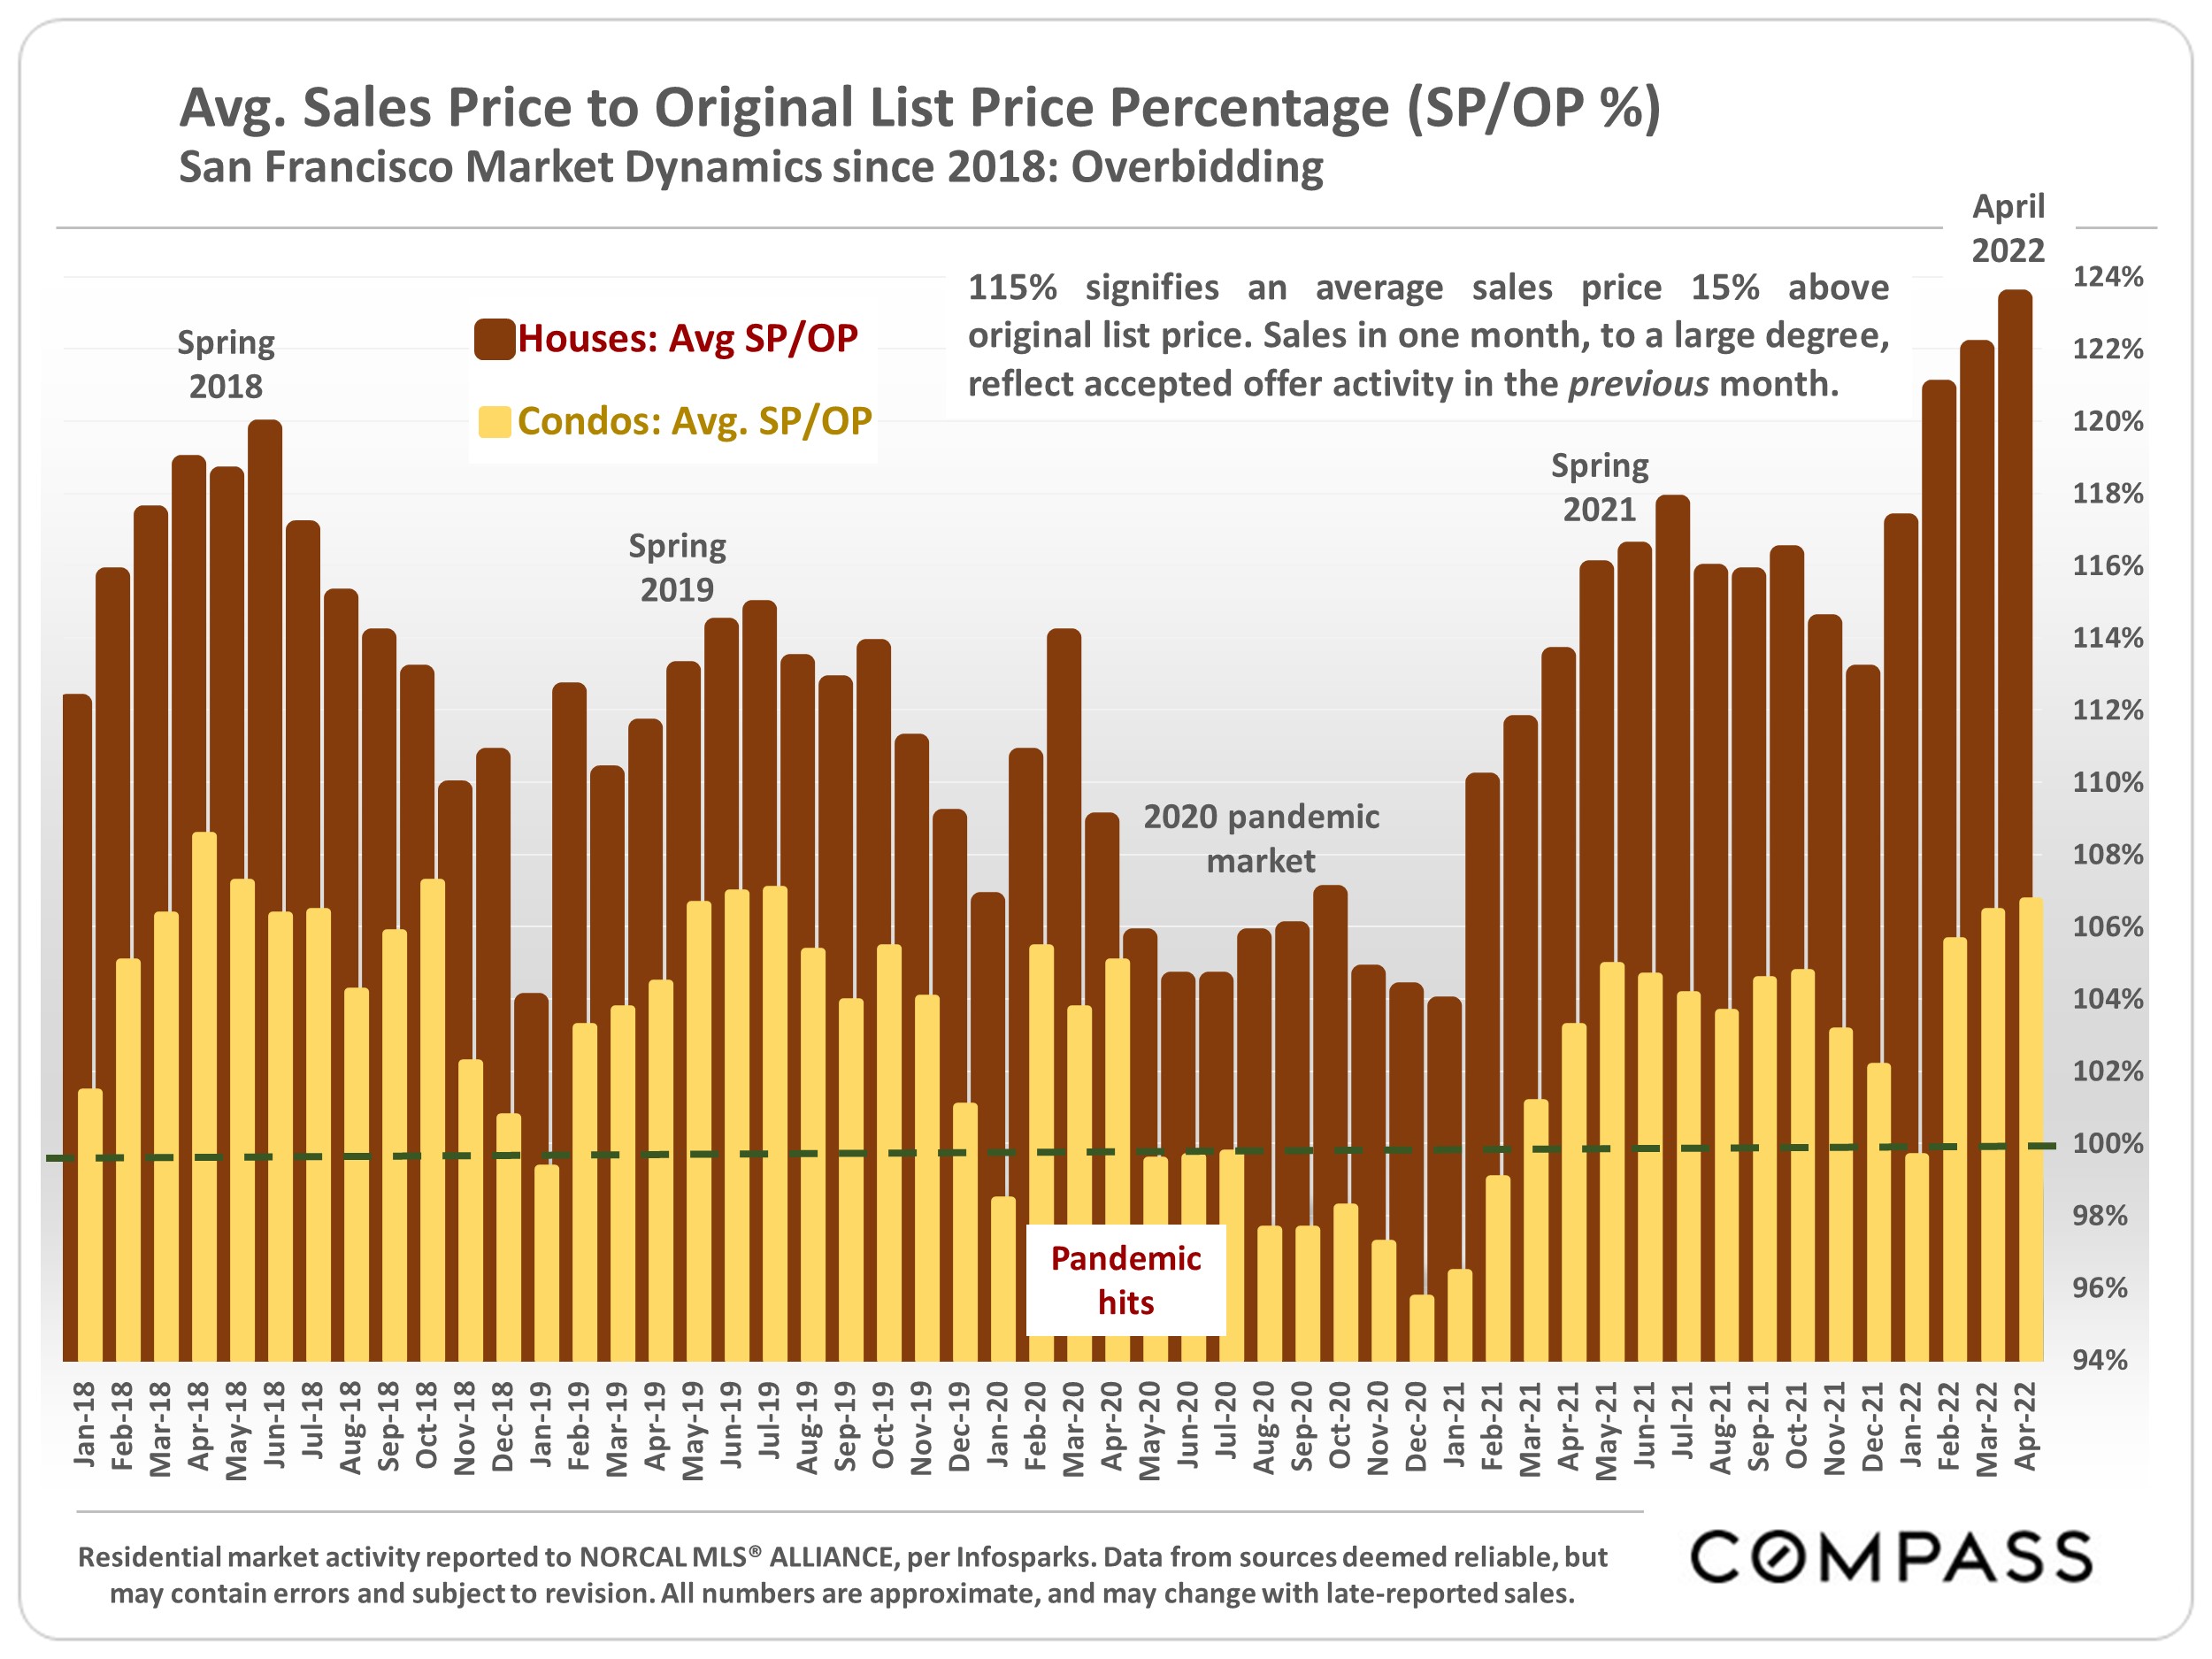
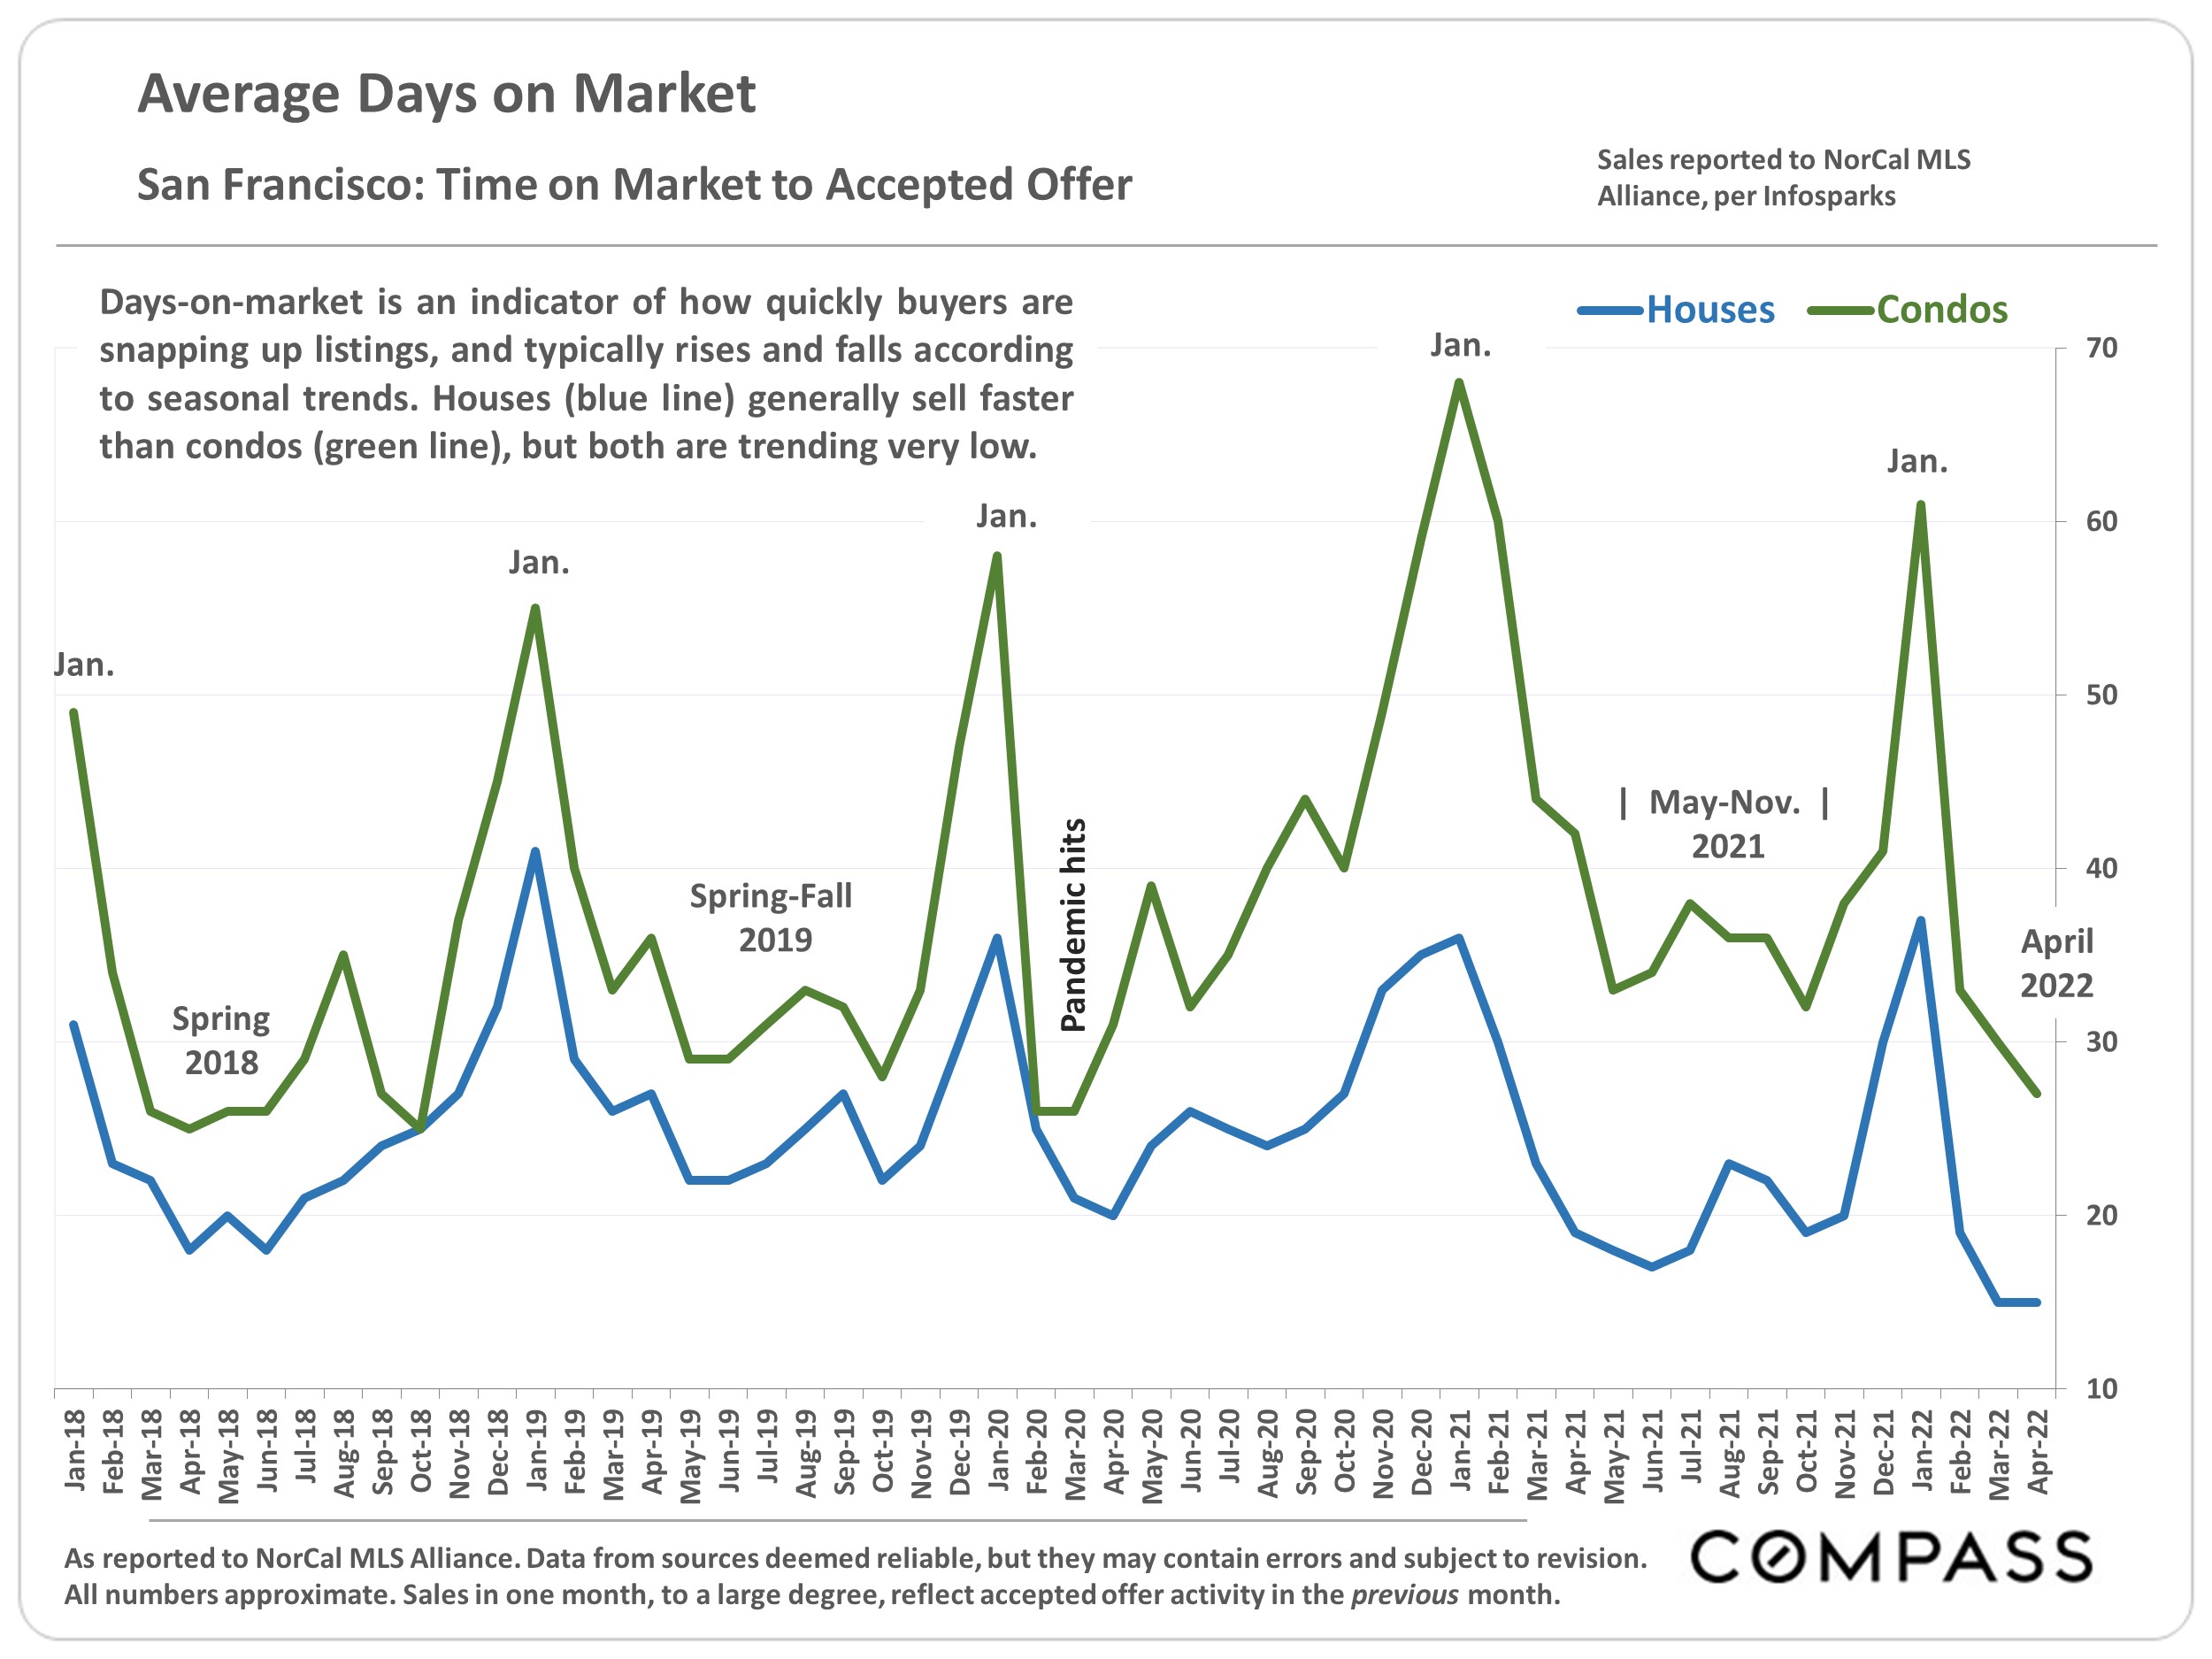
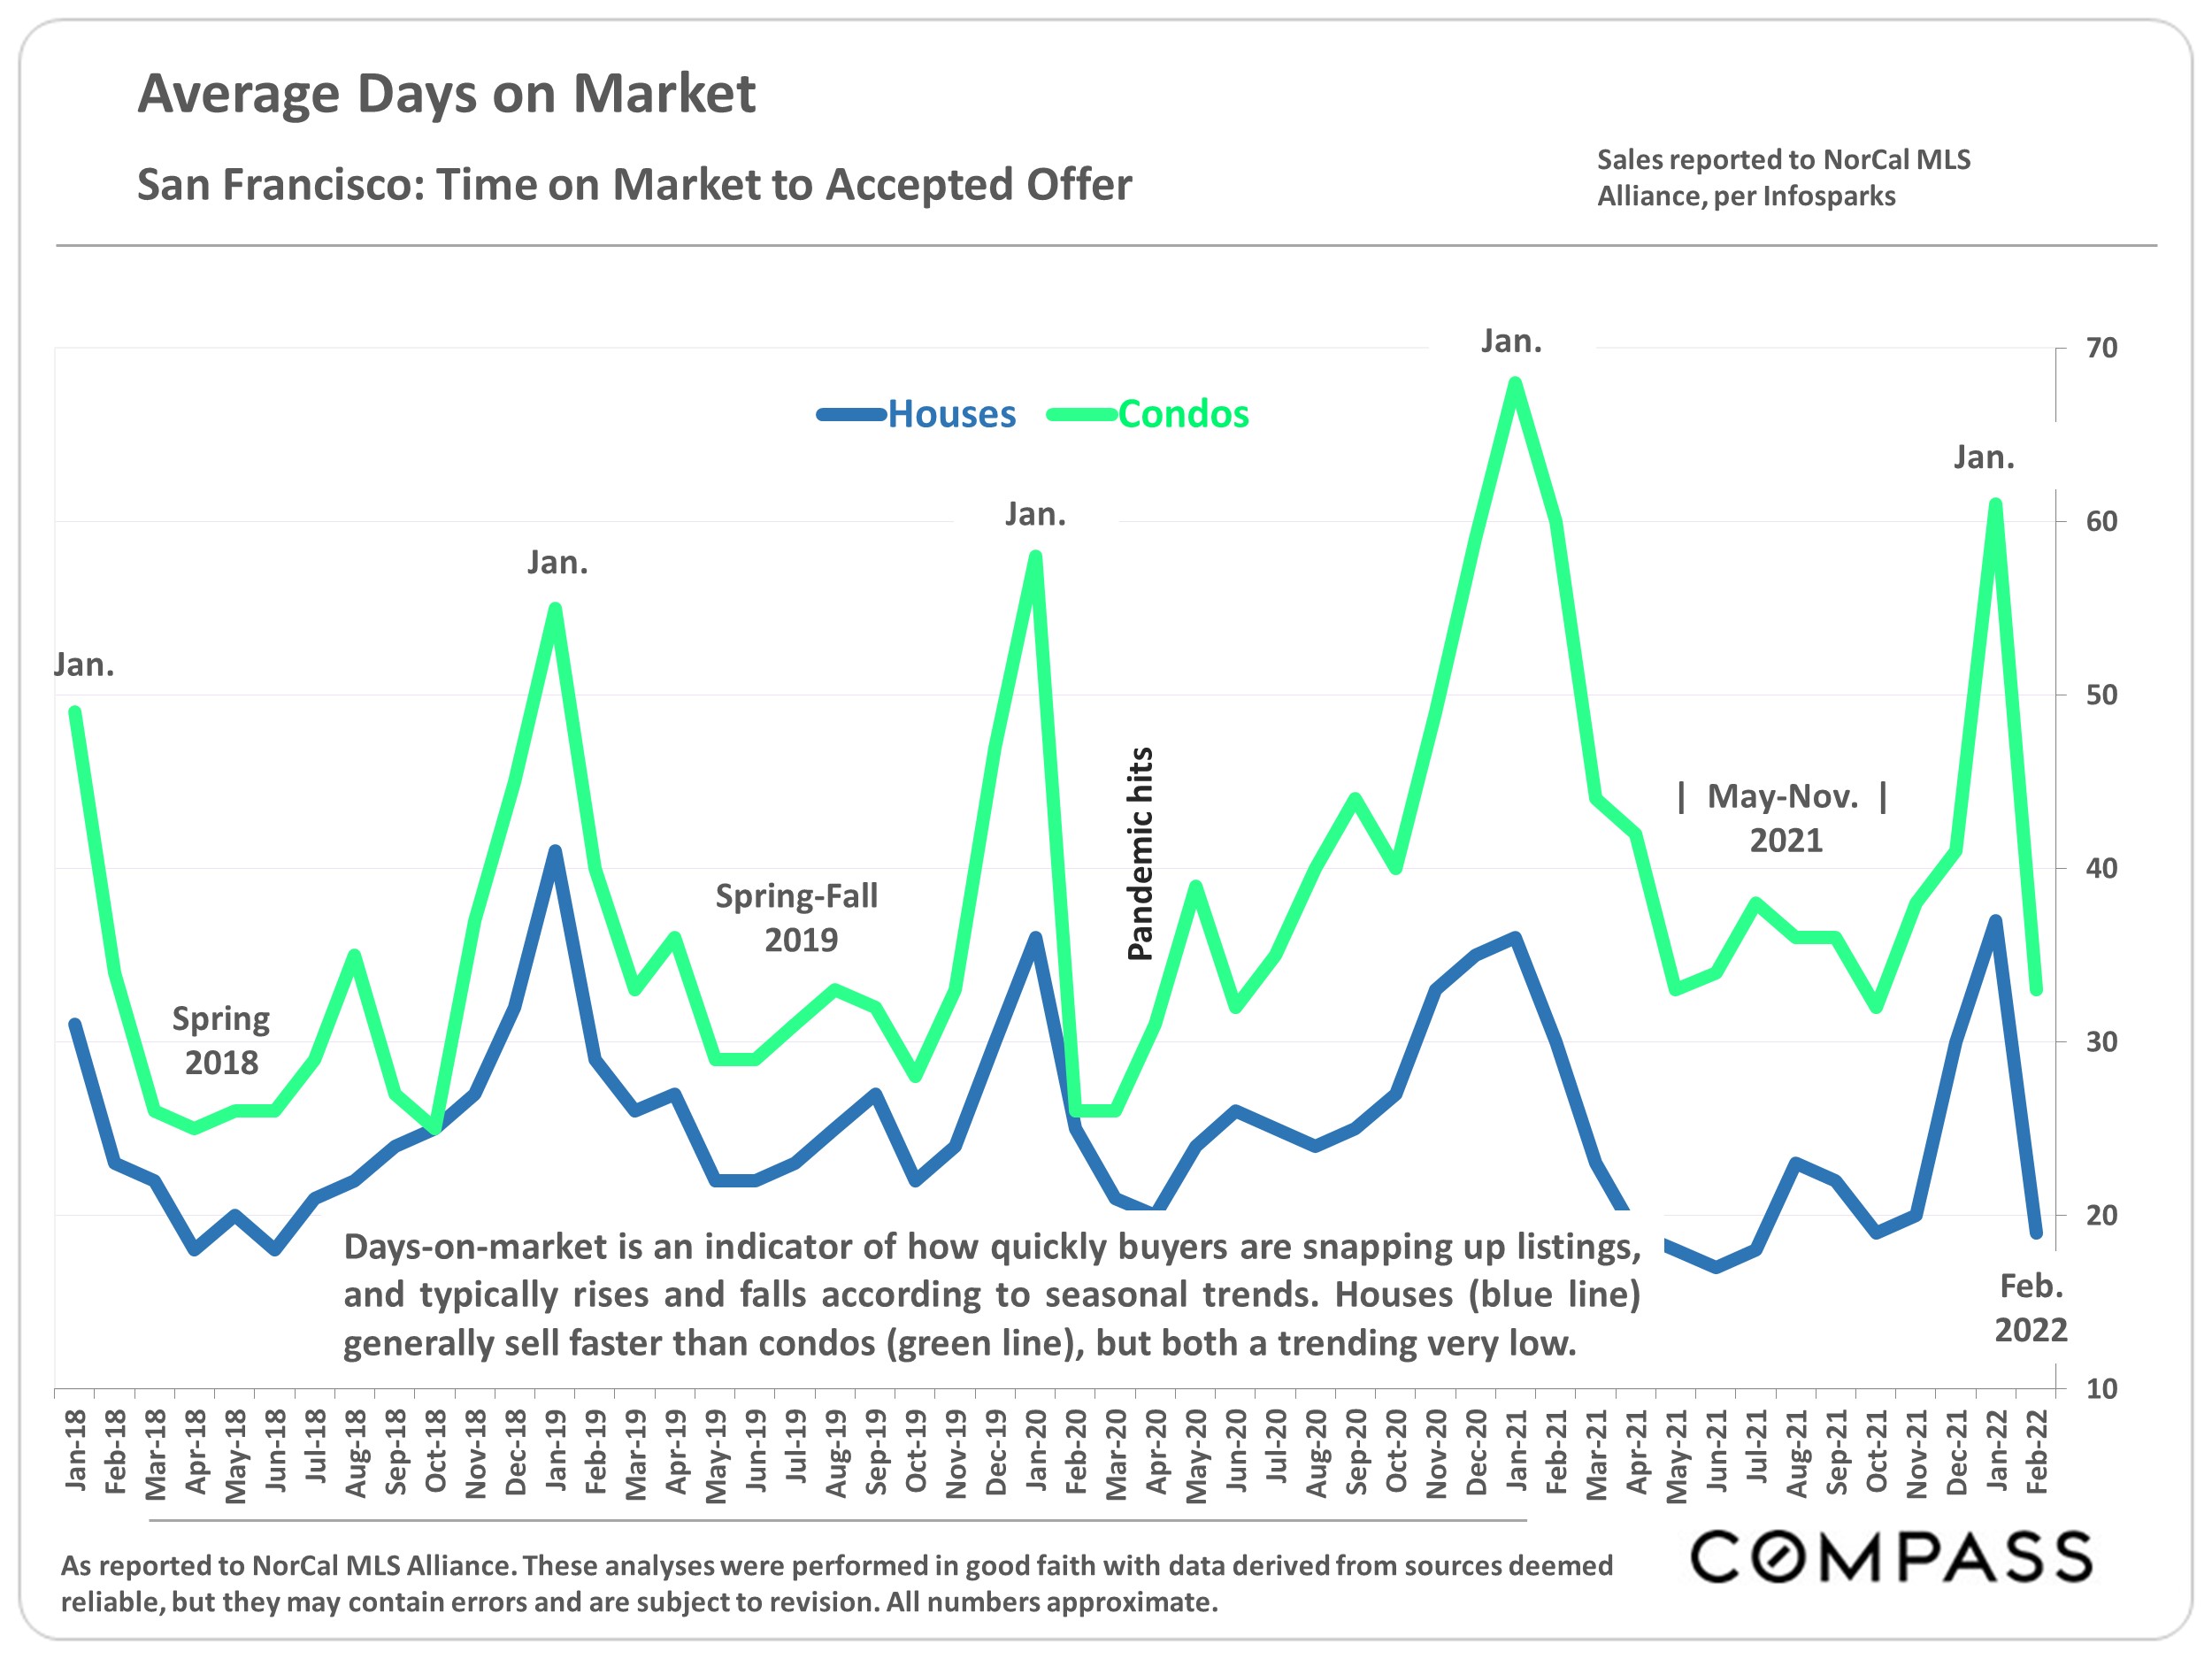
Generally speaking, sales numbers are no longer appreciably dropping, though overbidding statistics continue to decline
and days on market to climb.
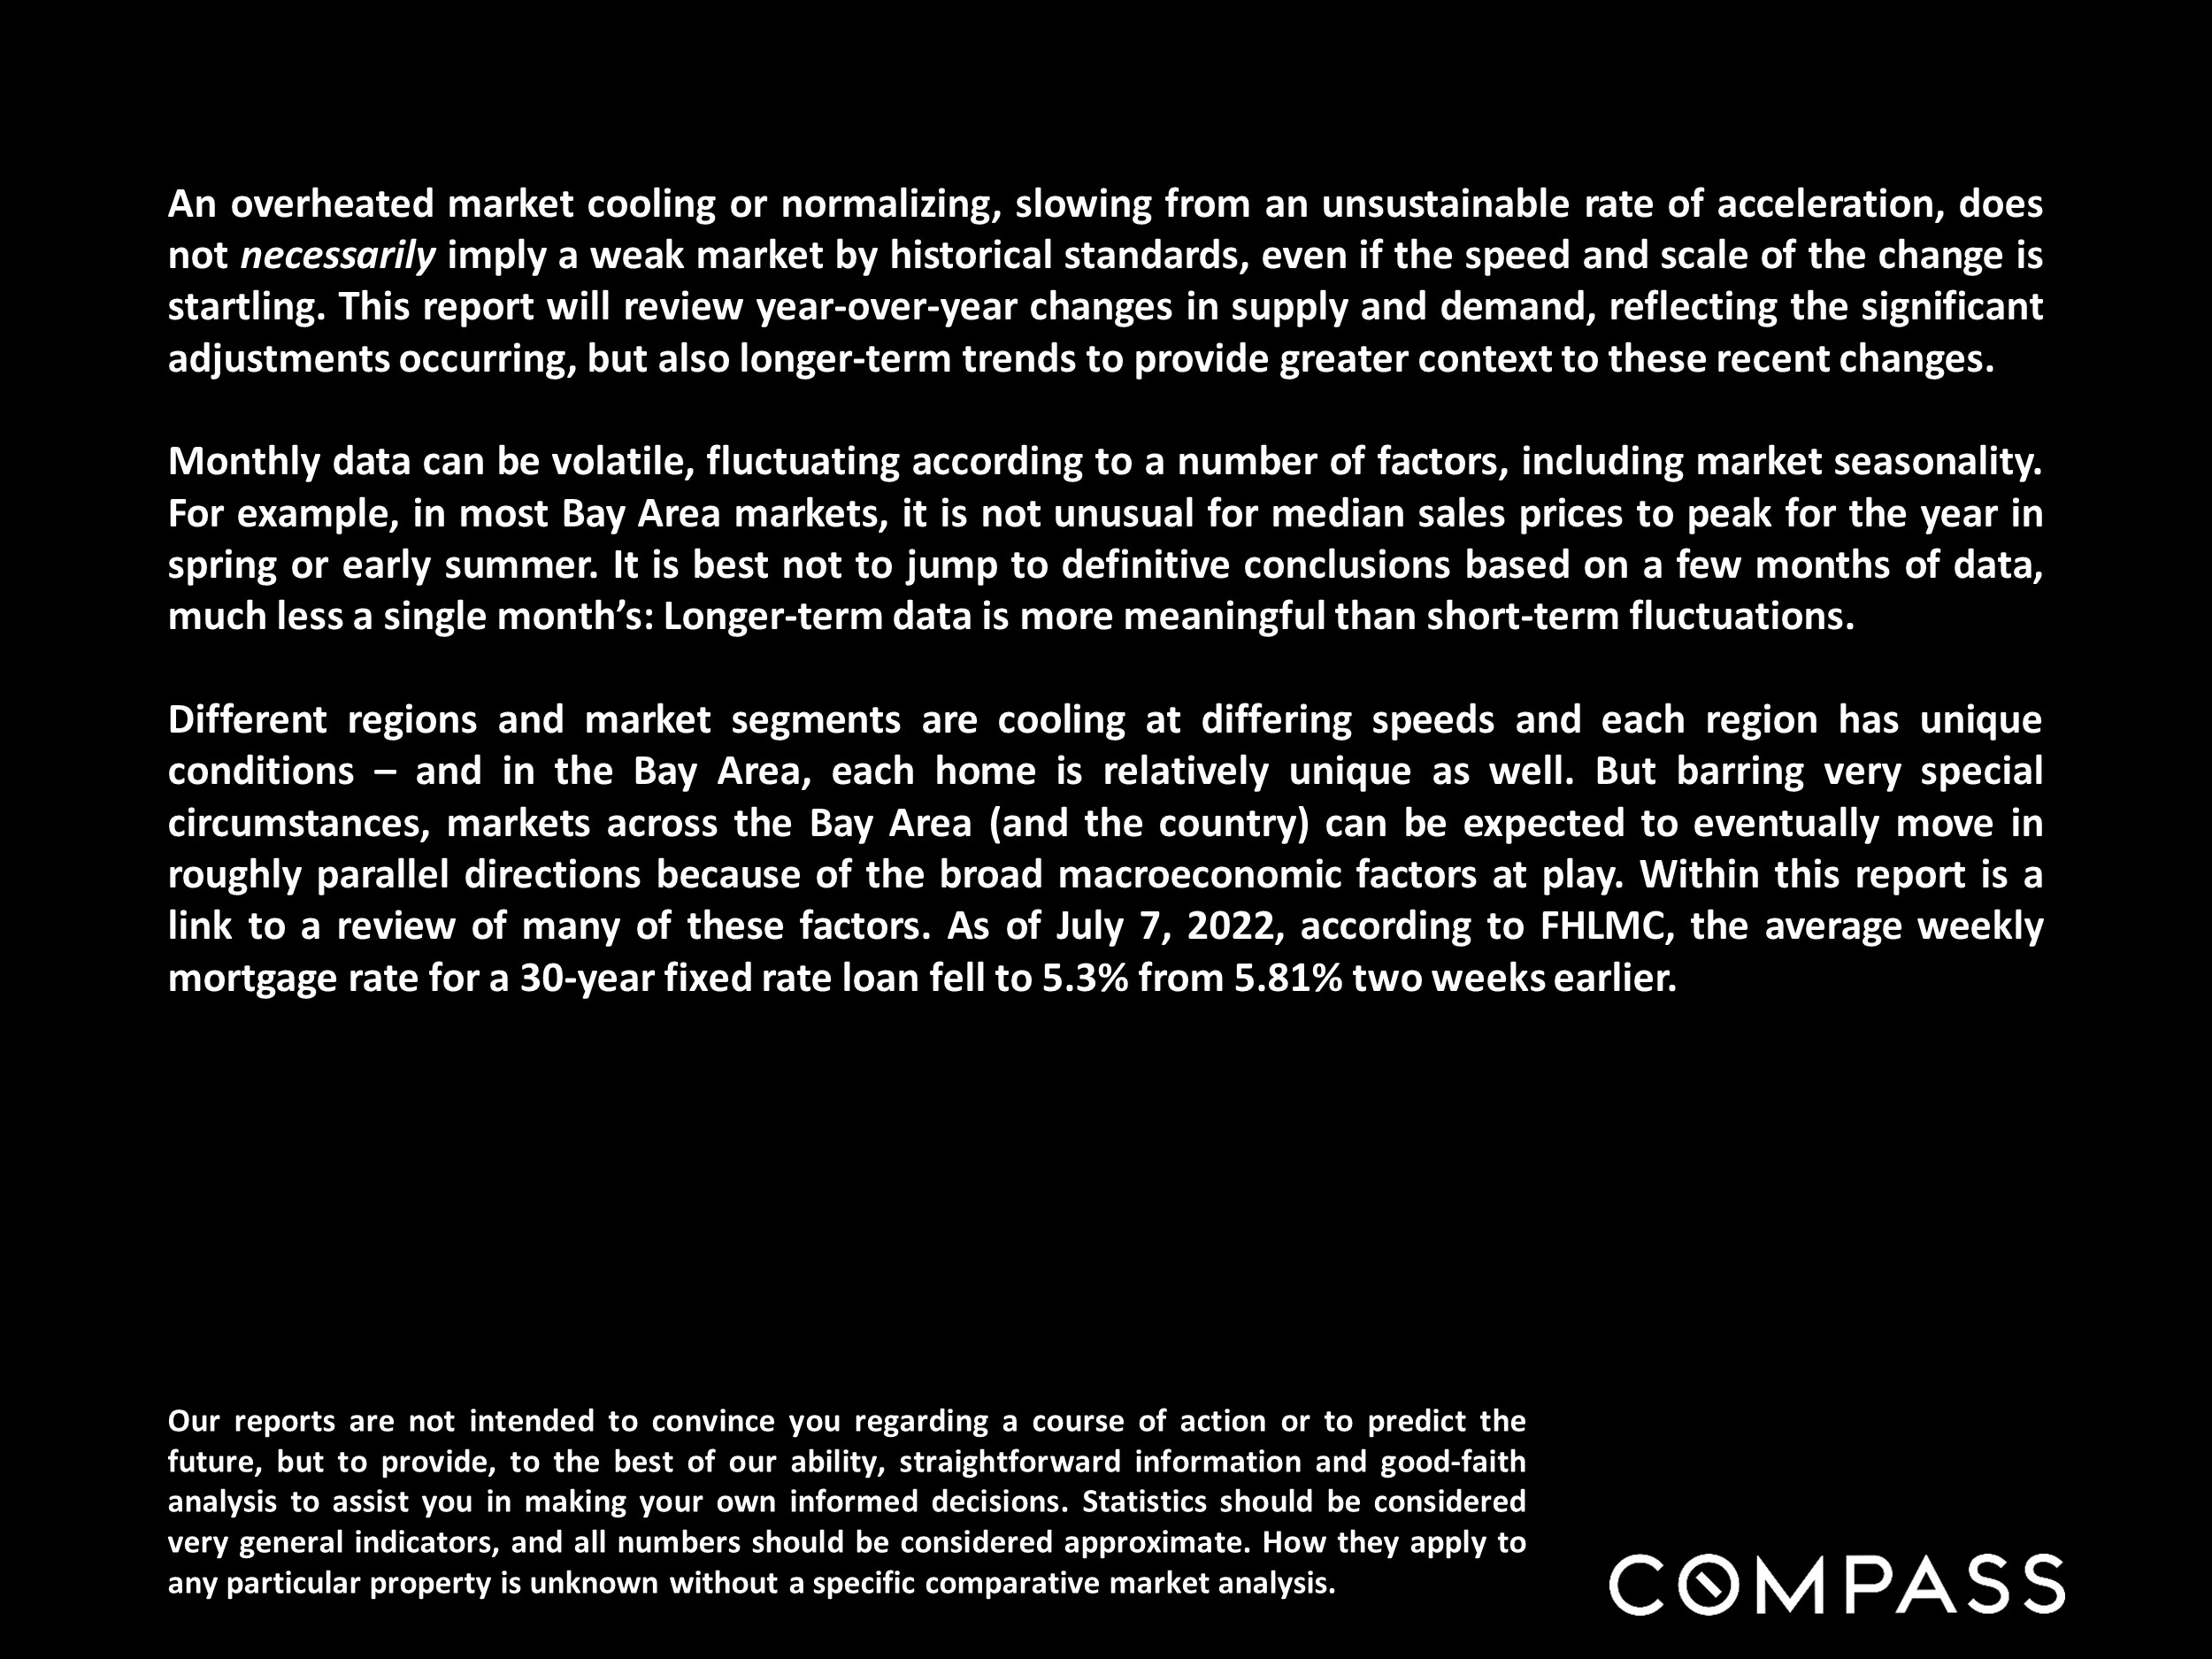
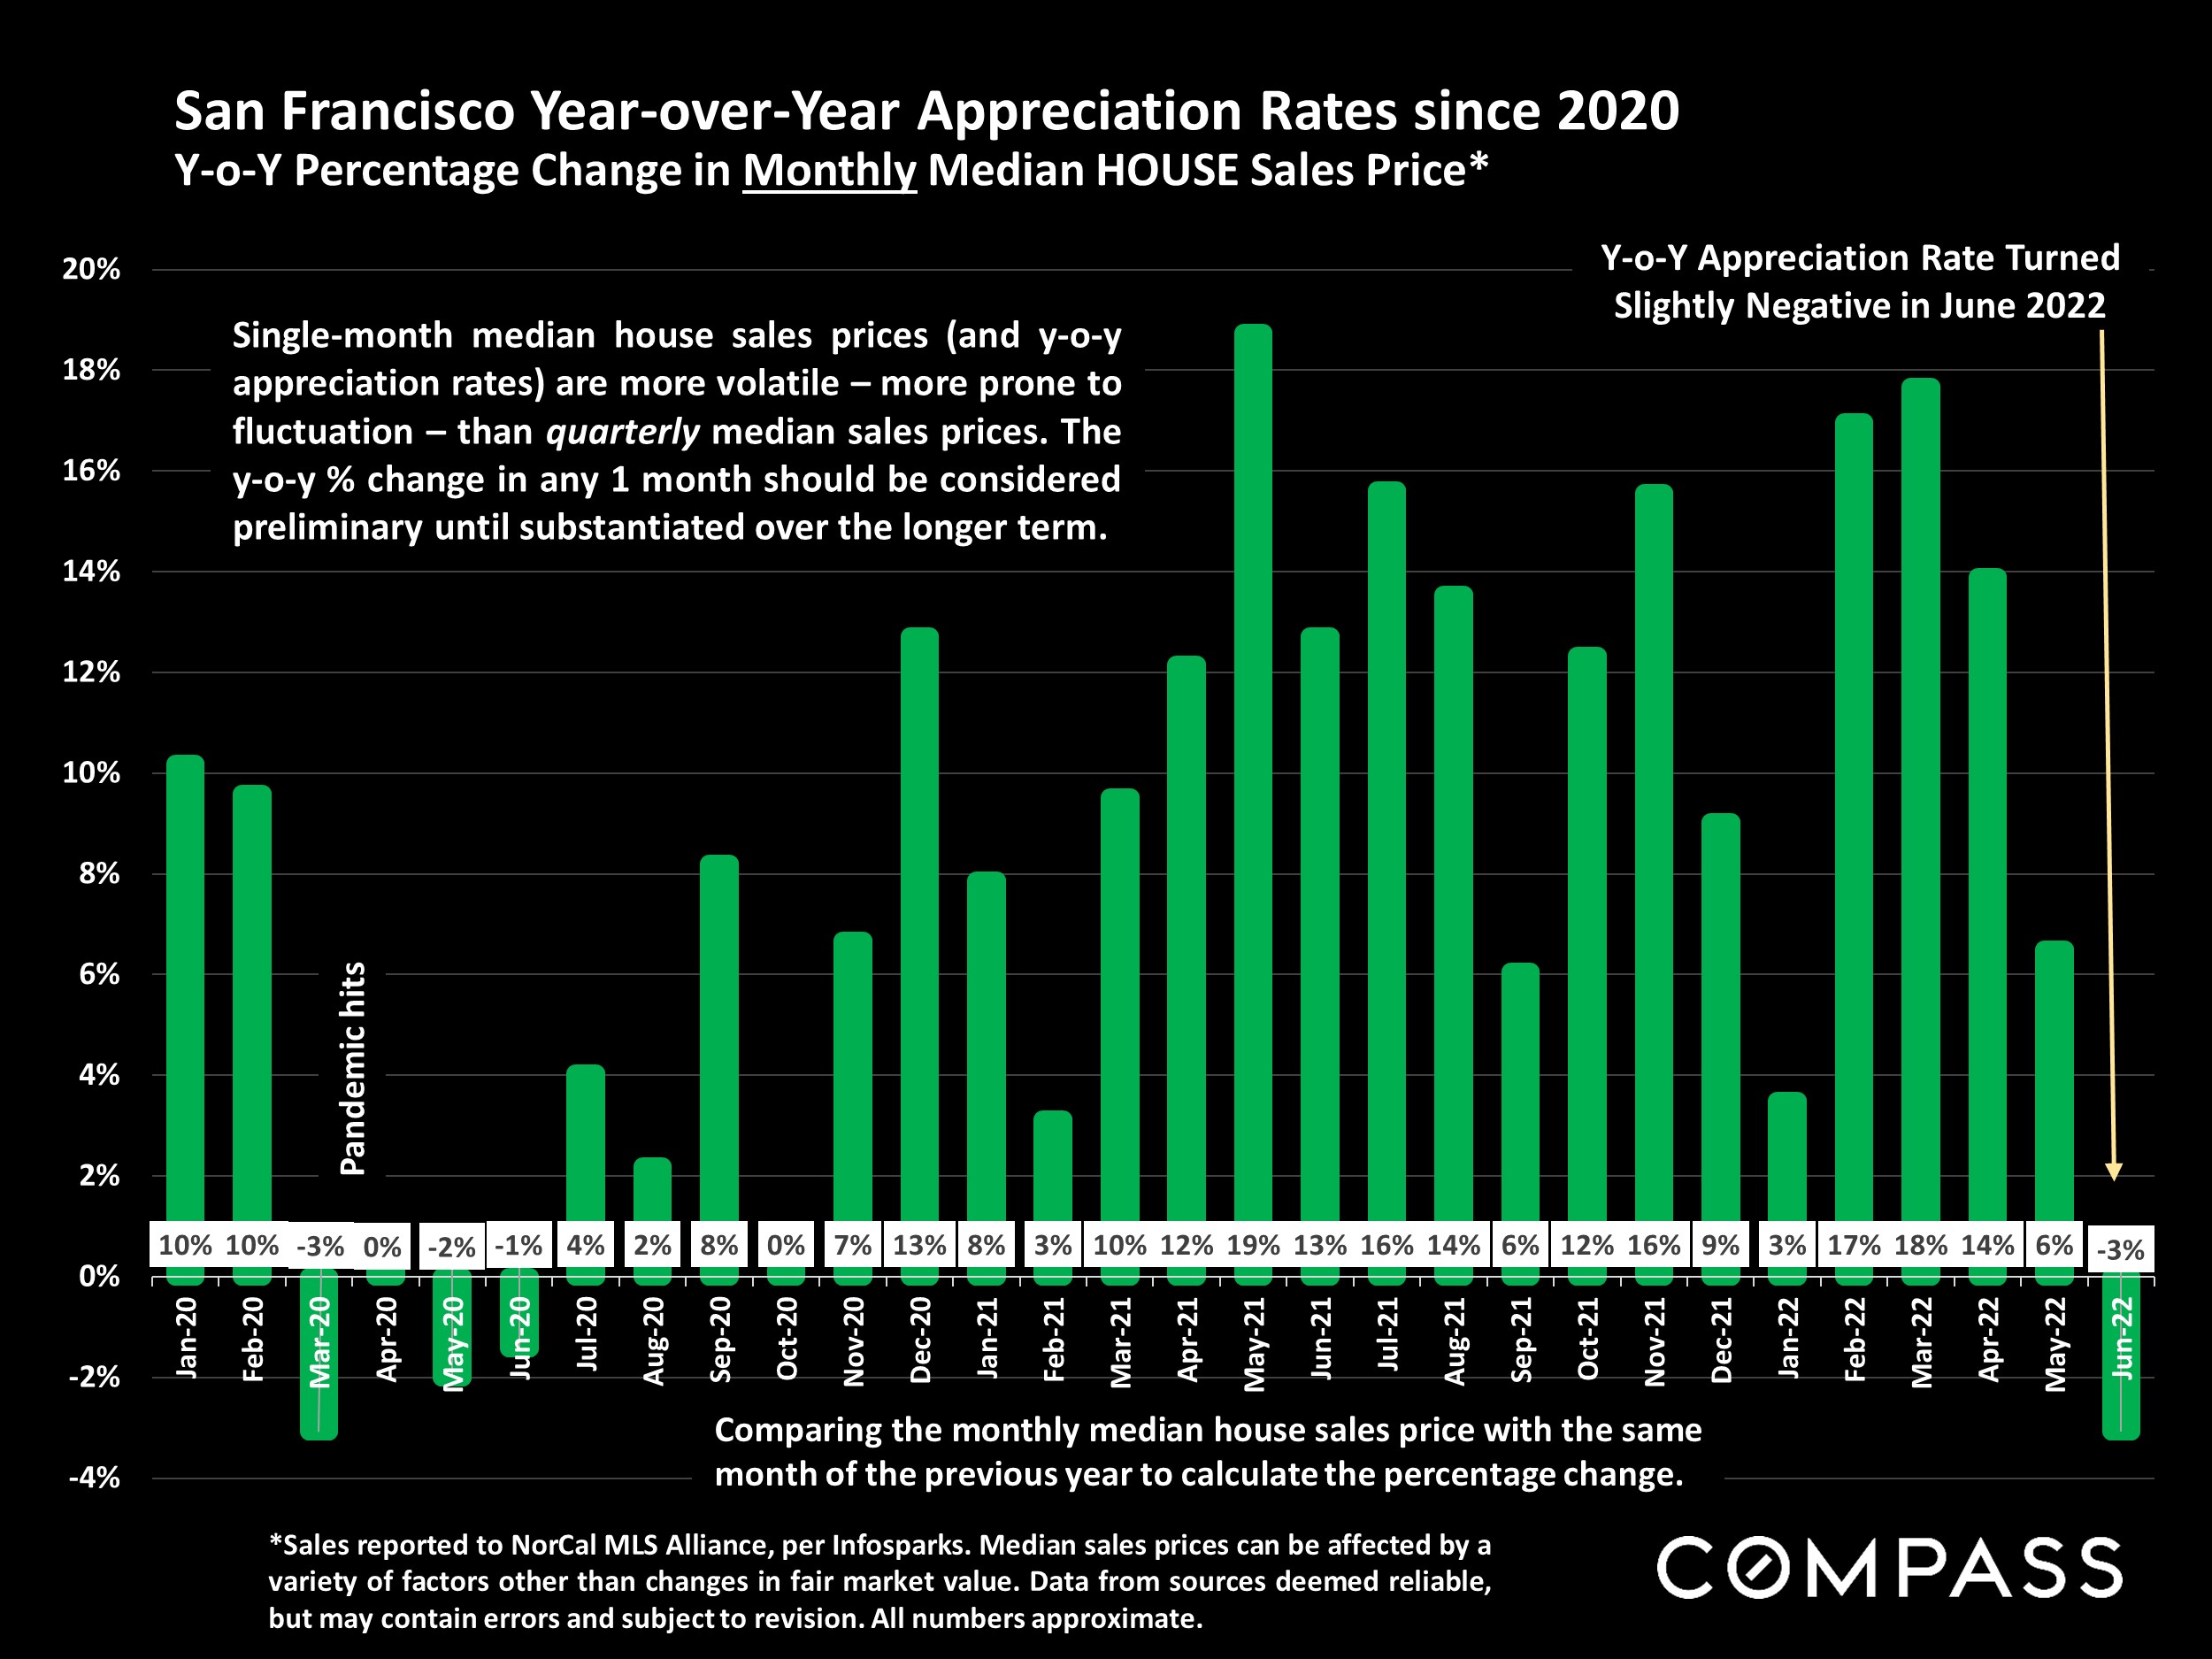
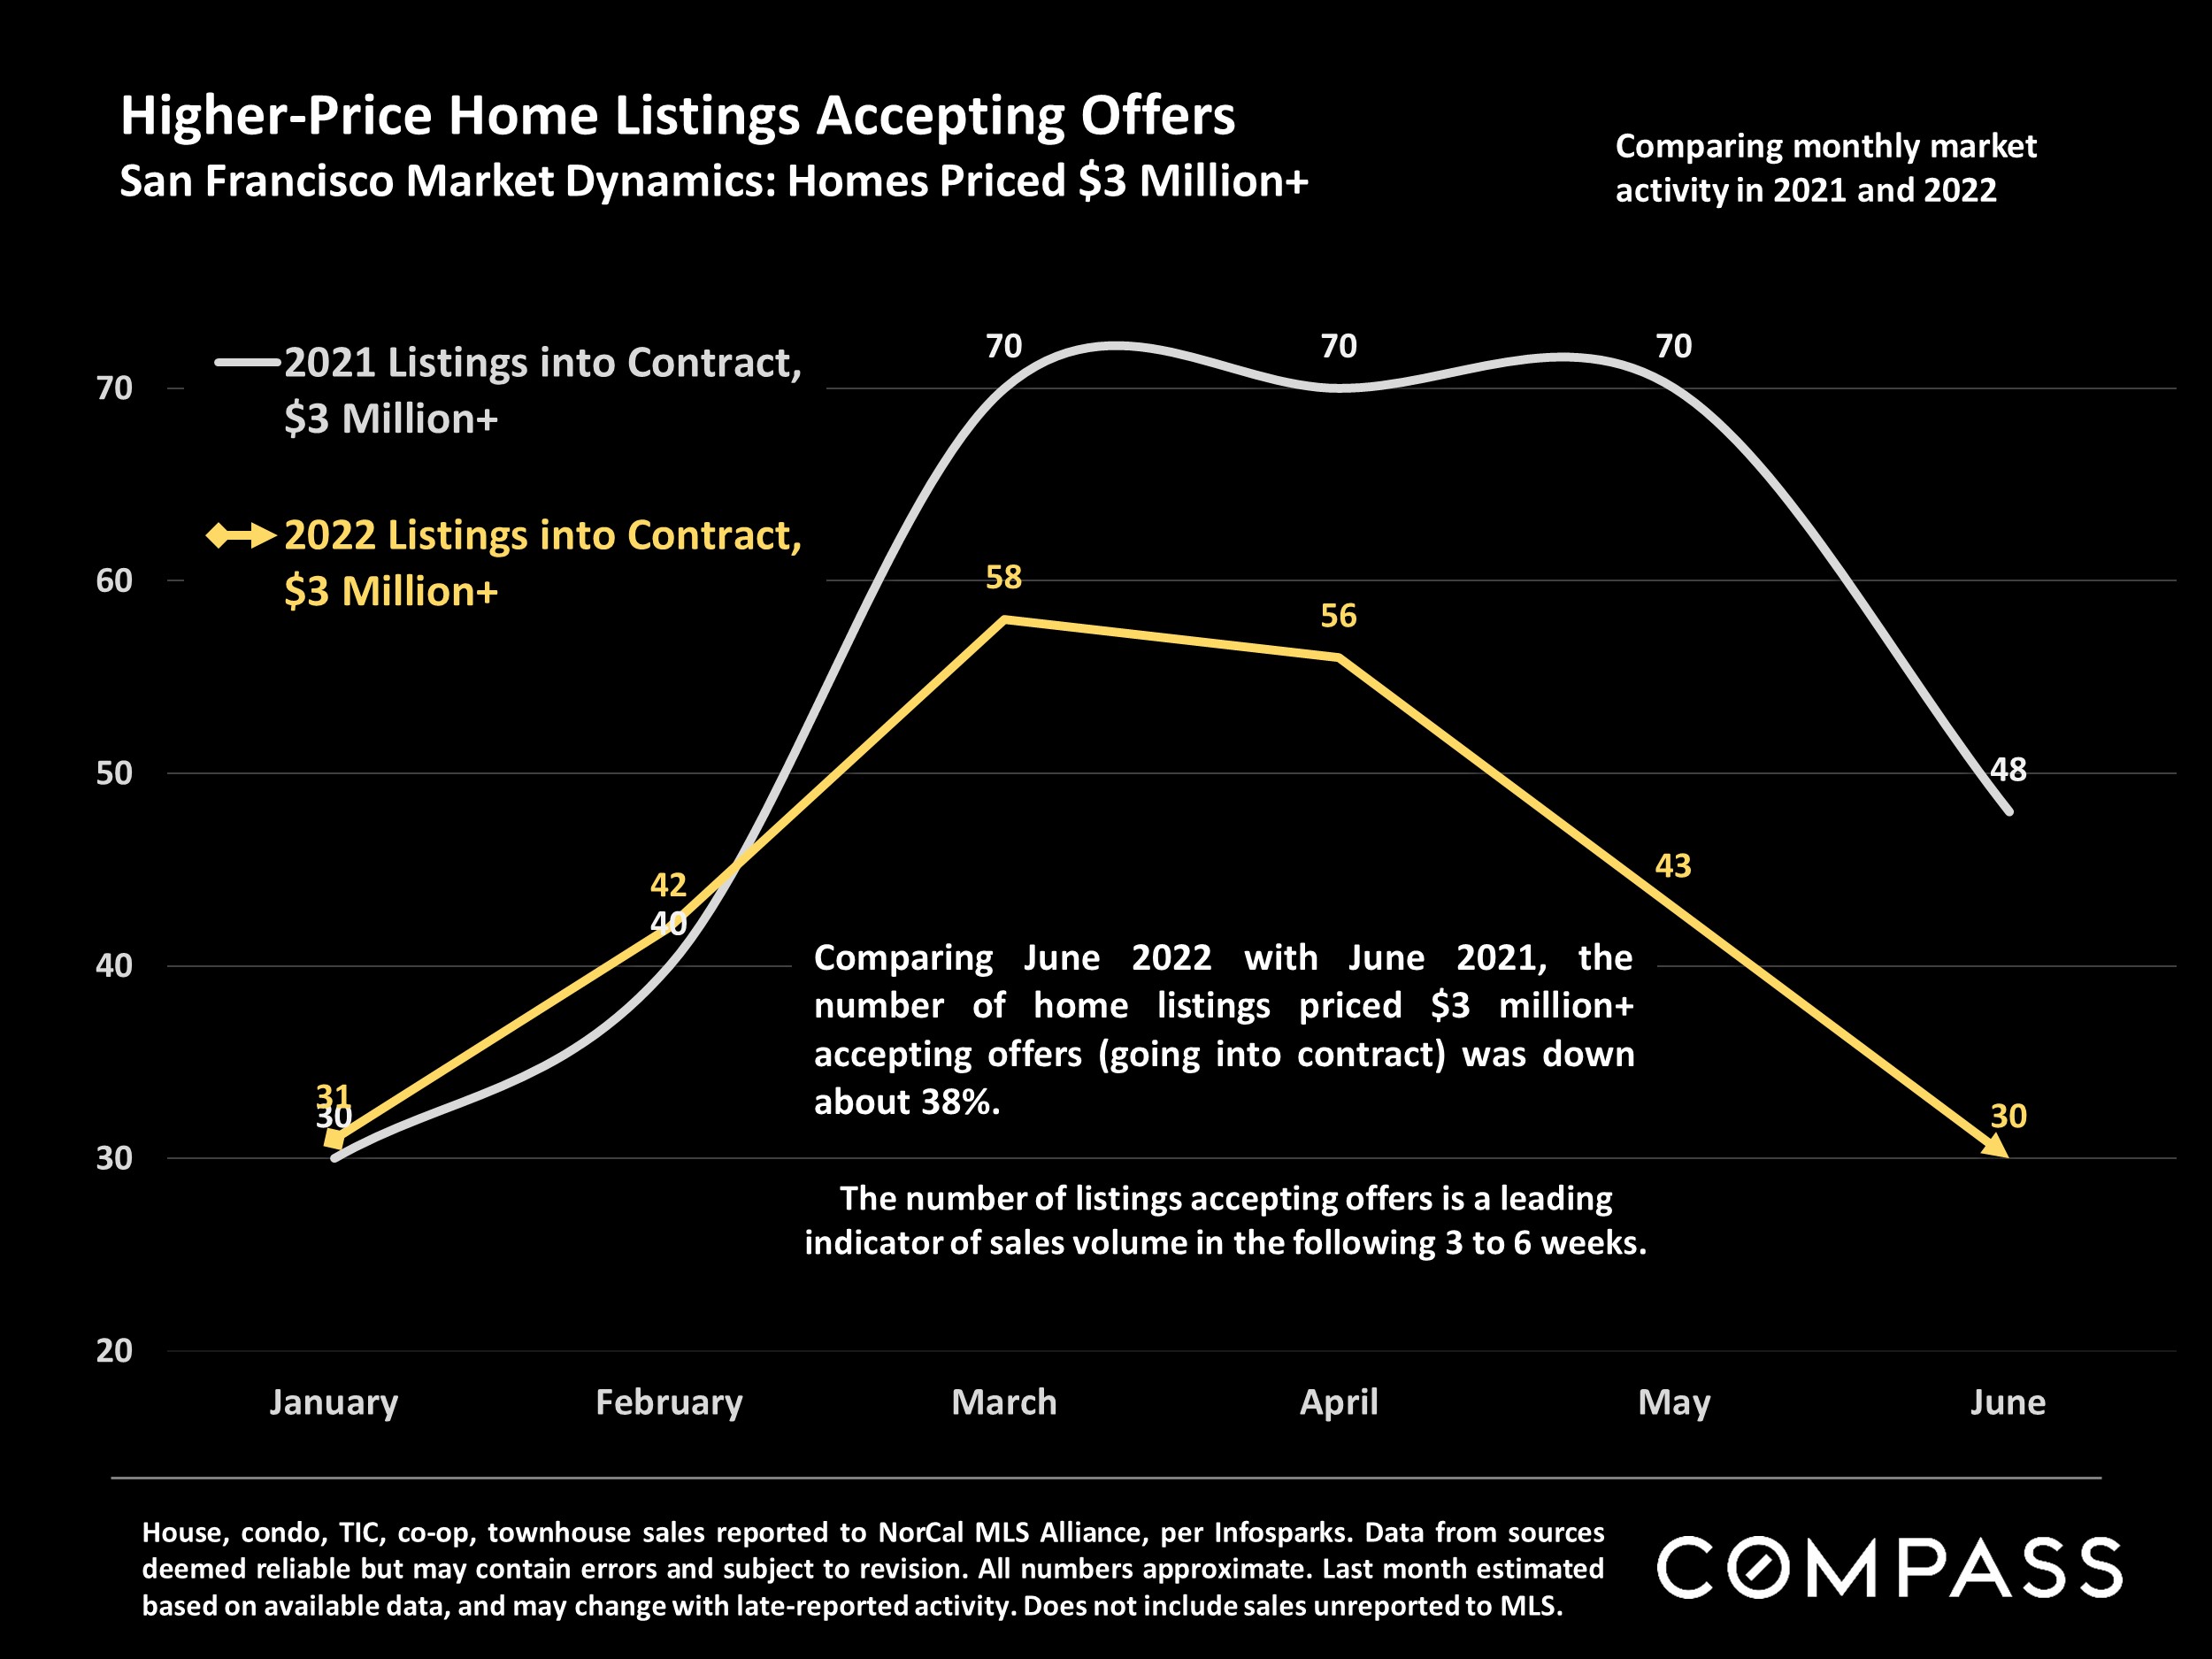
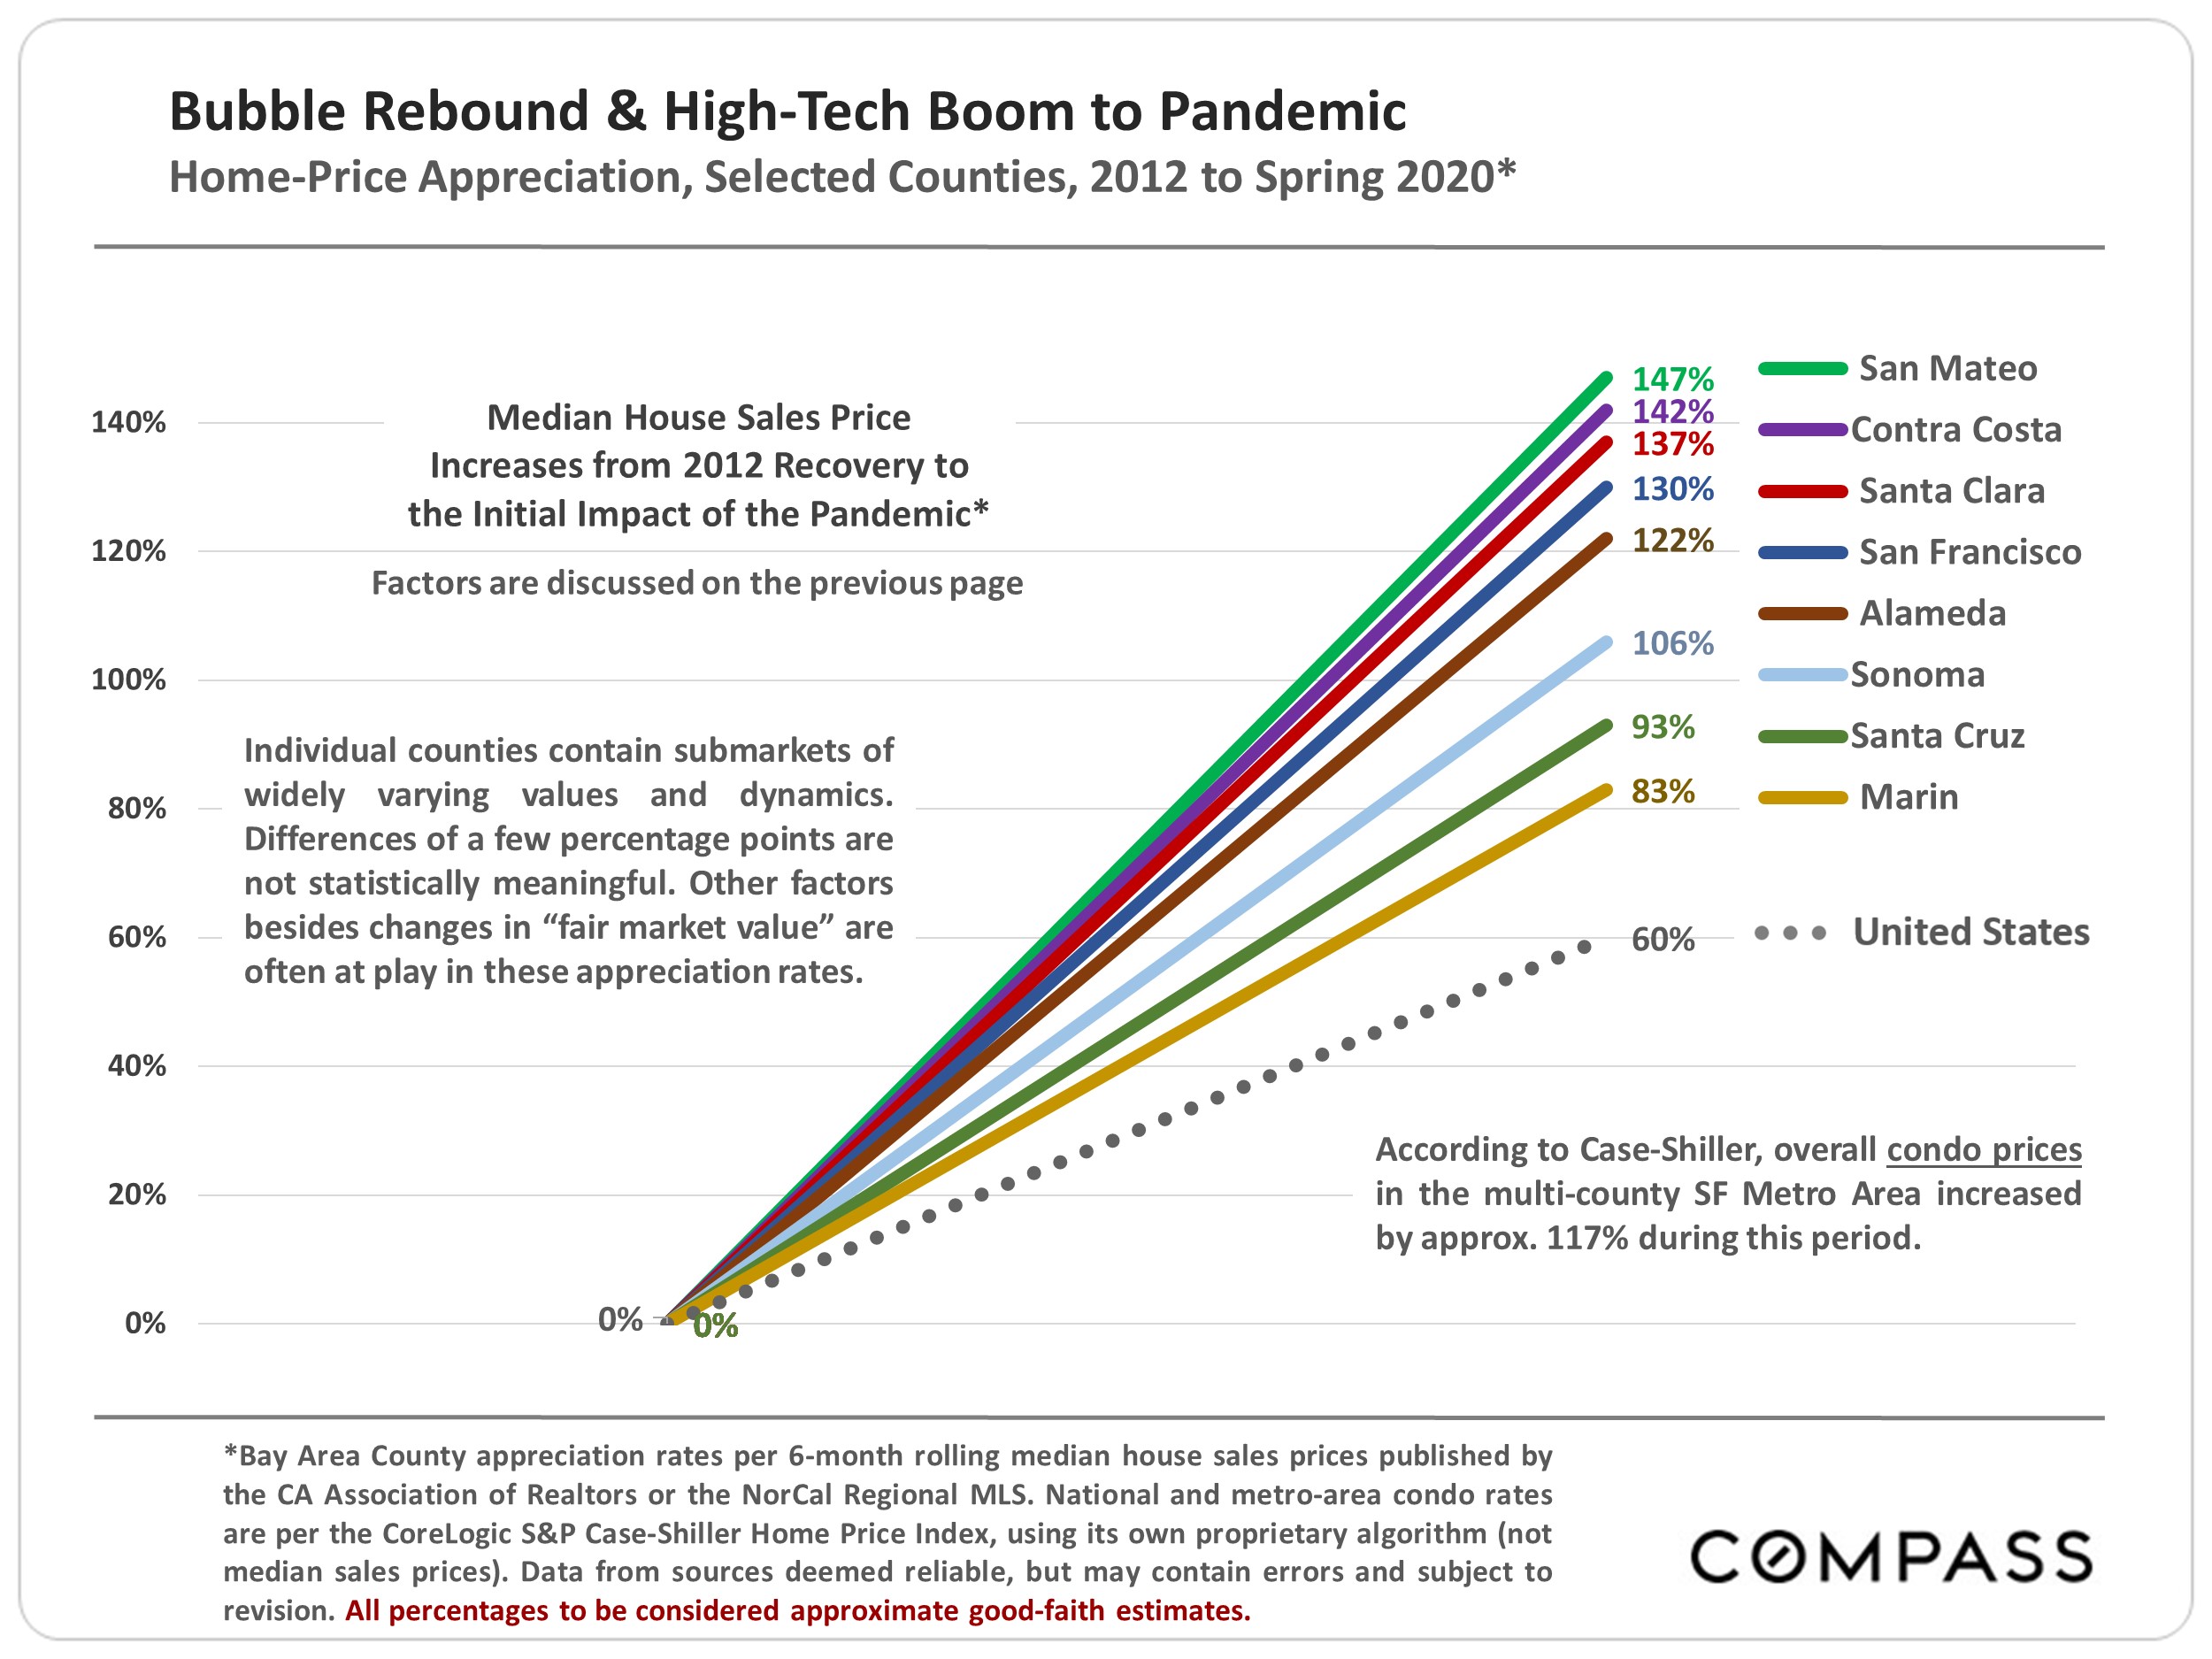
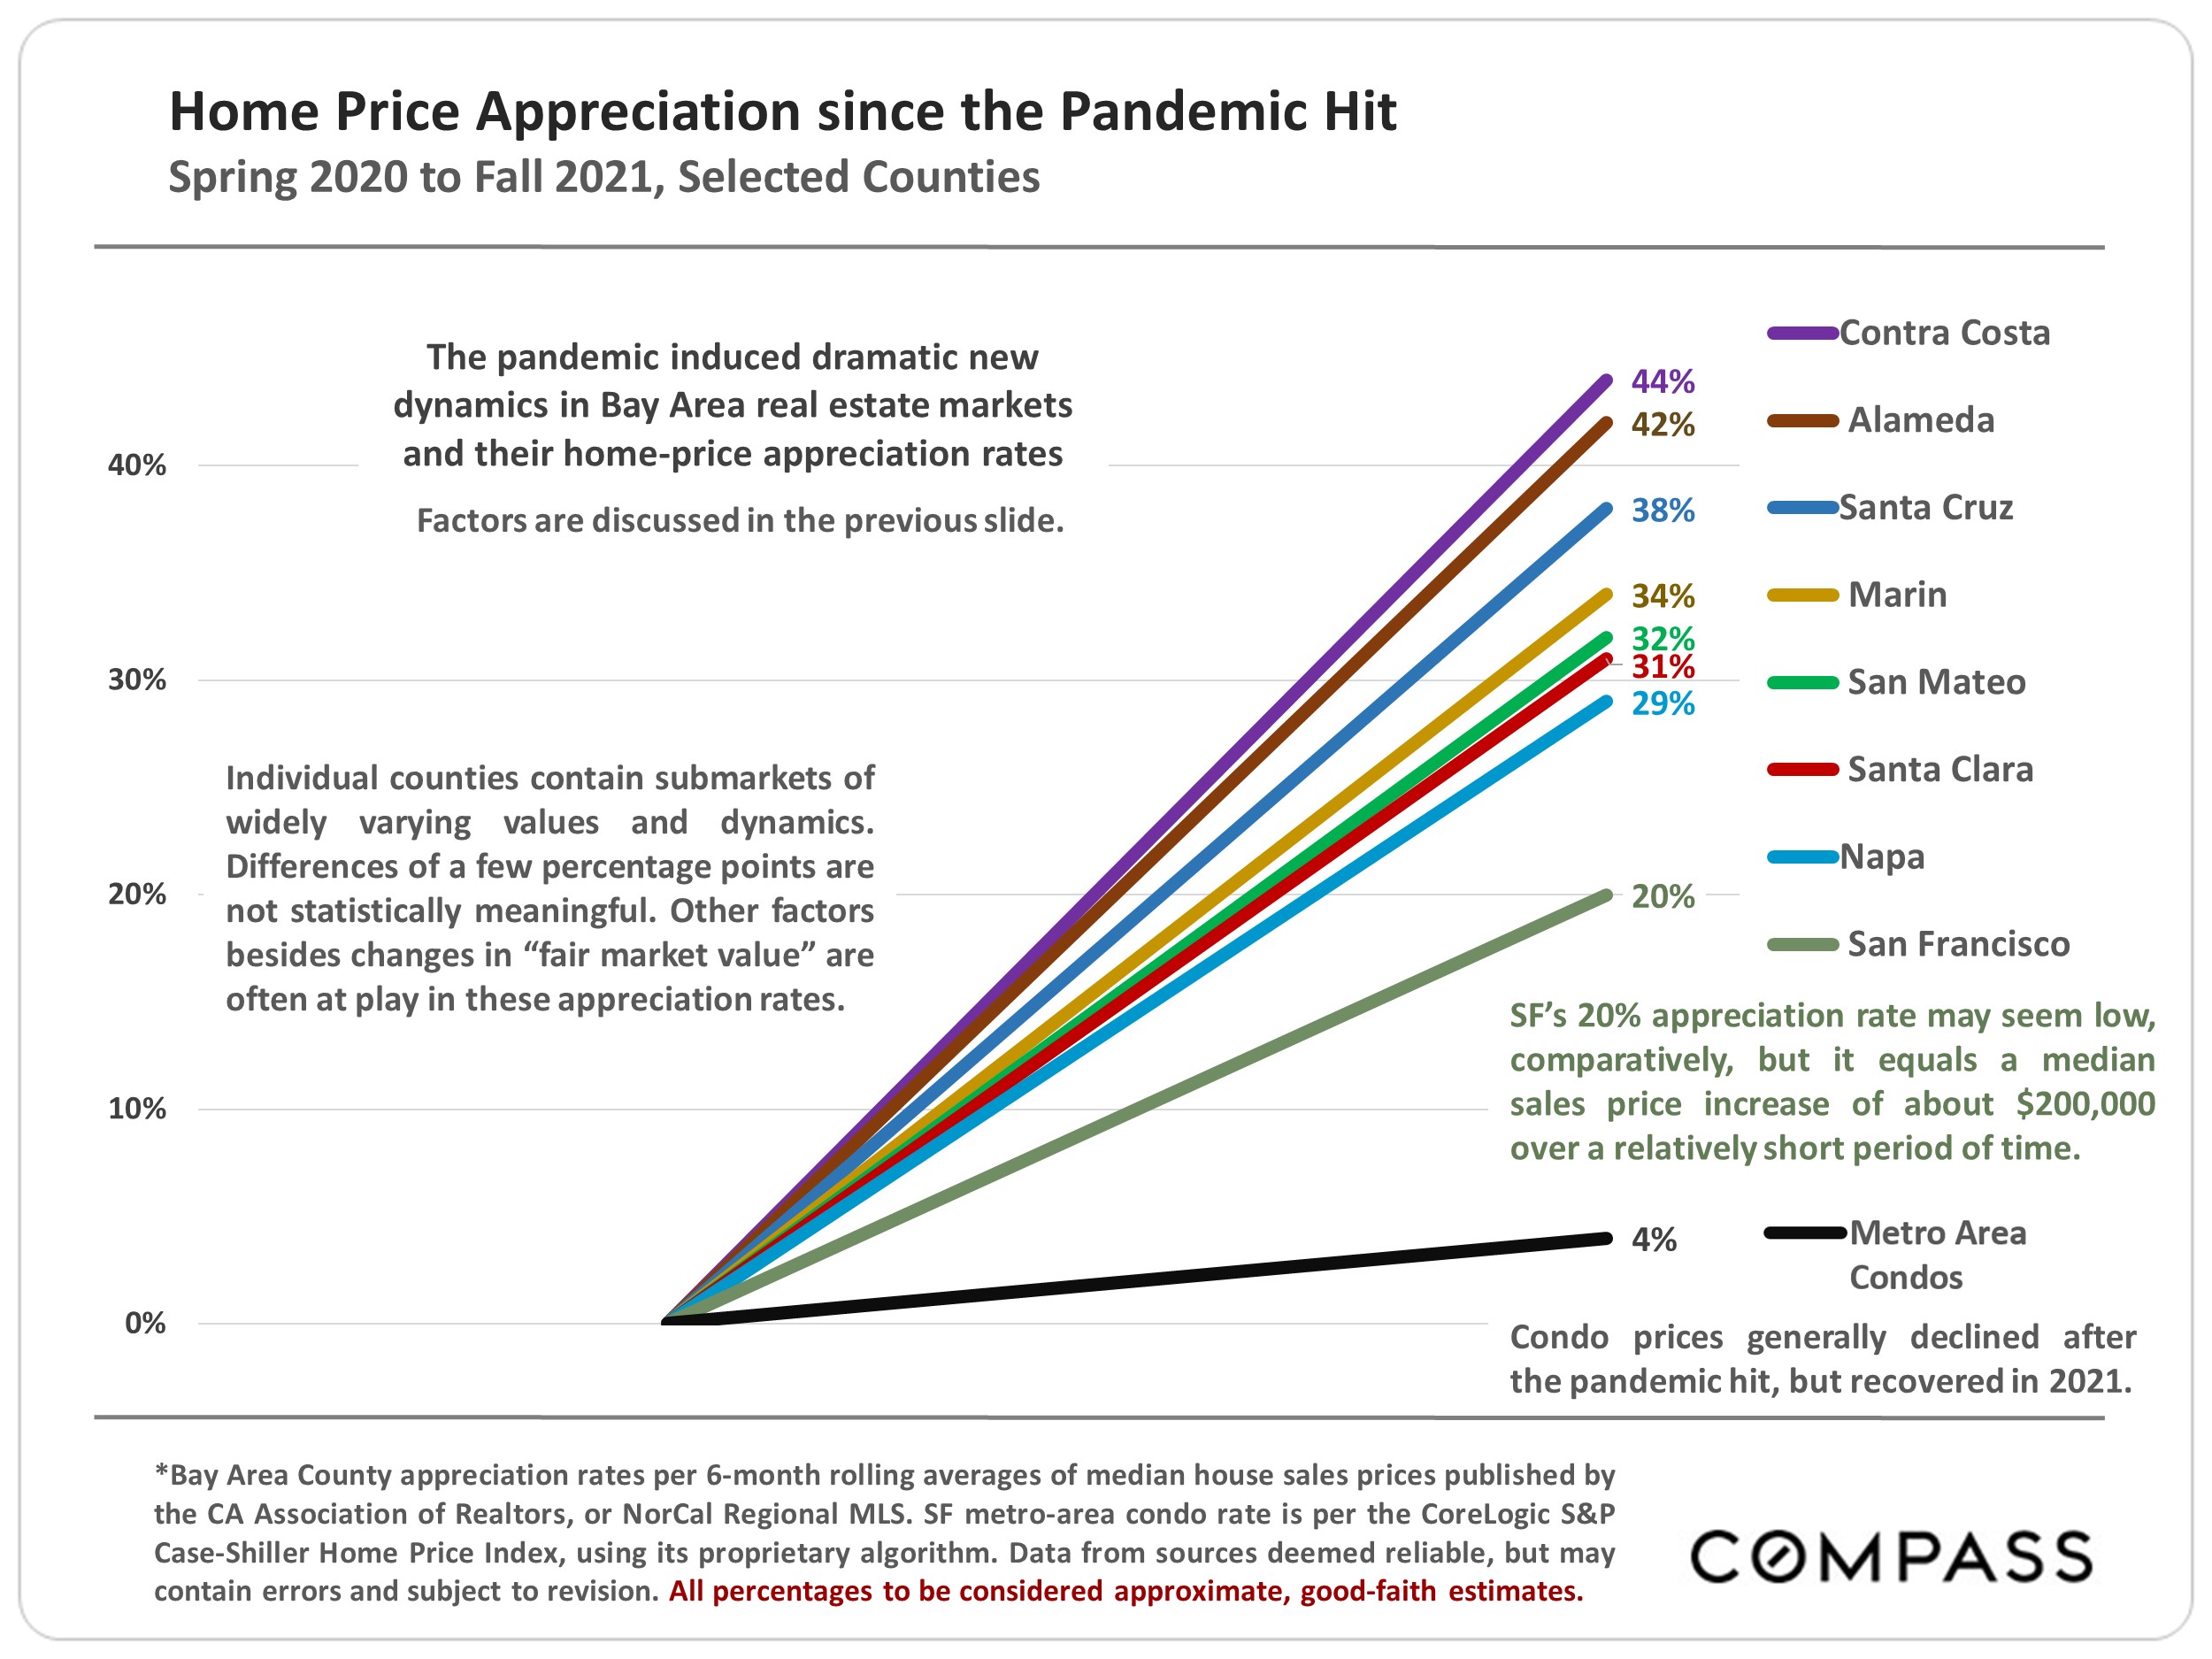
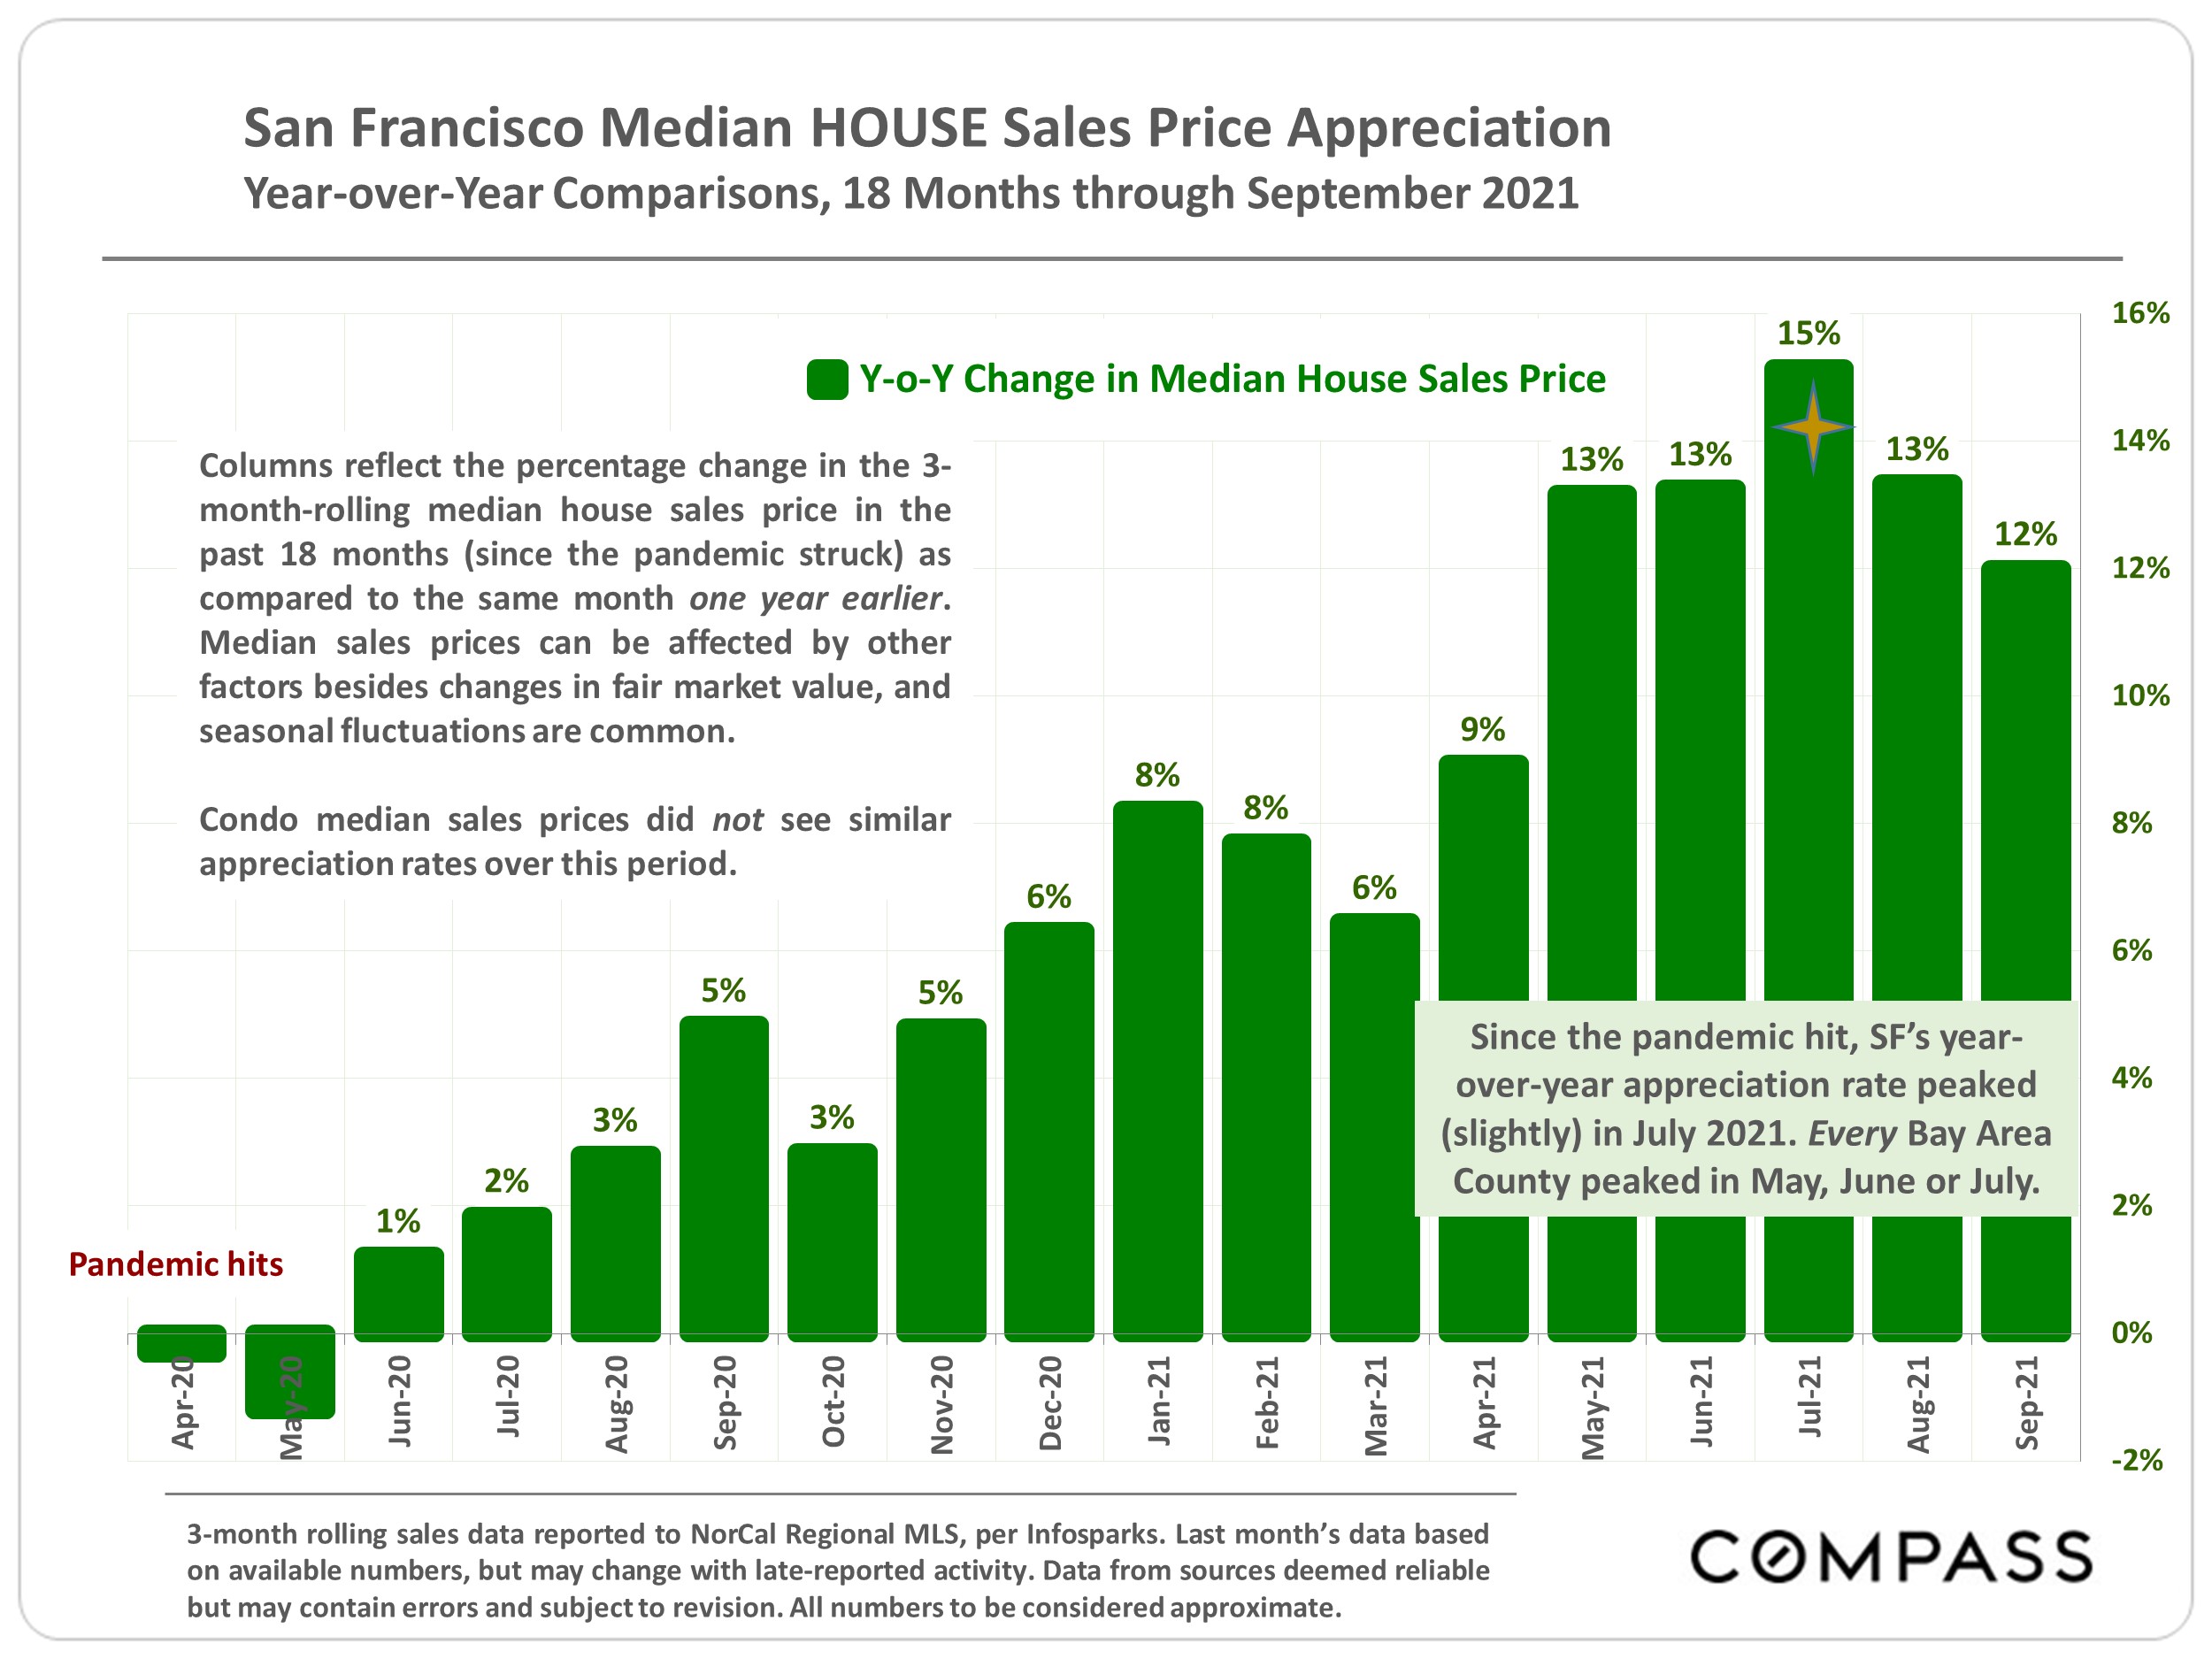
When looking at recent market changes, it is important to remember how overheated the market was in 2021 and
early 2022 – many quarter-to-quarter, and year-over-year comparisons are distorted by the unusual
(sometimes frenzied) conditions that prevailed then.
It is also wise not to jump to definitive conclusions based
upon a single quarter's data: The economy and real estate market are still in a period of adjustment.
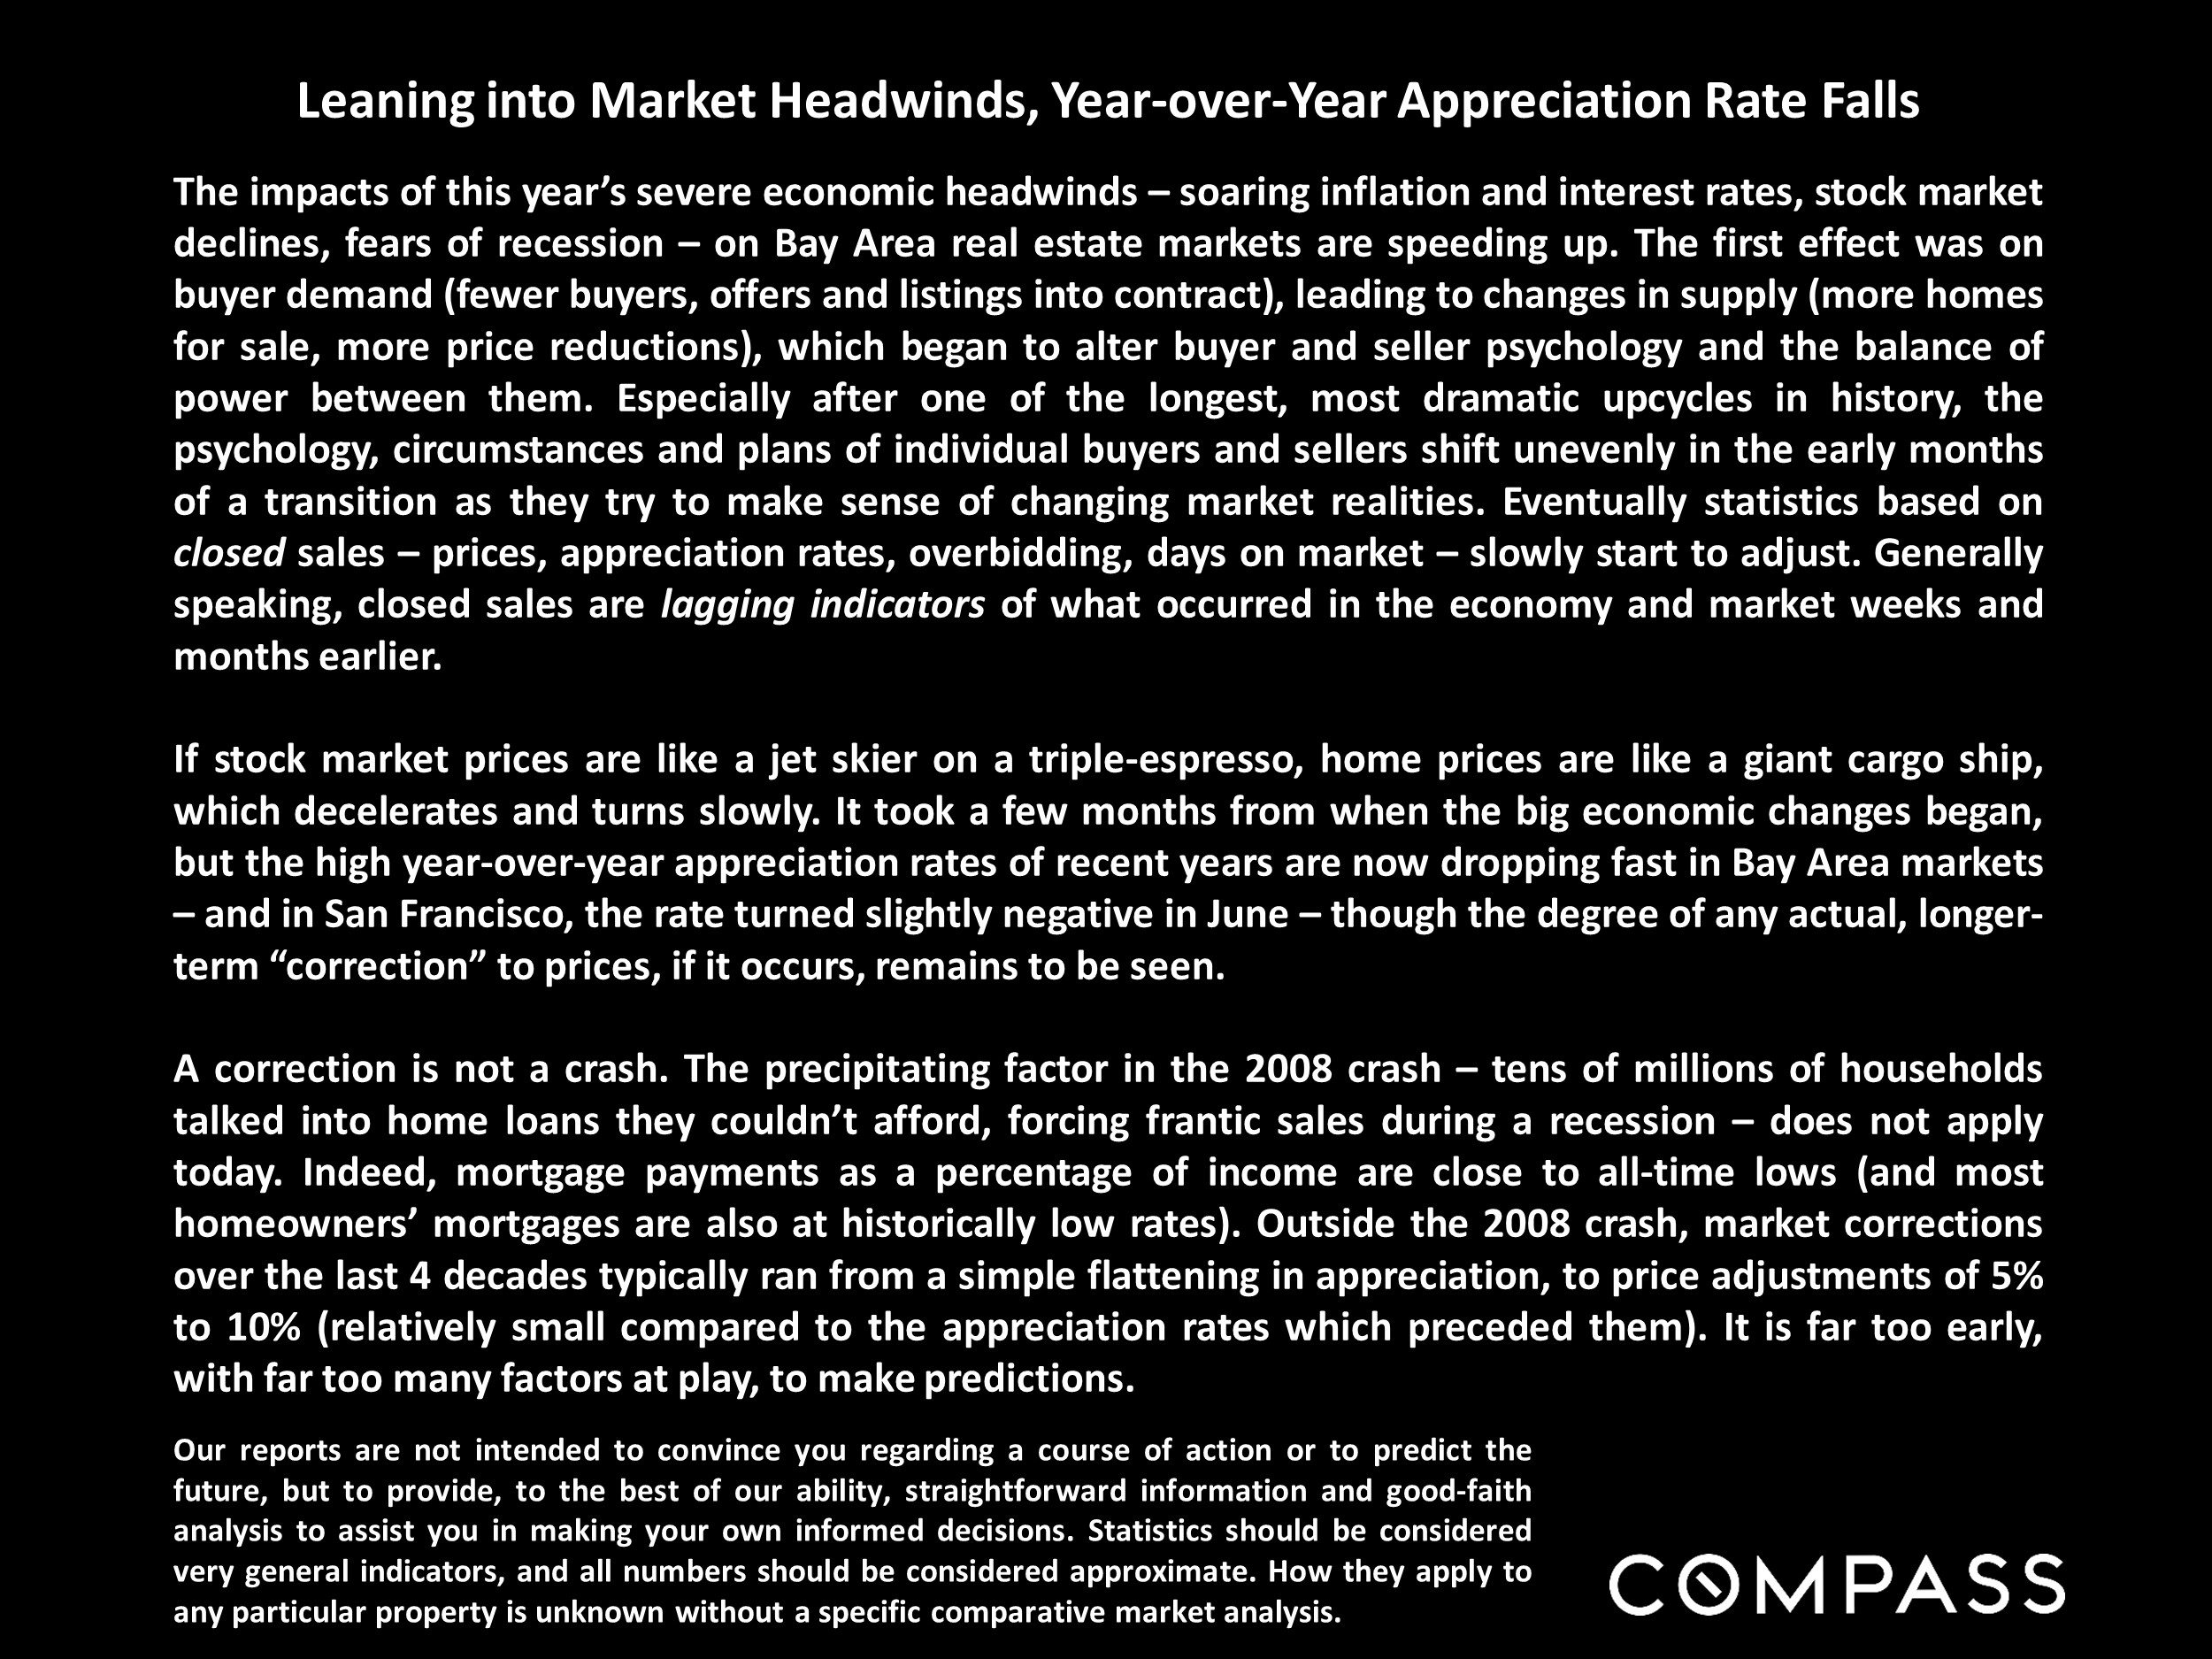
Comparisons with the crash of 2008 continue to be made, but the precipitating factor in the 2008 crash – tens of millions
of households talked into home loans they could never afford, forcing a tsunami of frantic sales during
the great recession – simply does not apply today.
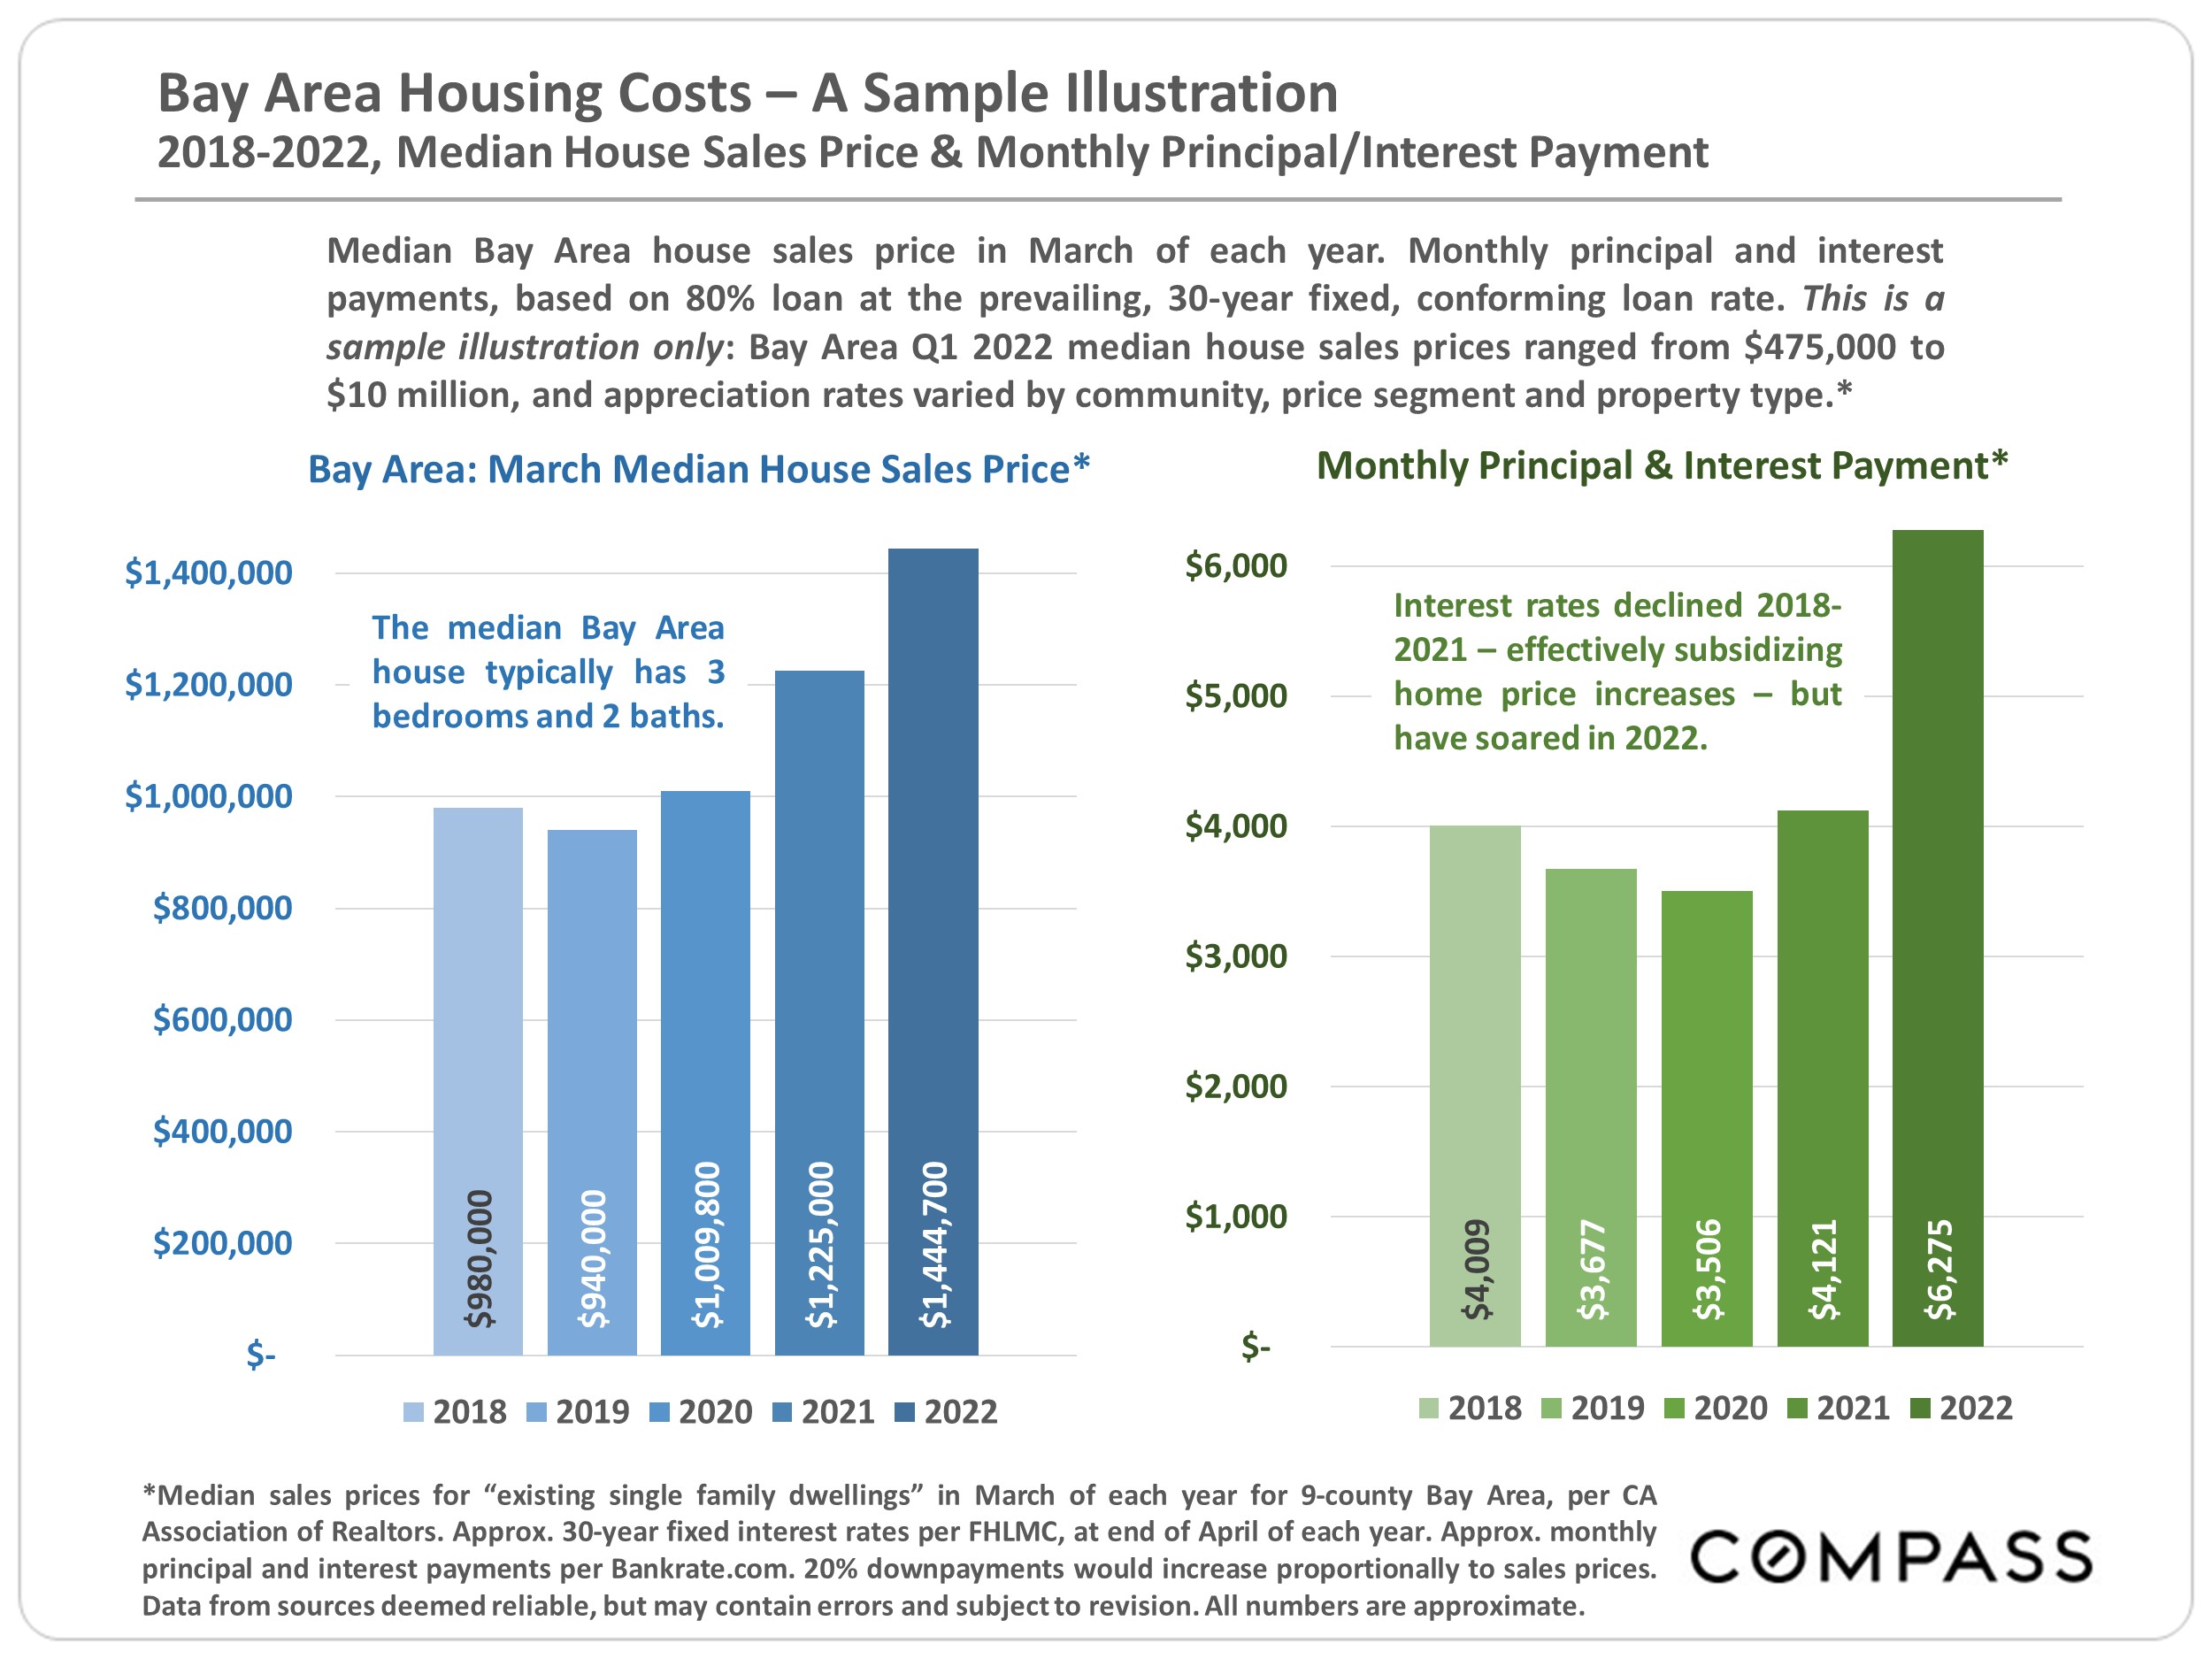
Mortgage payments as a percentage of income, and loan
delinquency rates are both close to all-time lows; most homeowners' mortgages are held at historically low rates
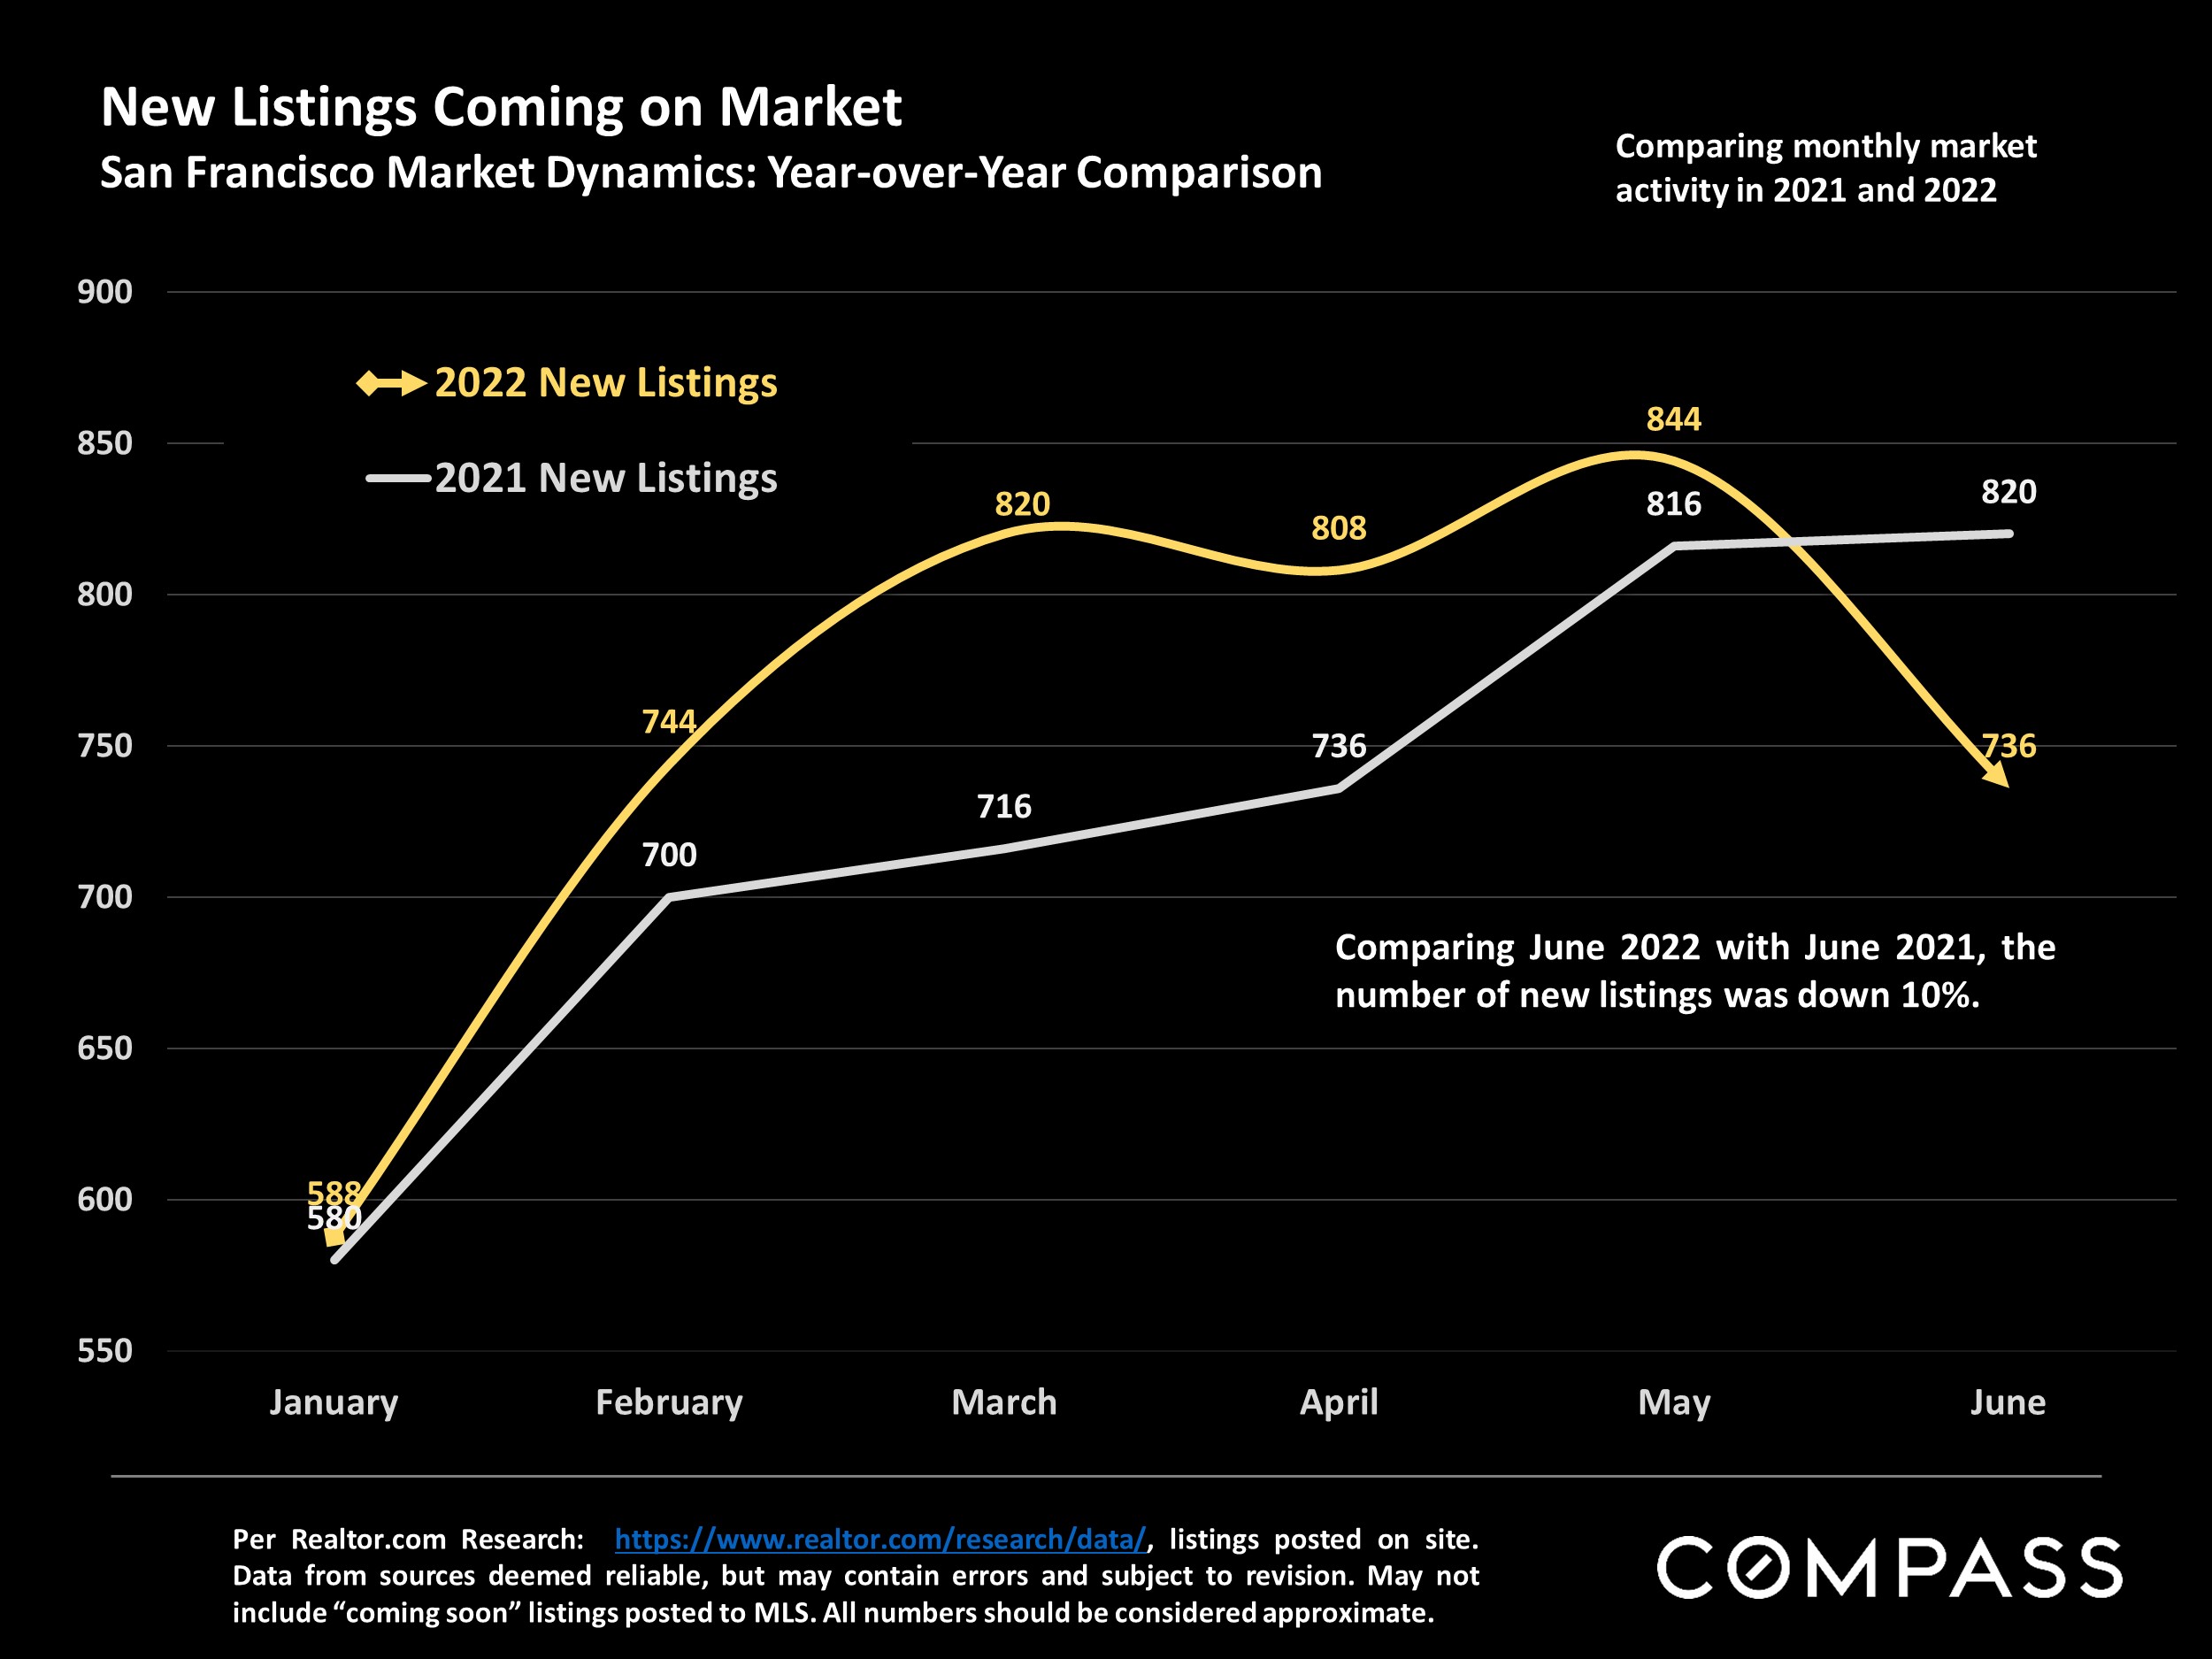
. There has been no surge of desperate sellers: New listing numbers are actually down from last year. Stock market
declines, though substantial, cannot compare with those seen in 2008-2009, and employment remains very
strong. This is not to minimize the correction the market is going through: There are certainly major economic
and demographic challenges at play right now, but a market correction is not a crash, being more like a slow
leak in an over-pressurized tire than a blowout on the highway at high speed.
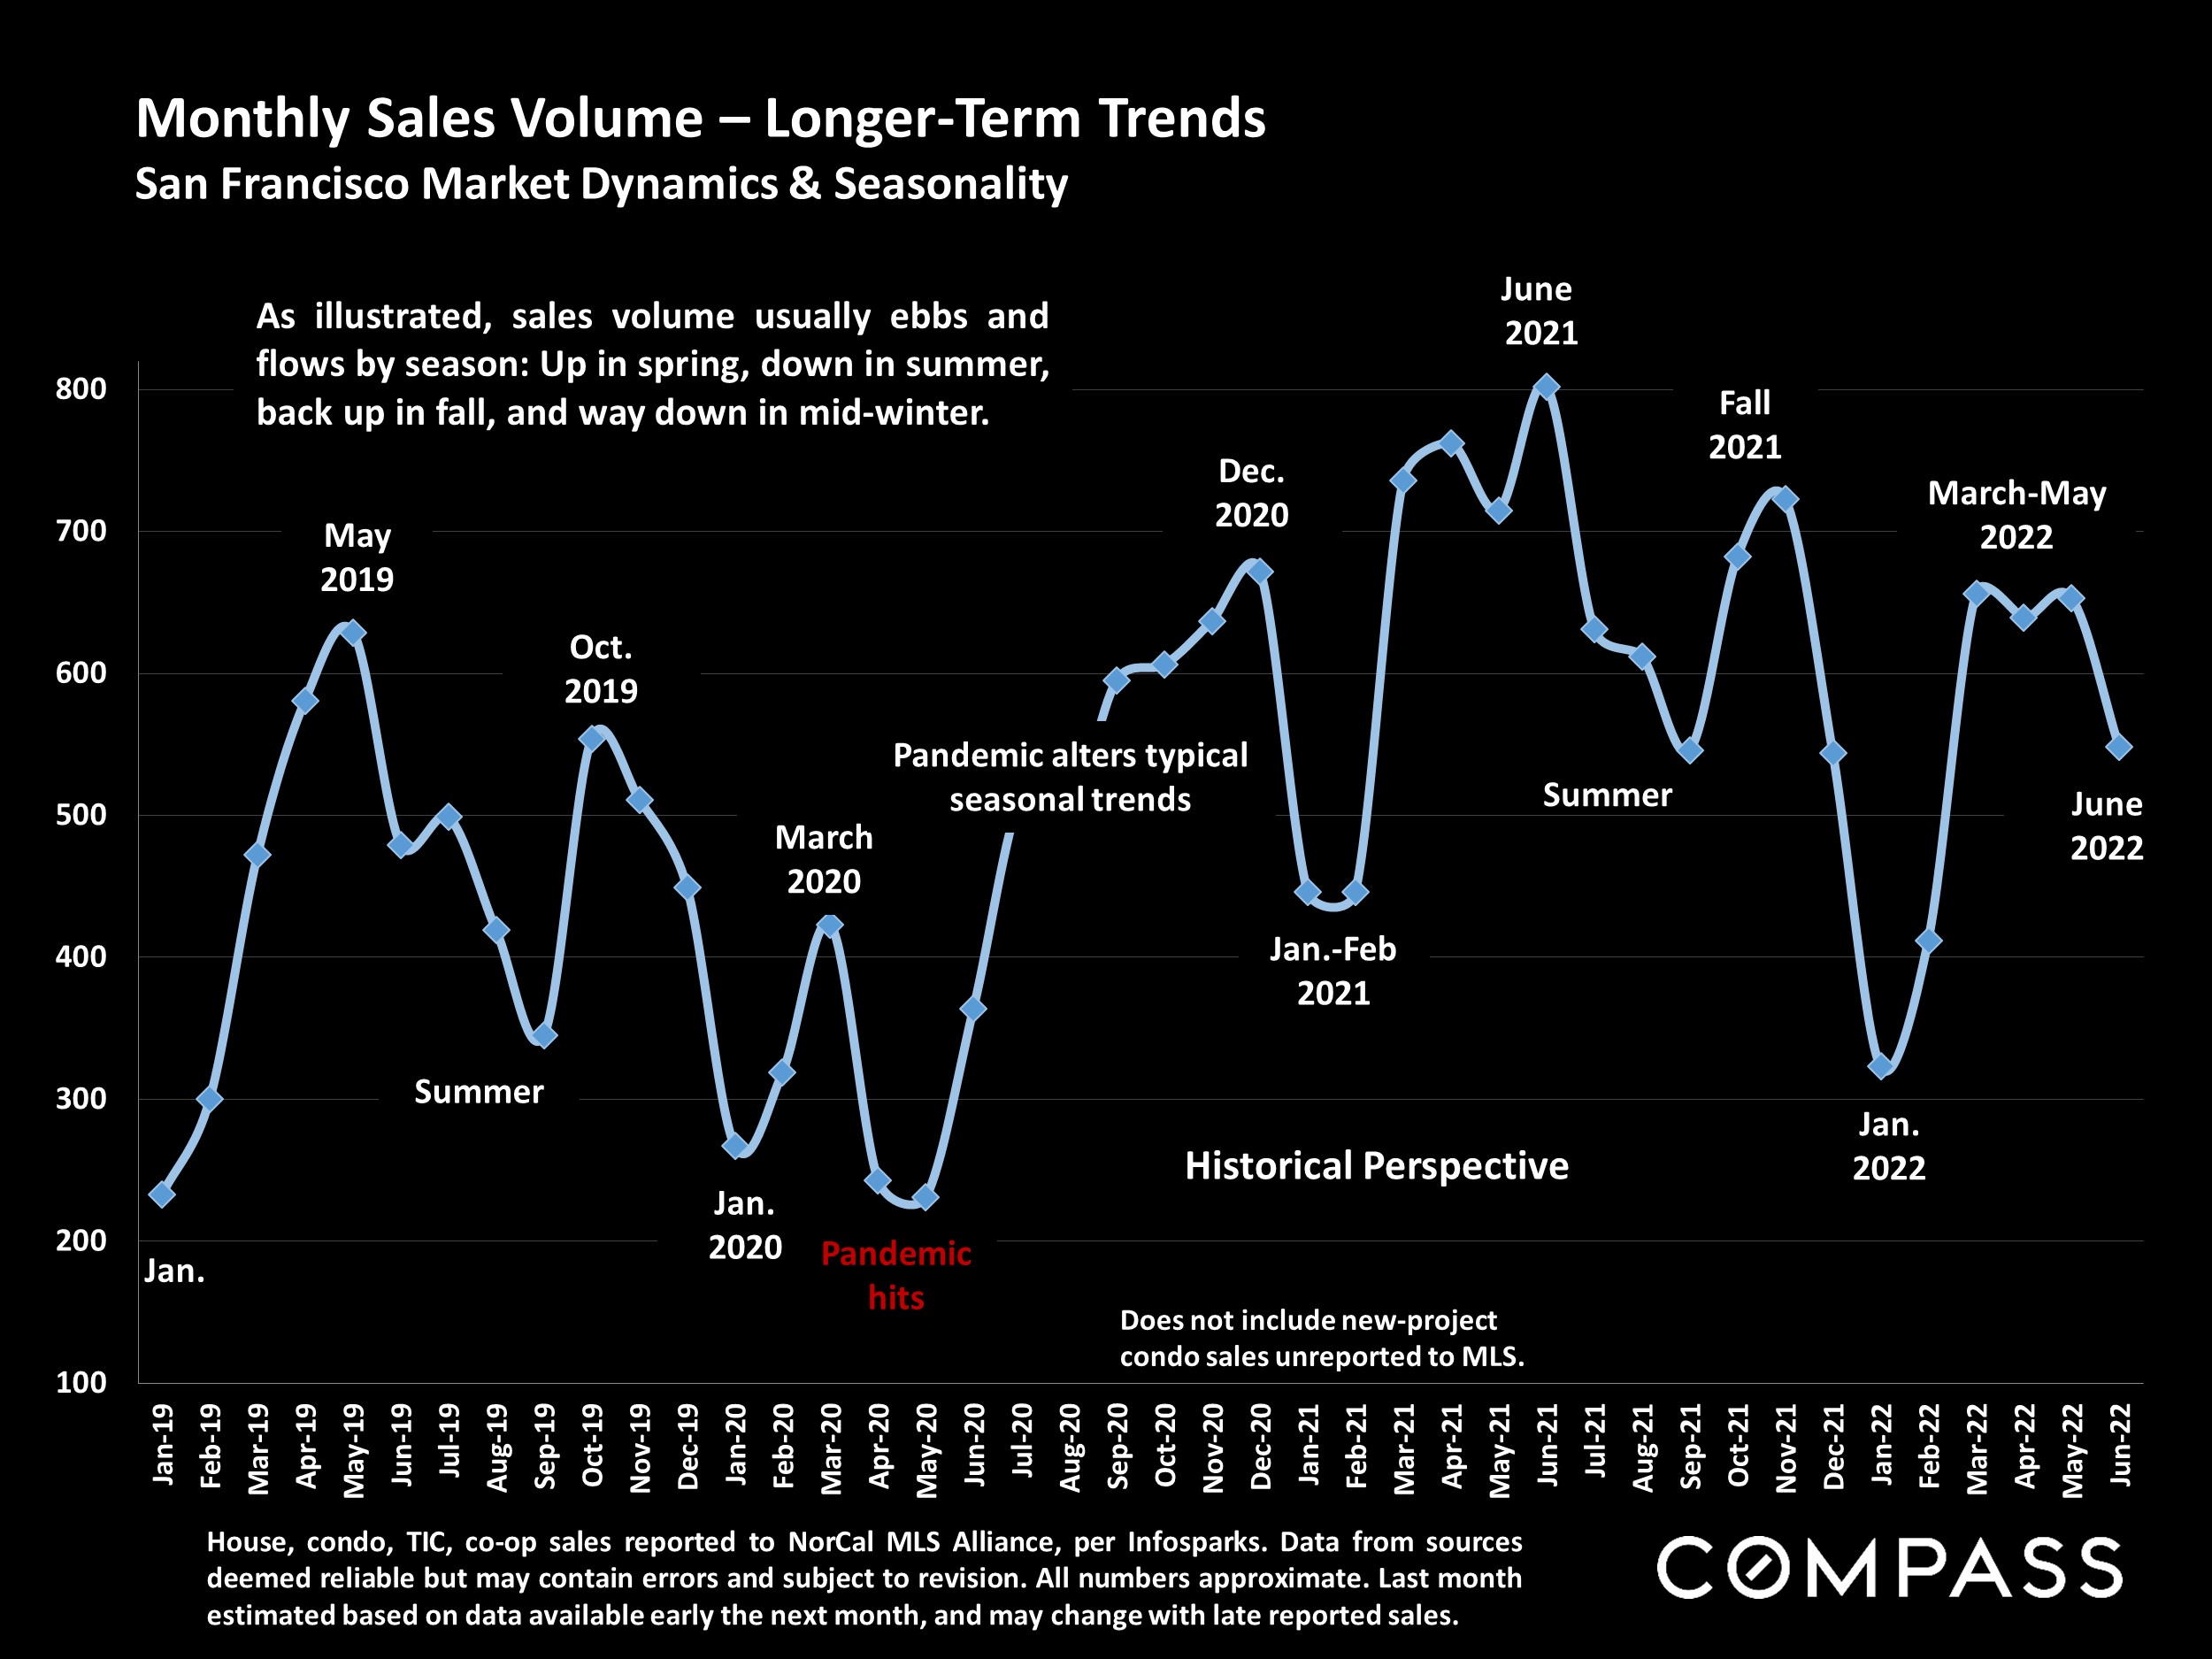
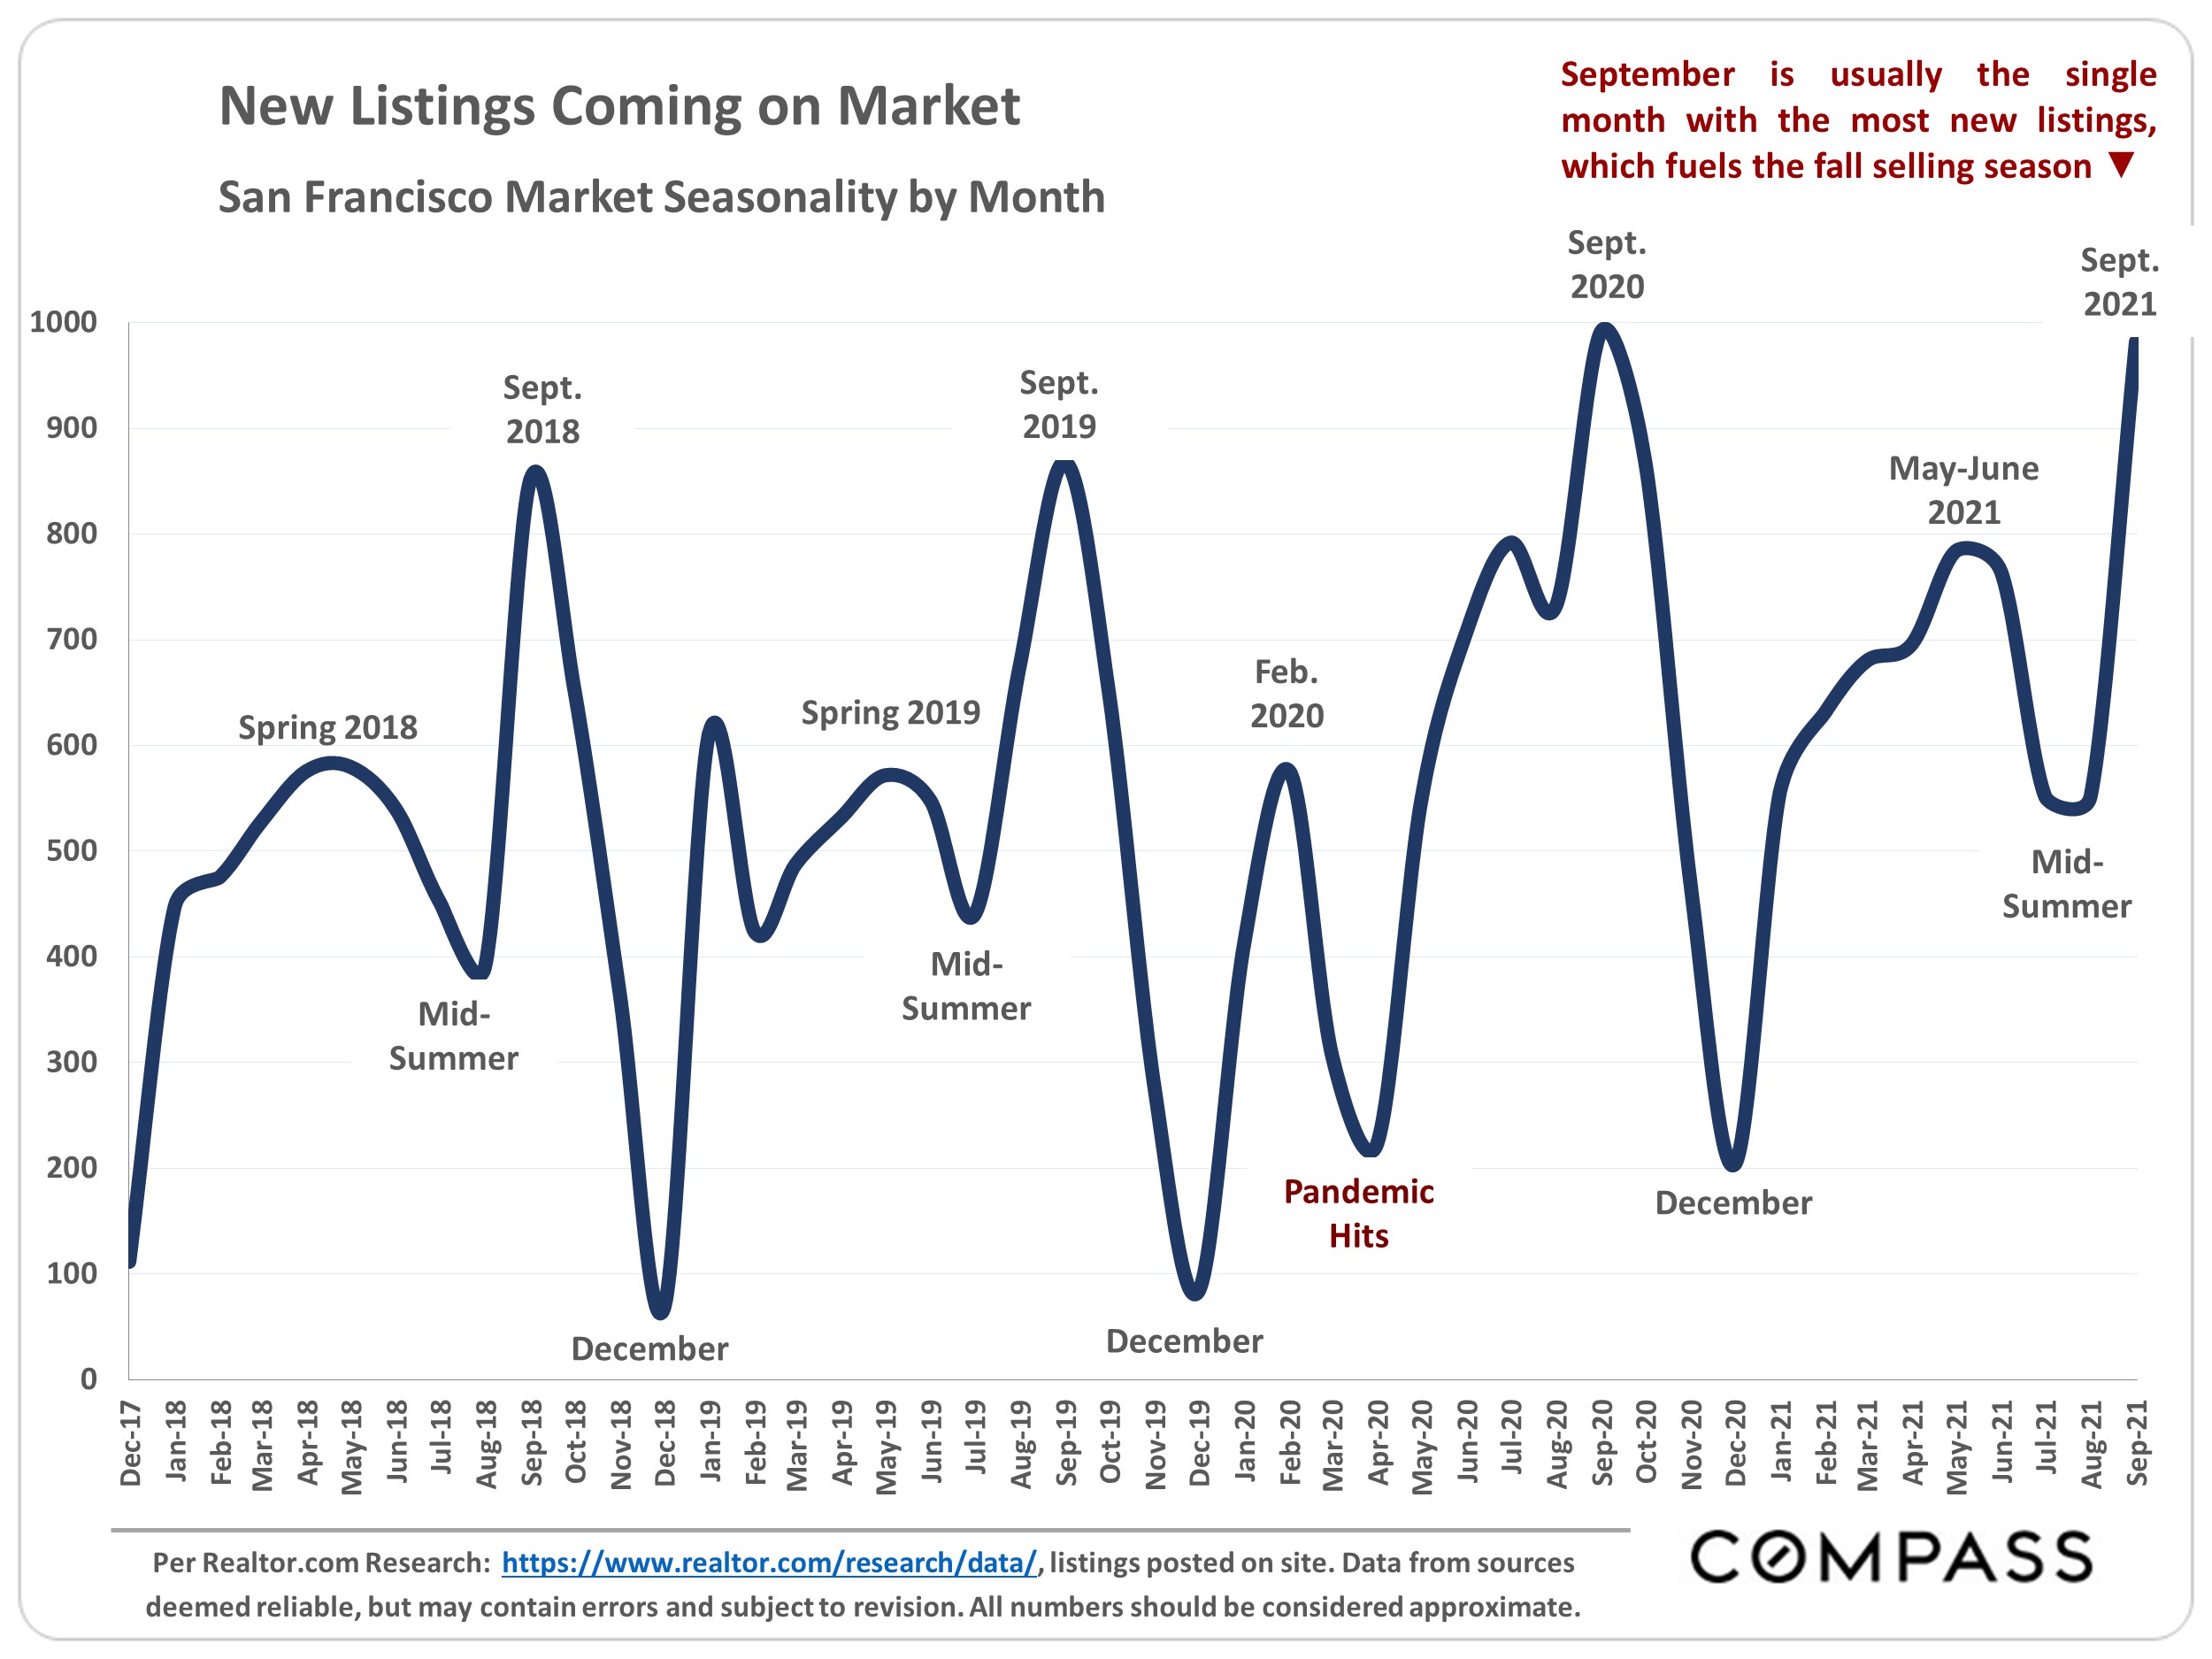
The relatively short autumn selling season began after Labor Day and runs through mid-November. The mid-
winter holiday slowdown then runs through mid-January. Though sales continue in every month of the year,
listing and sale activity drops dramatically as we near Thanksgiving. Slower markets can offer opportunities to buyers
, but the selection of homes for sale usually tumbles.
Our reports are not intended to convince you regarding a course of action or to predict the future
, but to provide, to the best of our ability, straightforward information and good-faith
analysis to assist you in making your own informed decisions. Statistics should be considered
very general indicators, and all numbers should be considered approximate.
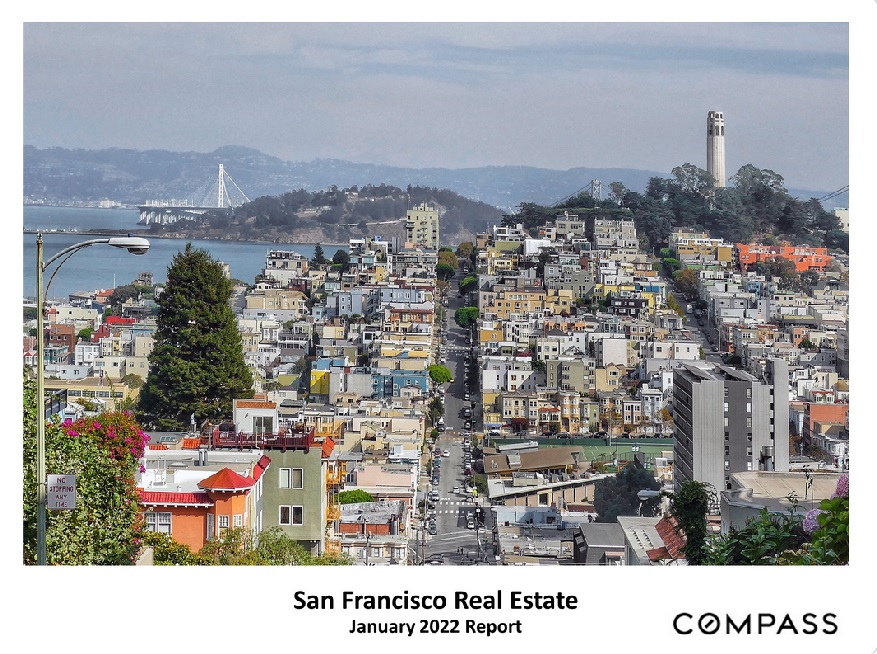
Click on image below for the SF October 2022 Report
Click on image below for Macroeconomic indicators related to Bay
Area Real Estate
Click on image below for Bay Area market cycles since 1990
Click on image below for Statistics, Psychology, Expectations, and Buyers' & Sellers' Markets
Click image below for Oct 2022 Bay Area Real Estate Survey
Happy Spring! May’s newsletter has insightful
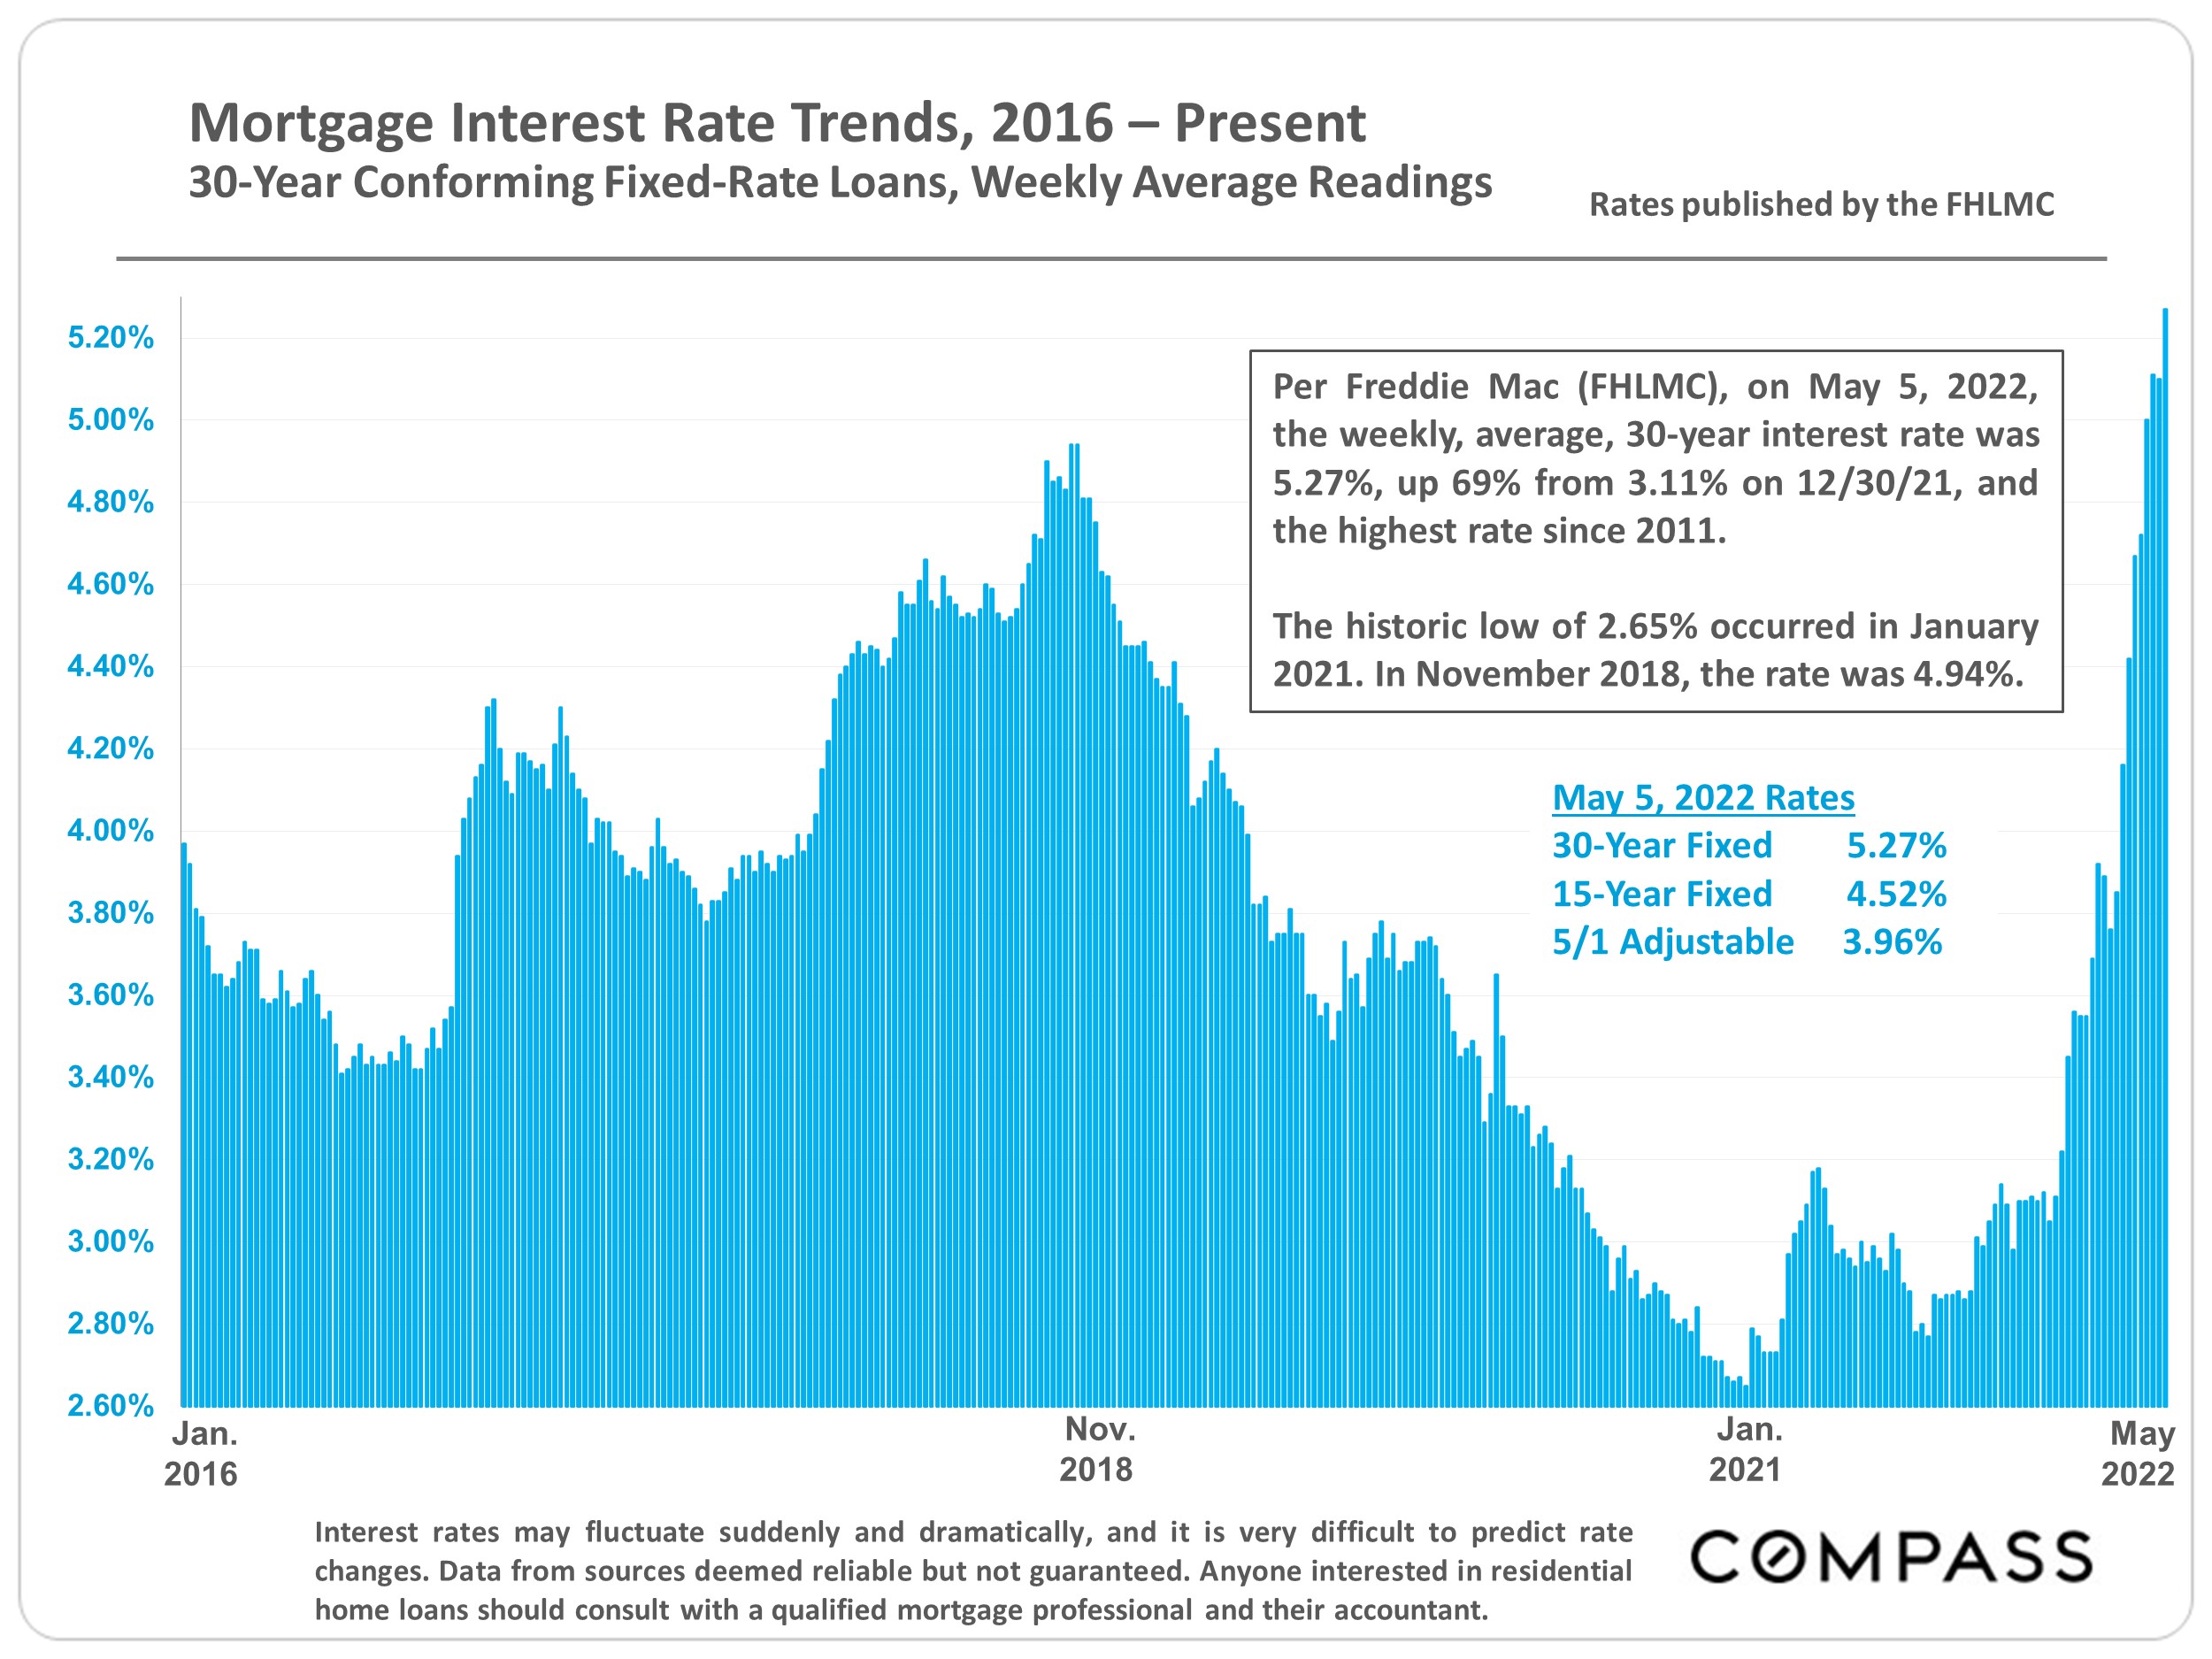
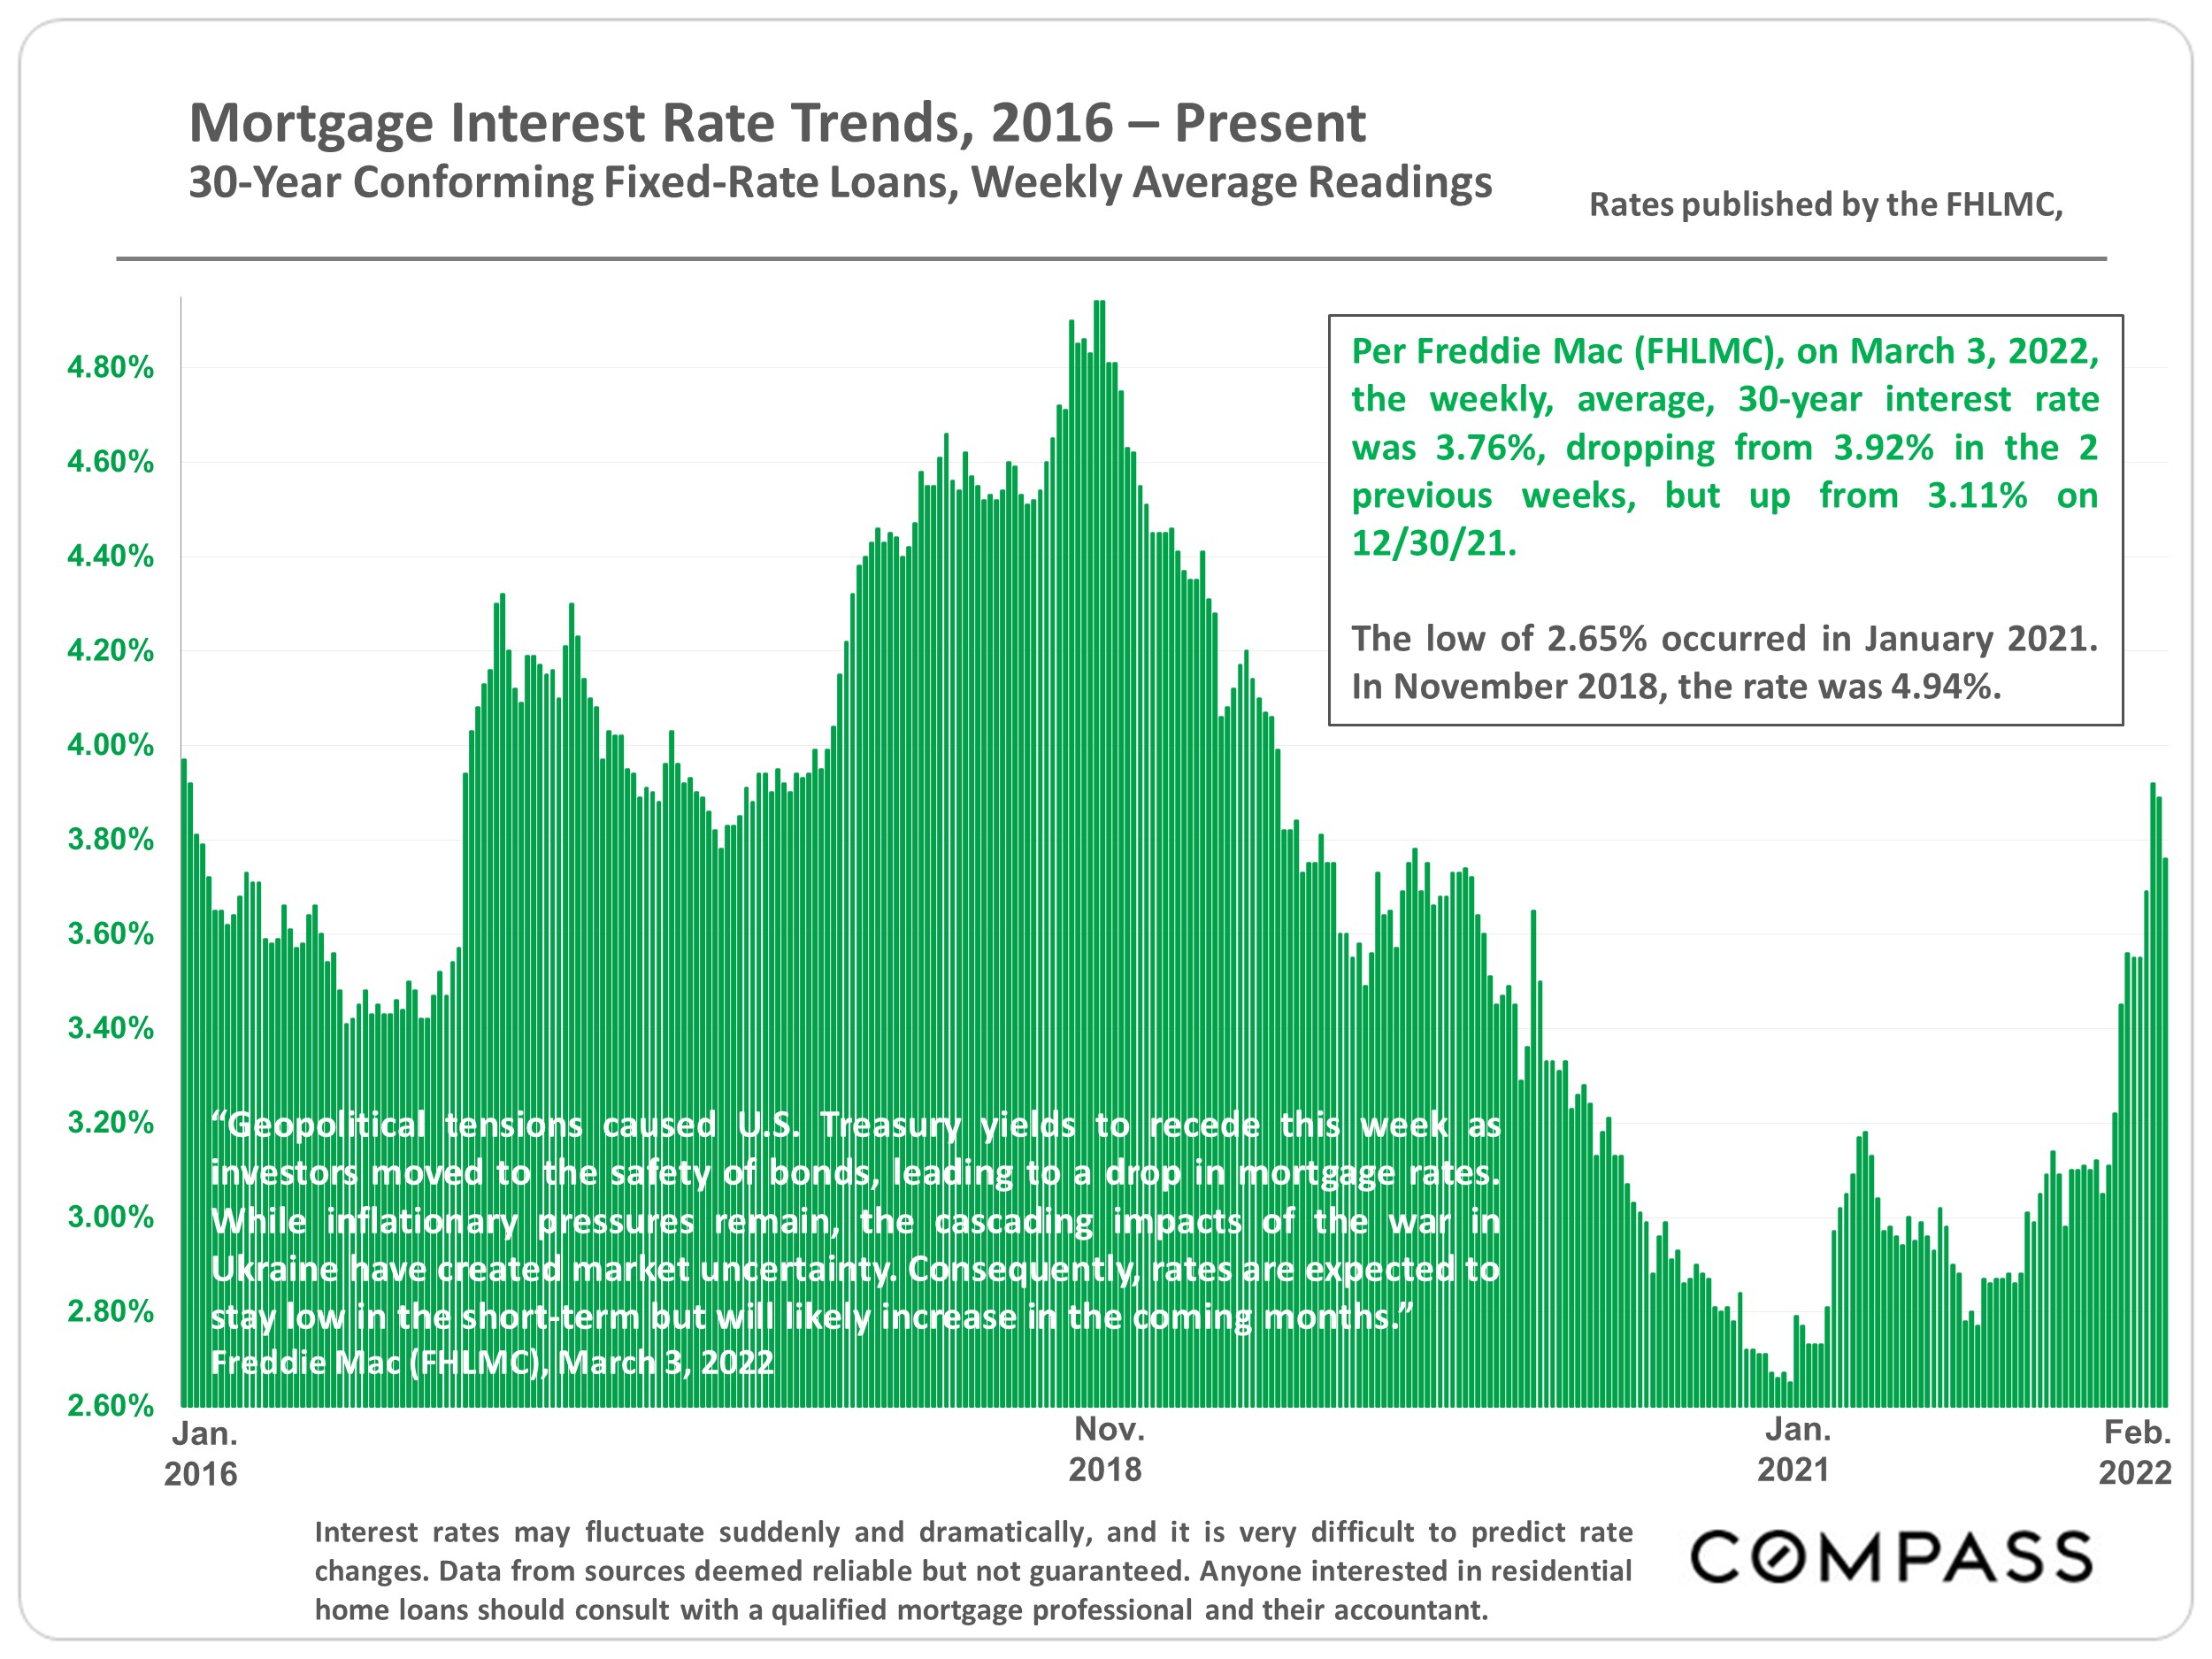
information about the impact of the recent interest rate increases on our real estate market, as
well as general market insights and the current cooling trend in the market. It’s difficult to
generalize however, as there were multiple offers in the past couple of offers I have written for
buyers, and the winning bids were quite a bit higher than expected.
Please do not hesitate to reach out with any real estate questions, vendor needs, or if you
need a Realtor in a different area.
Compass now offers us a great tool to handpick top agents for our referral needs.
In the meantime, have a great summer. I hope you have some plans to do something fun :
)
This month's
newsletter has links to real-time real estate information for SF and the entire bay area that is
continually being updated.
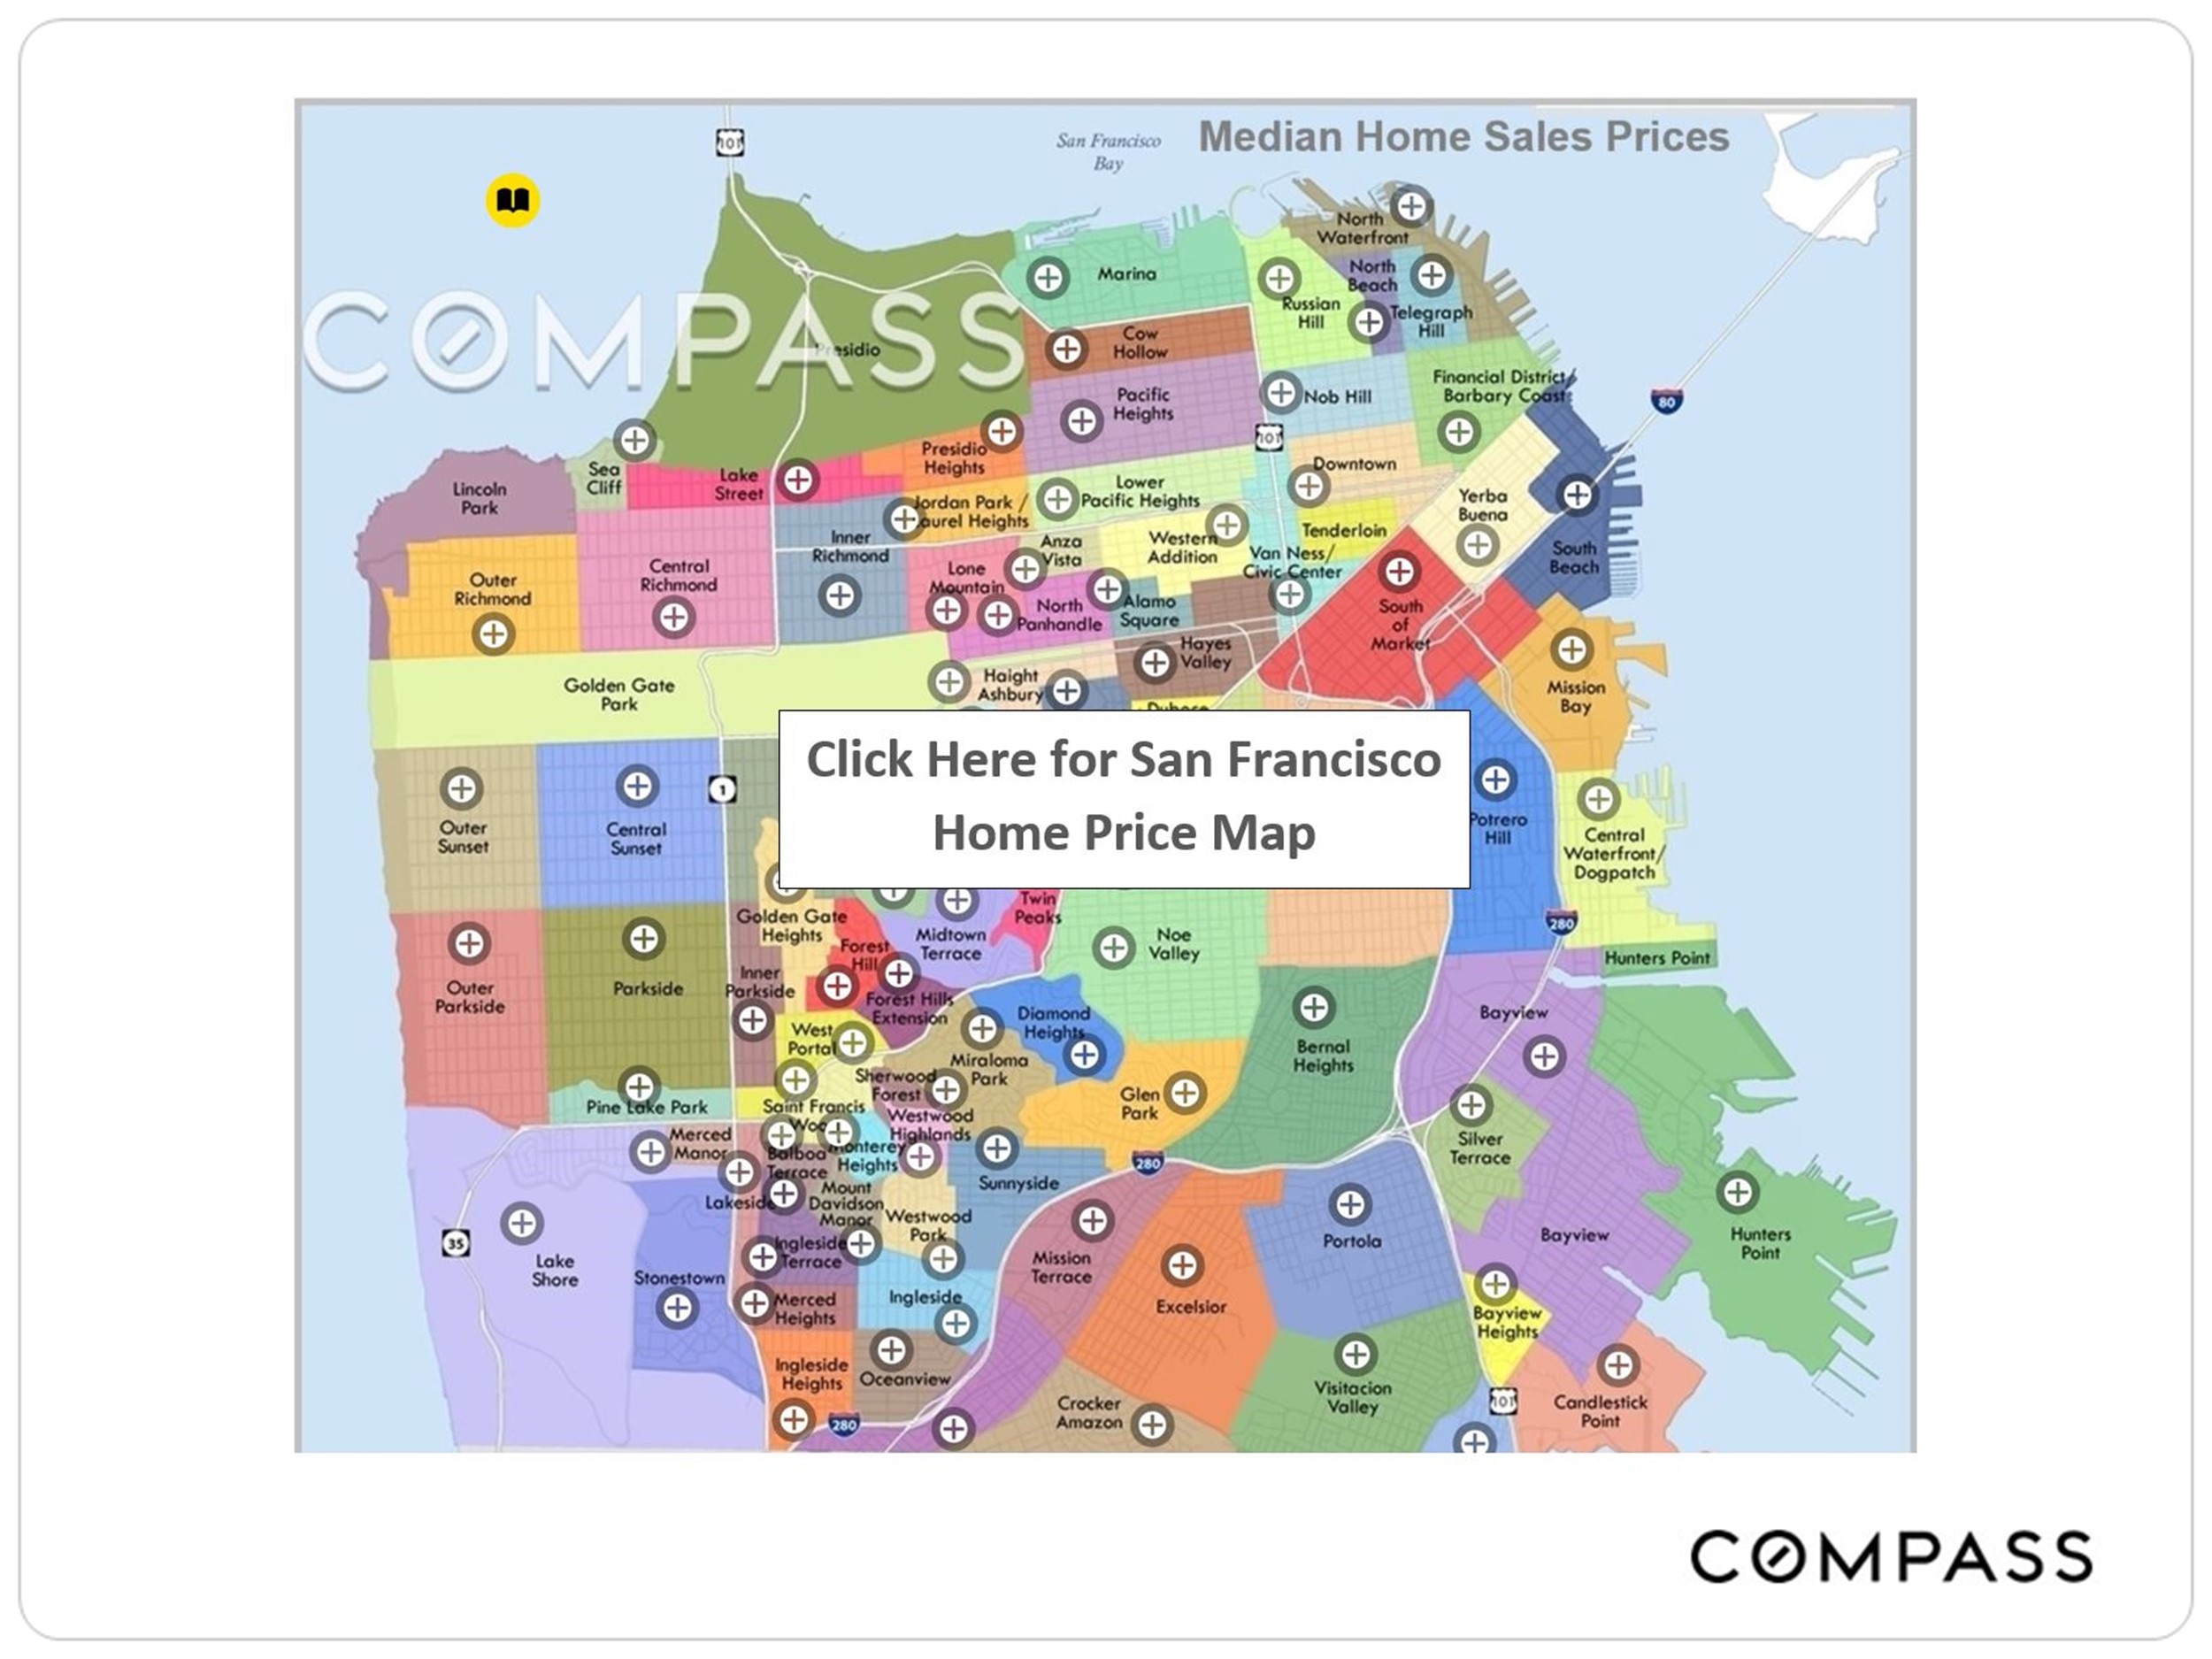
It includes SF
home median prices by neighborhood, Bay Area Market Reports, current SF Homes for sale by
neighborhood, and more.
The links (the
black boxes) can be saved for future reference as they will always be current.
I’m always available for real estate questions, Realtor referrals outside SF, vendor
referrals, and anything else real estate or non-real estate related.
The most up-to-date and comprehensive analysis of San
Francisco home prices, values, conditions and trends of the SF Bay Area residential real estate
market. These links auto update to be the most current.
Compass is a real
estate broker licensed by the State of California operating under
multiple entities. License Numbers 01991628, 1527235, 1527365, 1356742, 1443761,
1997075,
1935359, 1961027, 1842987, 1869607, 1866771, 1527205, 1079009, 1272467. All material
presented
herein is intended for informational purposes only and is compiled from sources deemed
reliable
but has not been verified. Changes in price, condition, sale or withdrawal may be made
without
notice. No statement is made as to accuracy of any description. All measurements and
square
footage are approximate. Equal Housing Opportunity.
I hope this finds you well. Our SF real estate market is exhibiting its typical early Spring
season characteristics. Limited supply and pent up demand. We’ll have a better sense of the spring
market in a couple of months after the spring inventory comes on the market so we can start tracking
price trends. I’ll check in with you in a couple of months. Until then, here is some seasonal and historic
data on home values, interest rates, market cycles and on the various influences that can affect real
estate values.
If you have any real
estate questions, please give me a call. For those of you who have sent me referrals of buyers and
sellers, thank you very much! I appreciate you thinking of me when thinking real estate! Please keep
those referrals coming. I love working with your friends, colleagues, and family members : )
Best regards,
Pota
Pota’s Real Estate Corner
I just represented the buyers of
this Forest Knolls home. Competed against 5 offers.
Here we are in the last quarter of the year! It's definitely feeling a lot like Fall!
Market is still strong, albeit pockets of inactivity. It is exhibiting the typical characteristics of Q3. A surge of inventory after the summer doldrums leads to more choices for buyers and a bit of a slowdown compared to the past six months, especially the superheated spring season.
I’m always available for real estate questions, Realtor referrals outside SF, vendor referrals, or anything else real estate/non-real estate related.
I hope you enjoy this fall season!
Best regards,
Pota
Pota's real estate corner
Reflecting this typically busy time of year, I currently have listings across the city –Excelsior, Potrero Hill, NOPA, Marina. Preparation is key. All our listings are presented so they look their best.
May's newsletter looks at pricing and inventory trends in this "overheated" (my term, but I'm sure some of my clients would agree) market.
As an example, I just got a buyer into contract after 4 tries. She competed against 19 others to win. She was starting to worry that the door to SF home ownership was closing for her due to rising prices. She is exhausted but ecstatic.
Not enough supply and too much demand is turning real estate into what one expert calls a "luxury commodity."
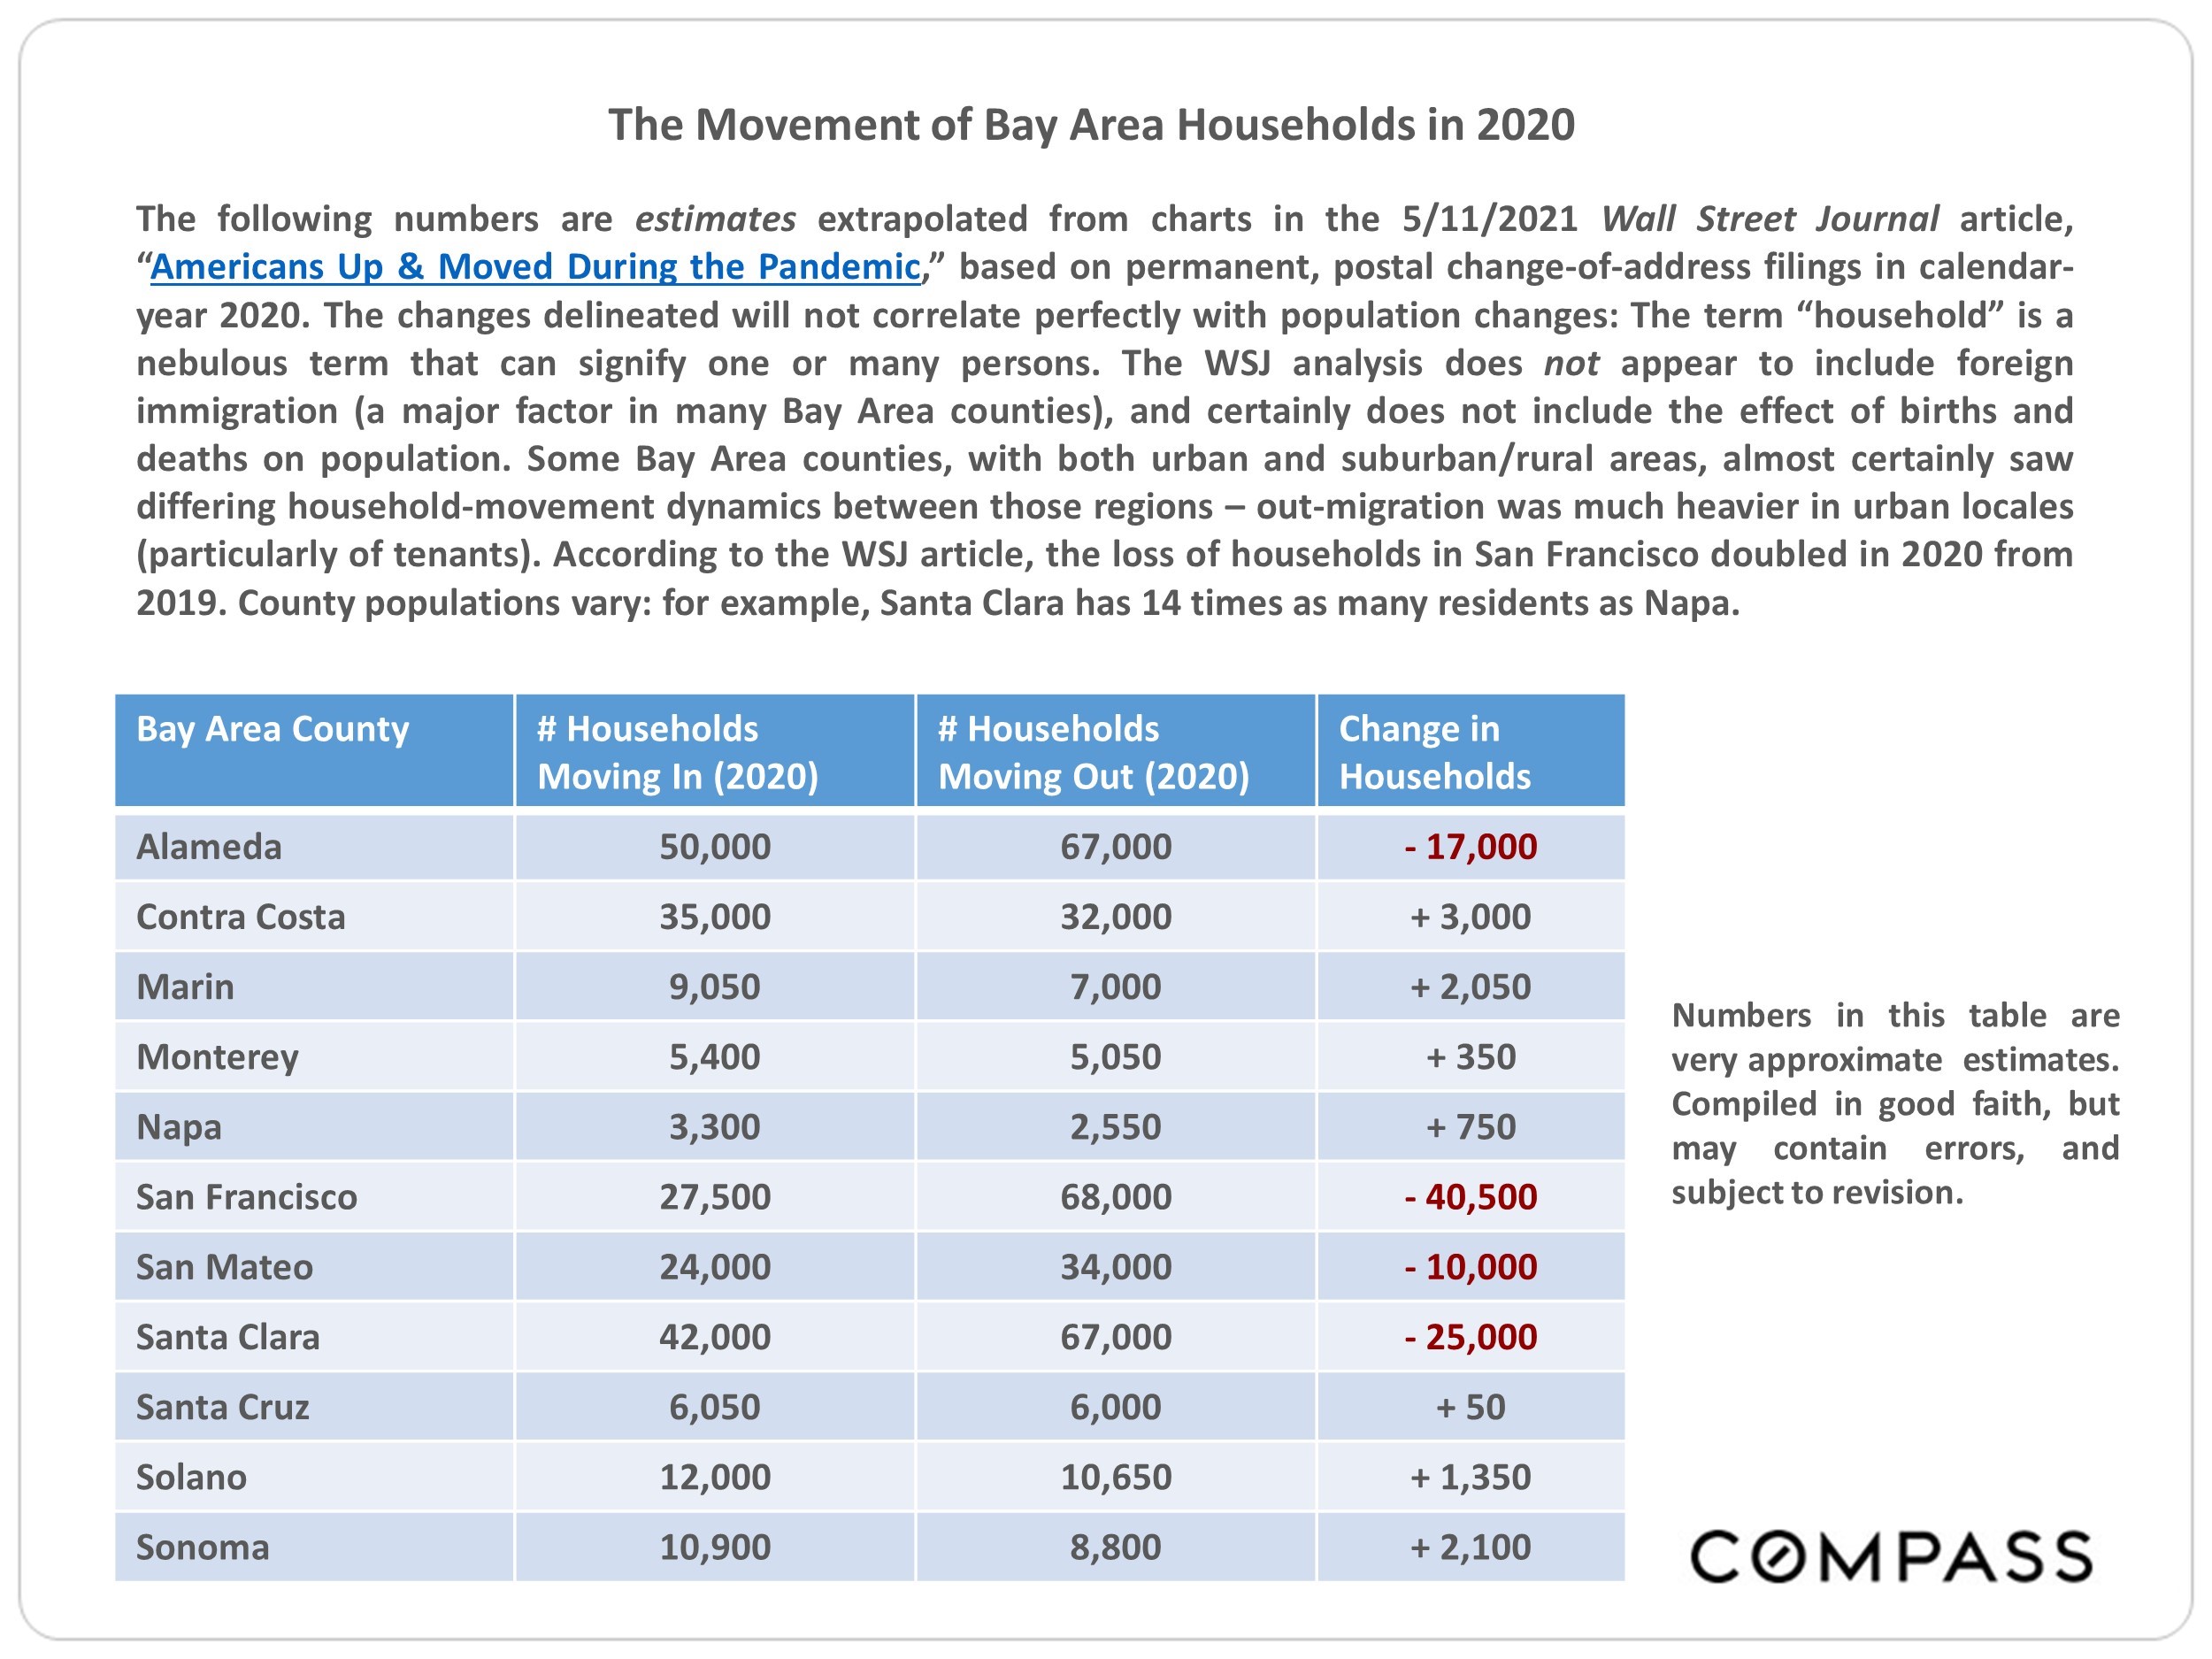
Also included is a look at migration into and out of the bay area. Please click on the link below for the full report.
Please do not hesitate to reach out for vendor or out-of-area Realtor referrals, or just to say hello!
May you all be well. Happy Spring!
Best regards,
Pota
For the full report on Bay area population change and migration, please click the image.
Compass is a real estate broker licensed by the State of California operating under
multiple entities. License Numbers 01991628, 1527235, 1527365, 1356742, 1443761, 1997075,
1935359, 1961027, 1842987, 1869607, 1866771, 1527205, 1079009, 1272467. All material presented
herein is intended for informational purposes only and is compiled from sources deemed reliable
but has not been verified. Changes in price, condition, sale or withdrawal may be made without
notice. No statement is made as to accuracy of any description. All measurements and square
footage are approximate. Equal Housing Opportunity.
Before I get to the general market stats and trends, I thought in times like this you'd enjoy something a bit more personalized.
Compass offers its agents many tools.
Among them is something called a collection where our clients can keep track of properties that come on the market.
We find that our buyers and sellers enjoy knowing about the housing market in their immediate area.
Please let me know if you would like a personalized collection of homes within a 10 block radius of your property (or any other search parameters).
Email me at: pota.perimenis@compass.com
requesting a collection.
The collection will automatically update with any new listings that come on the market.
I will send you an invitation to the collection, so that you can take a look if you wish. Within the collection, you can also create your own searches for other areas as well. I hope you find this feature useful!
Stay healthy,
Pota
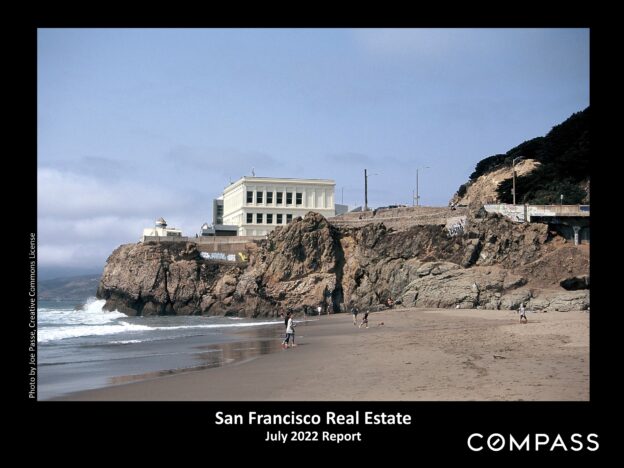
San Francisco Real Estate
House & Condo Market Dynamics
Dramatically Diverge
November 2020 Report
SF house and condo markets have been affected differently by the pandemic. This report attempts a deeper dive into the data across the city and within different city districts.
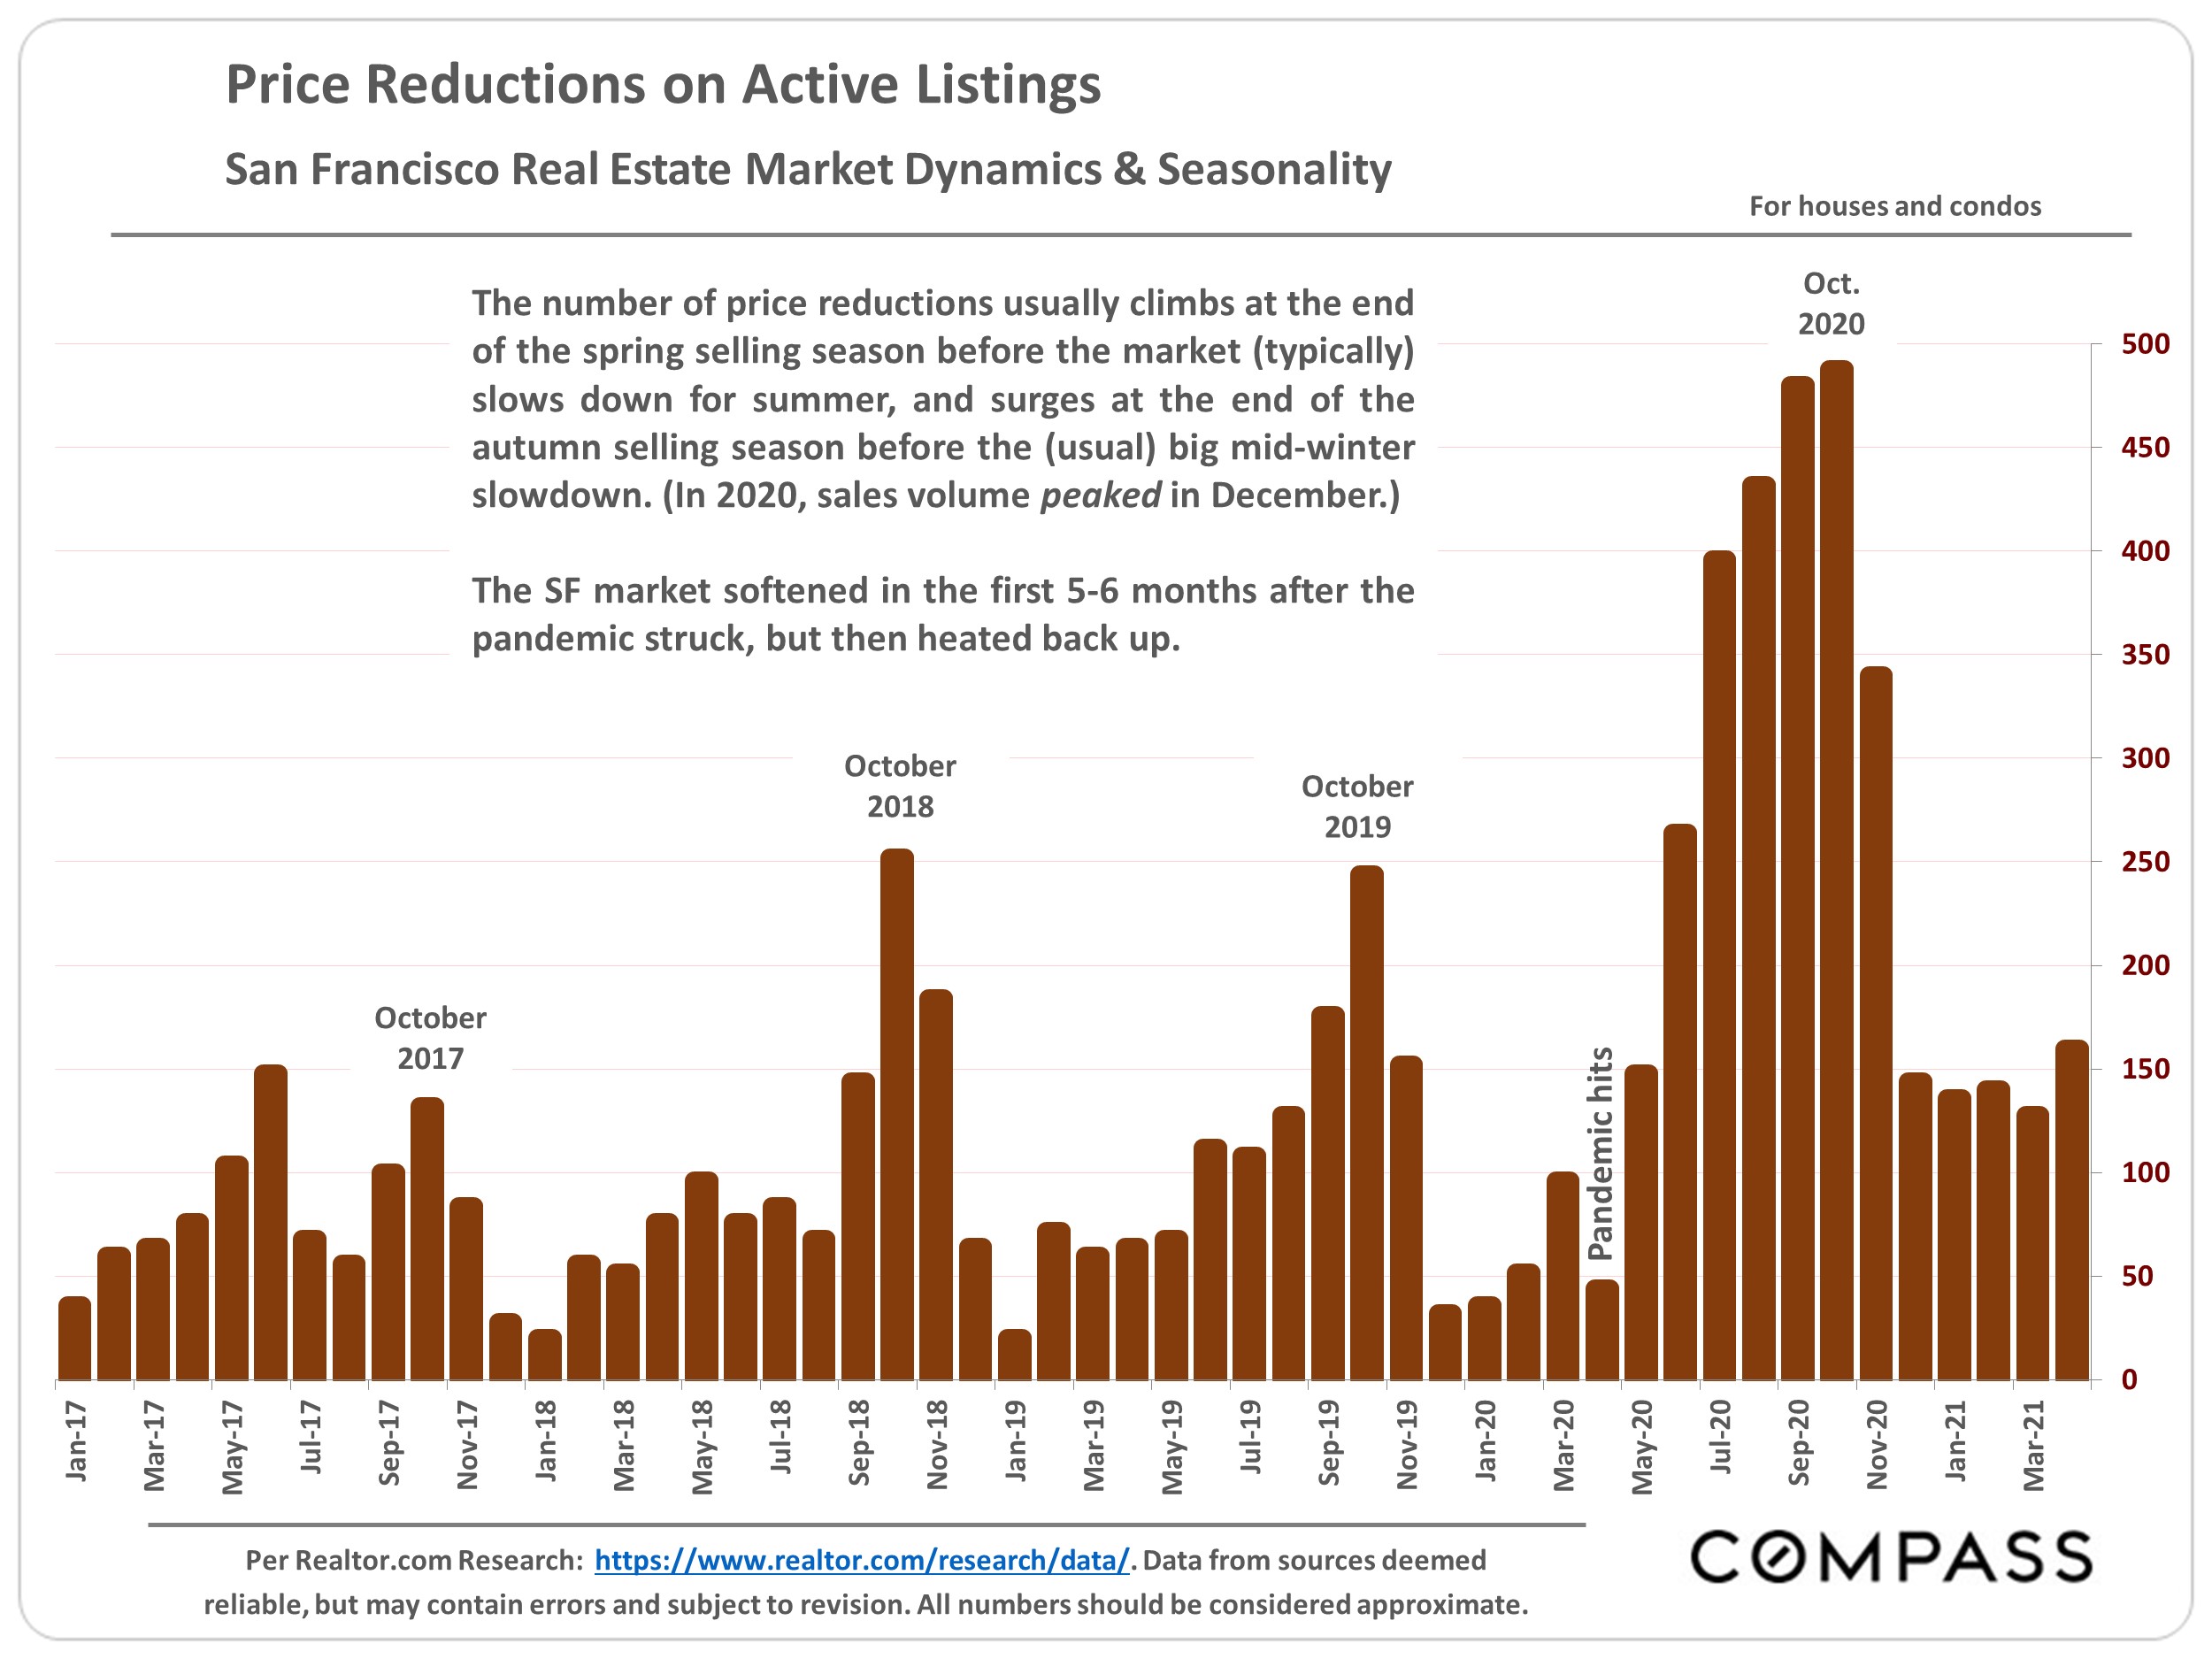
The market typically starts a big slowdown in mid-November, running through the mid-winter holidays, until it begins to wake up in mid-January. High-price segments normally see the most dramatic plunges in mid-winter activity.
This year, the pandemic upended seasonality: Spring, usually the strongest selling season, saw a crash in activity; summer, which typically slows down – especially for luxury home sales – saw high demand; and the summer market accelerated into autumn. But supply has been accelerating even faster than demand.
We suspect late Q4 will see something of a slowdown, but remain more active than in past years.
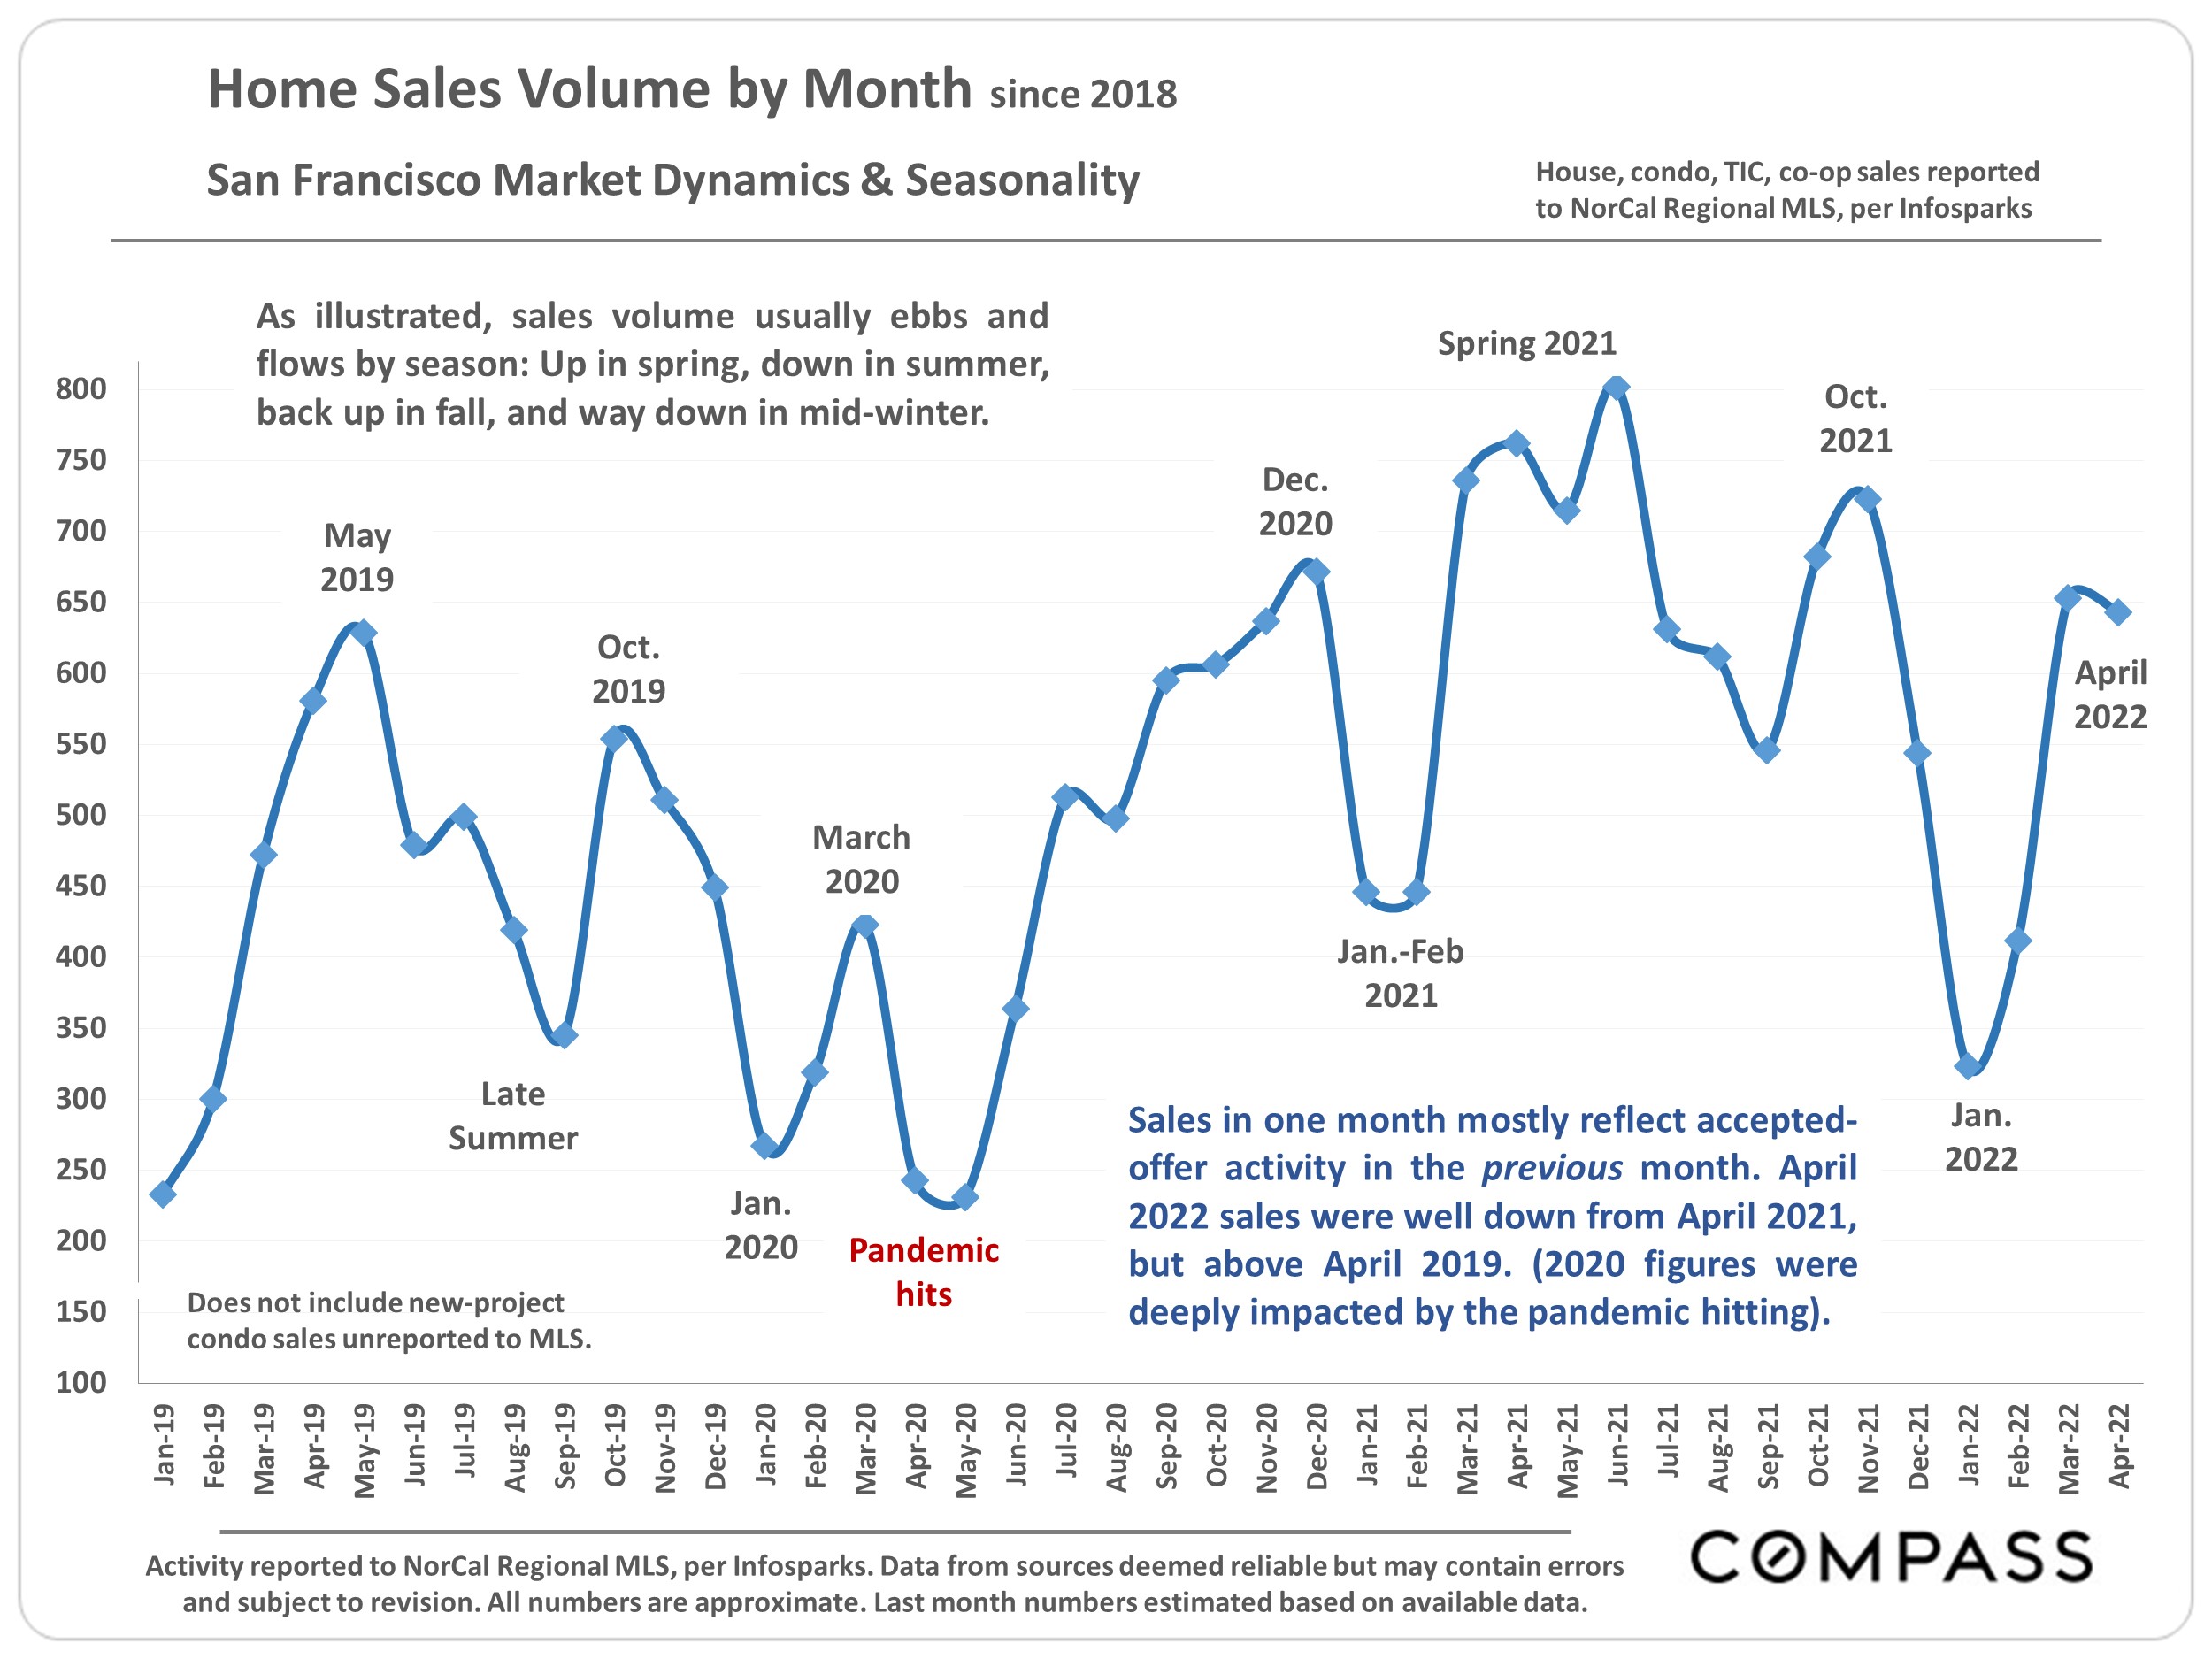
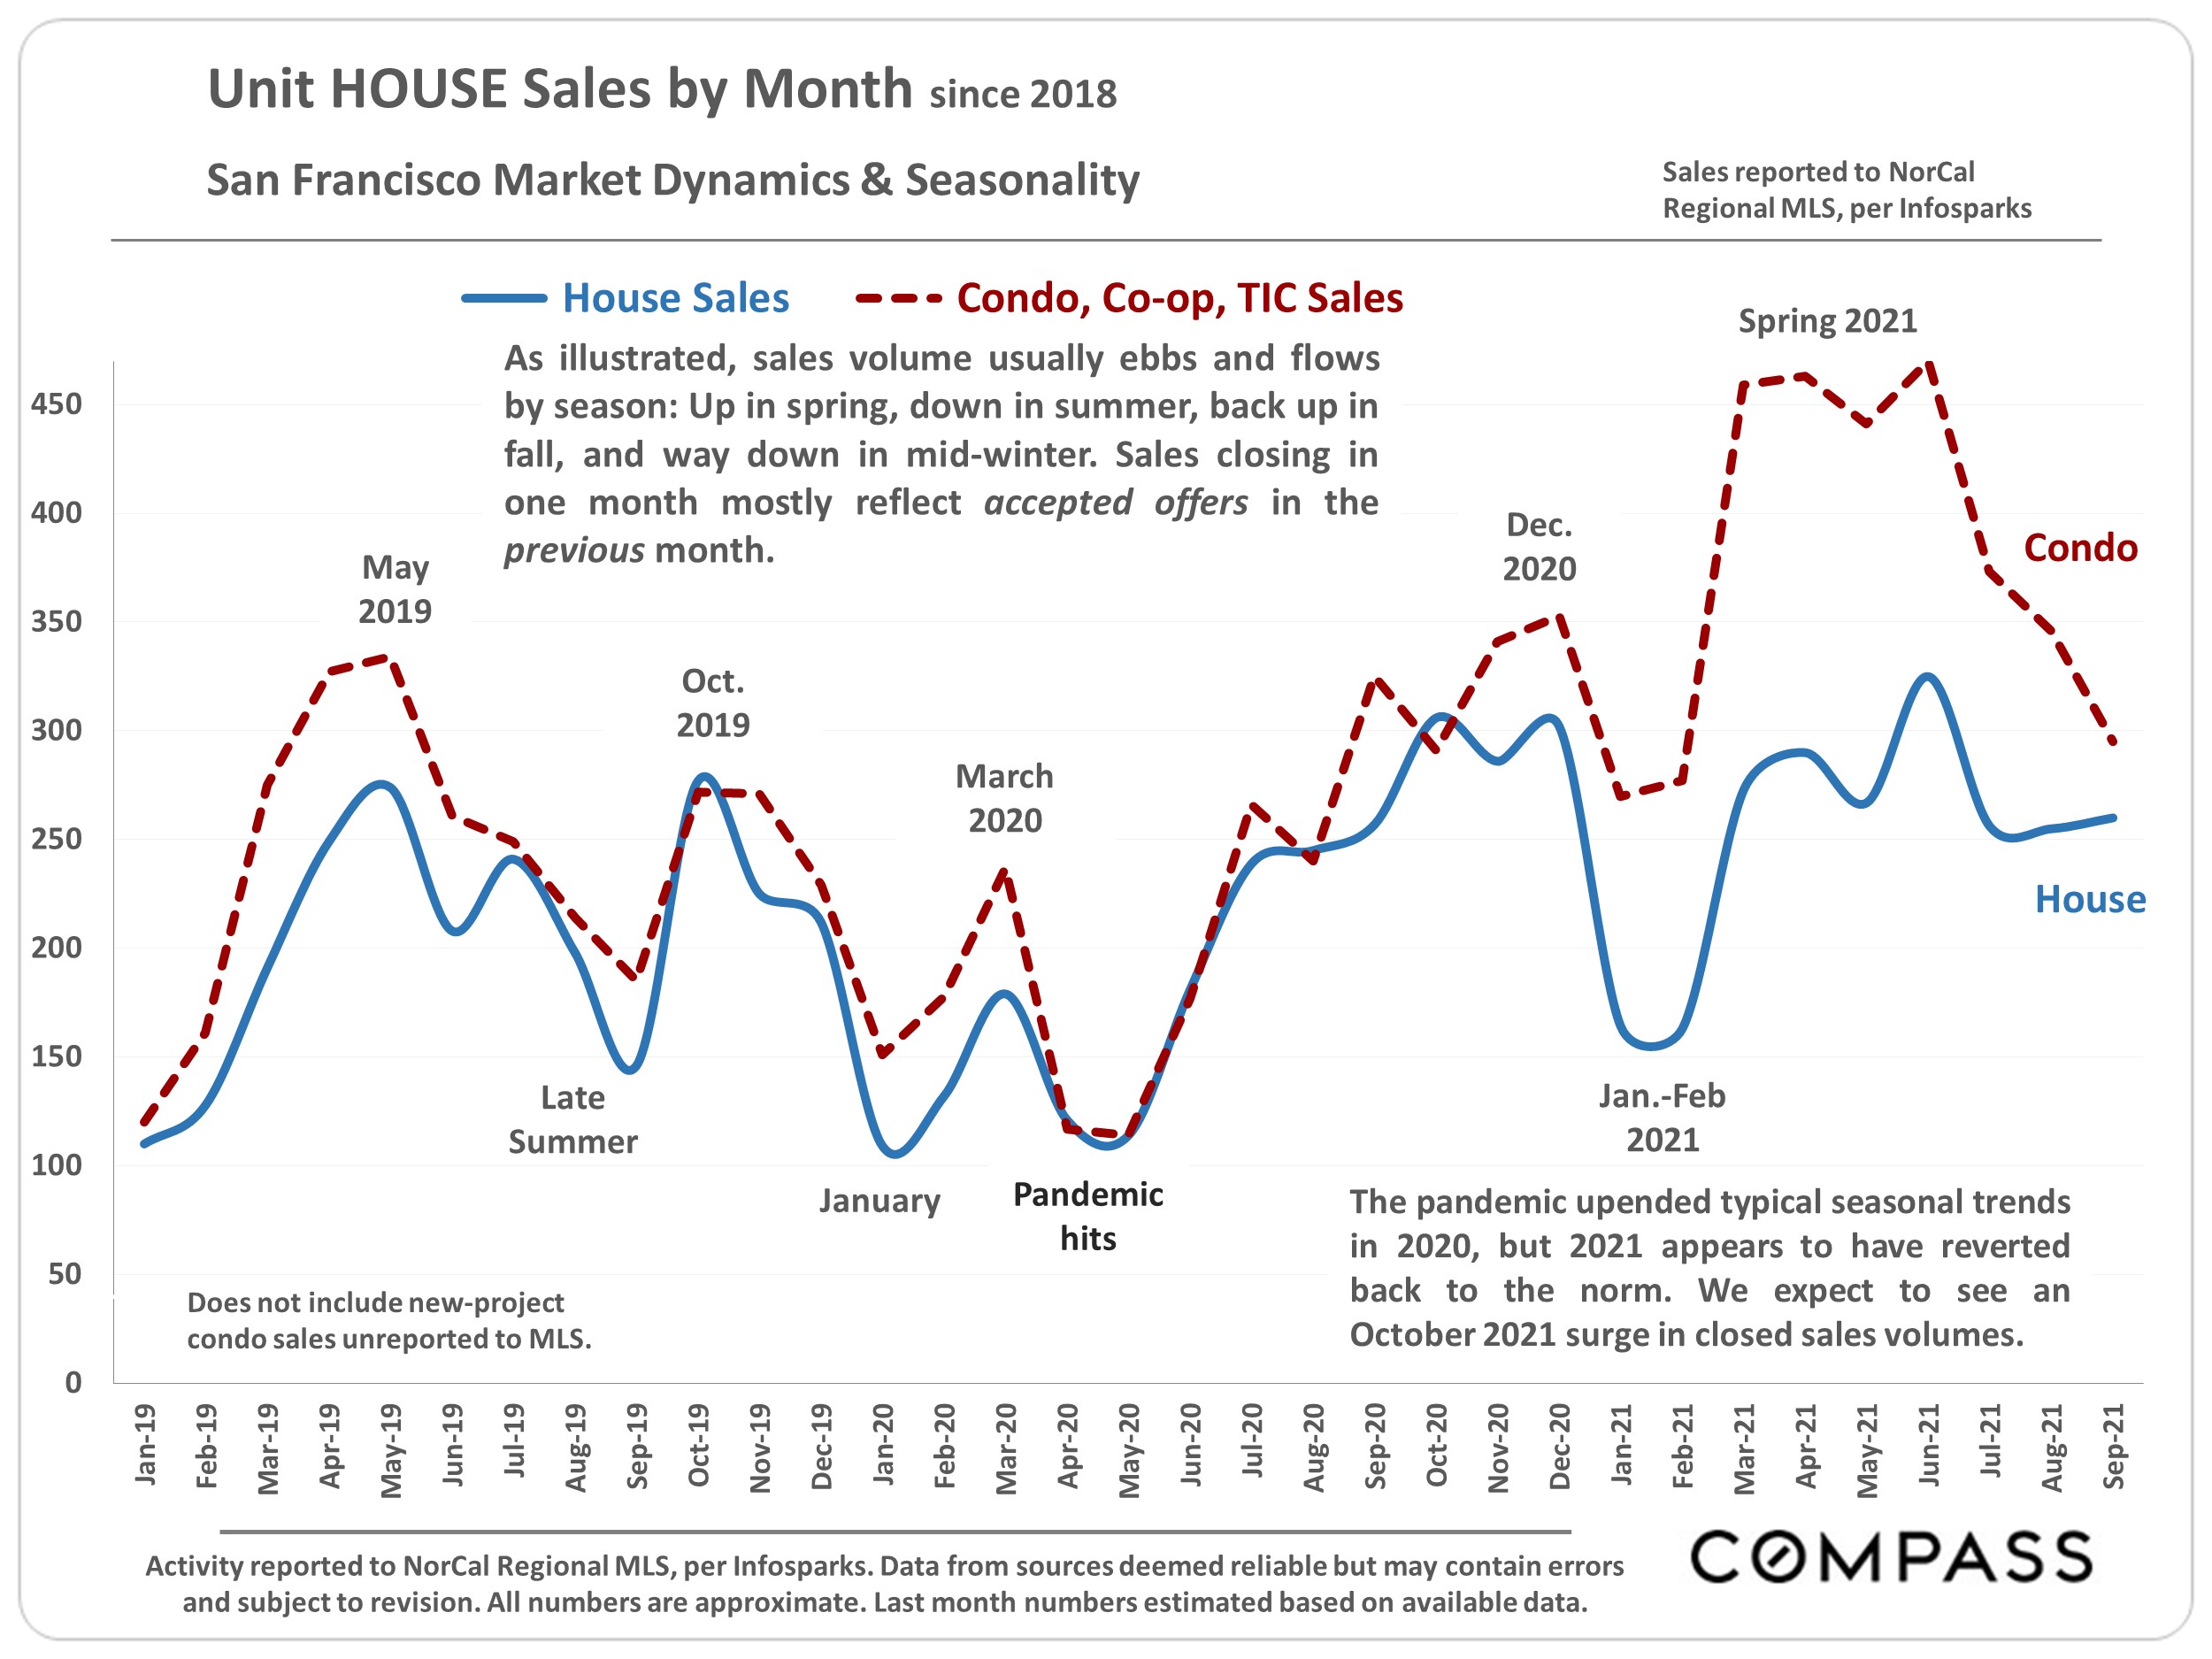
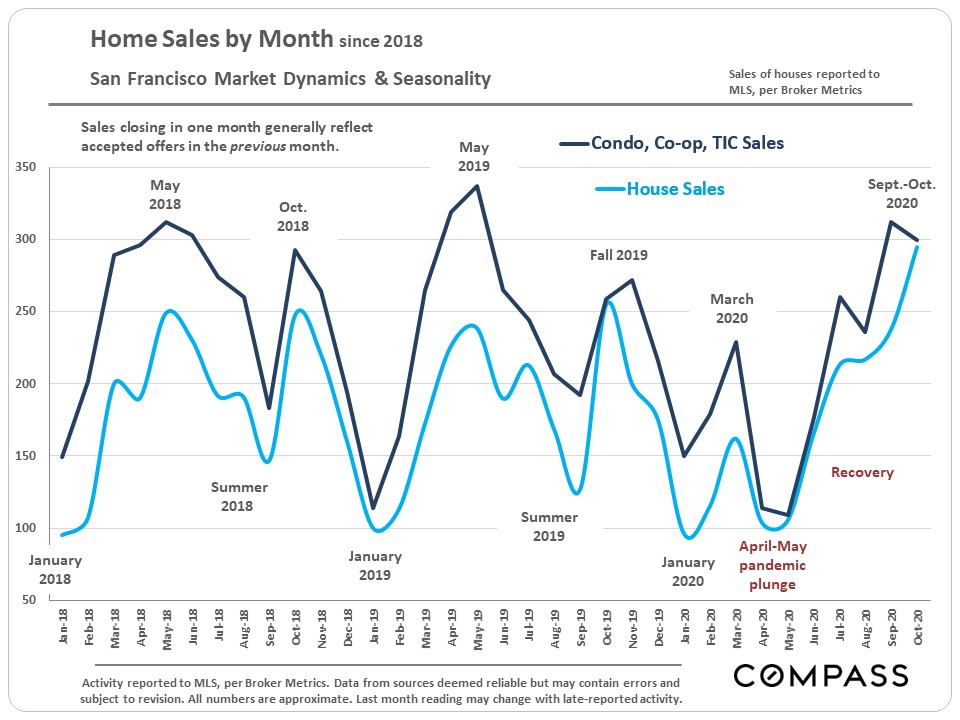
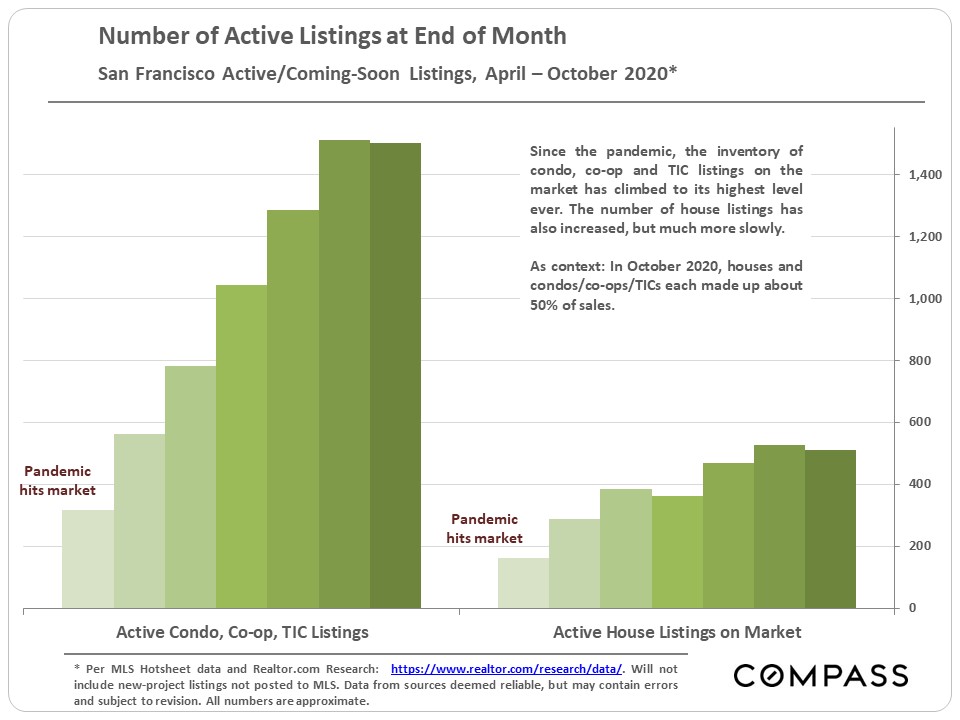
Sales rebounded strongly from the early-spring pandemic crash: House sales are higher than in recent years and condo, co-op and TIC sales are at levels comparable to peak sales volumes over that period.
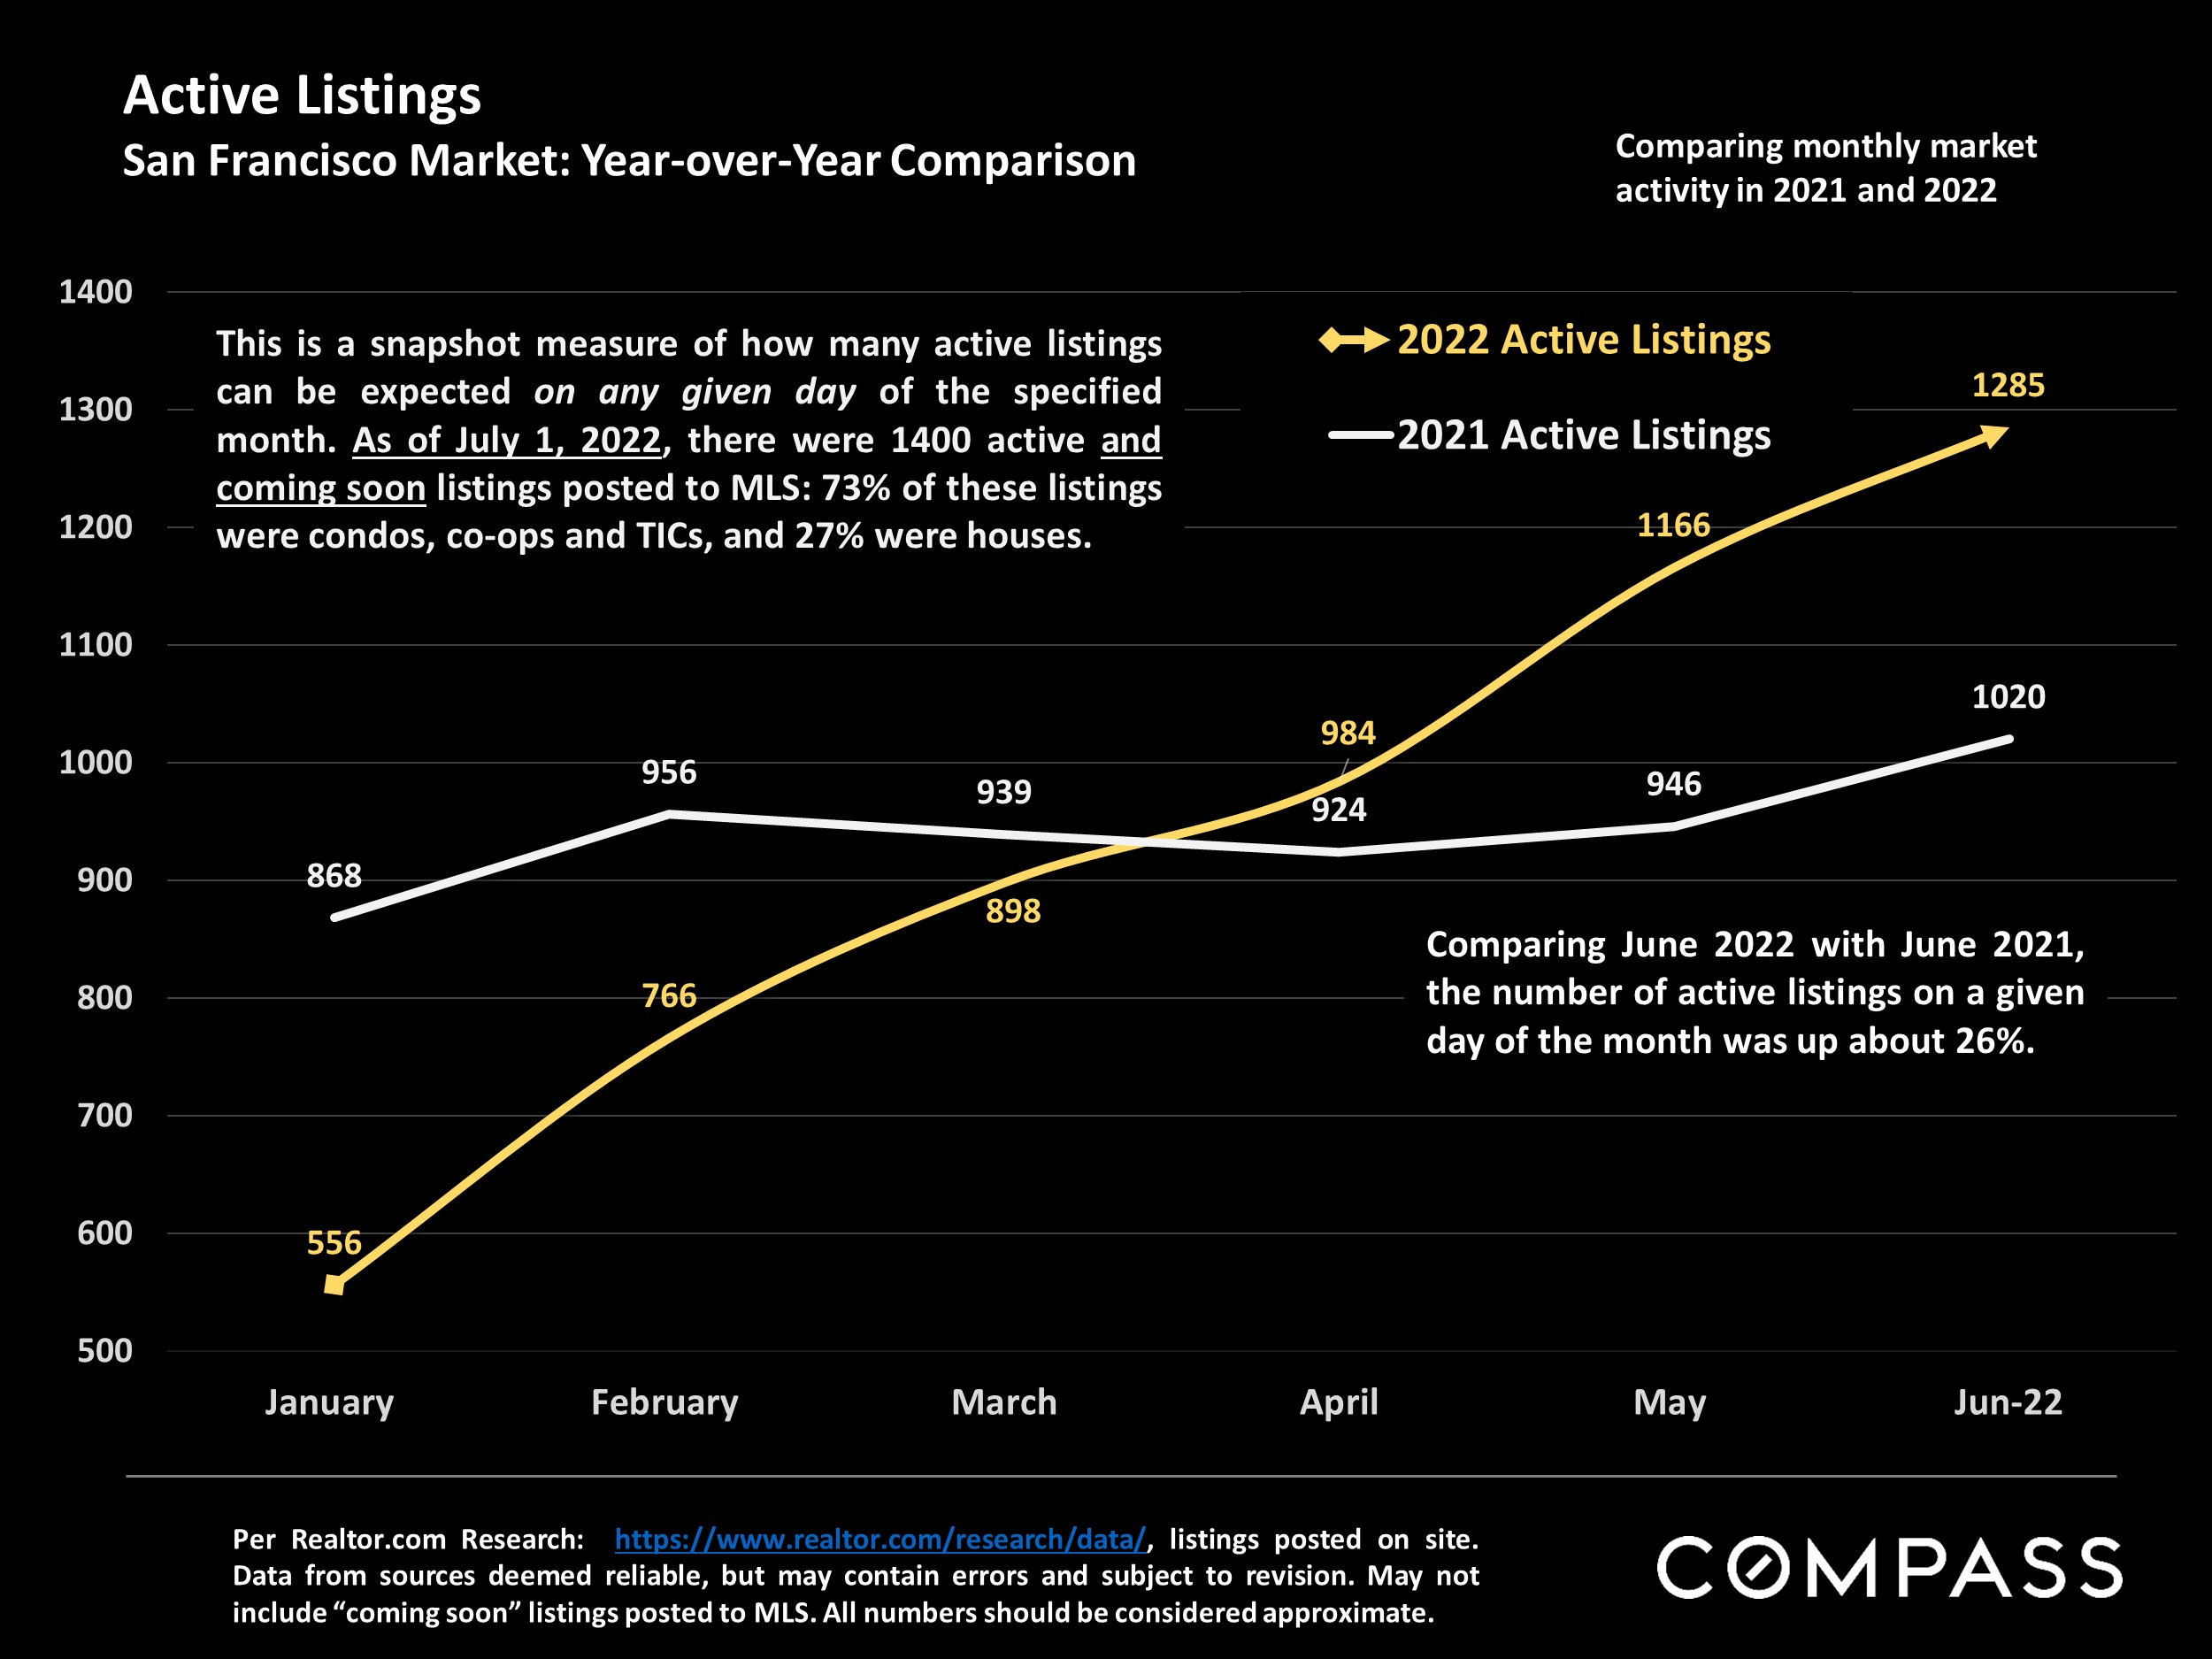
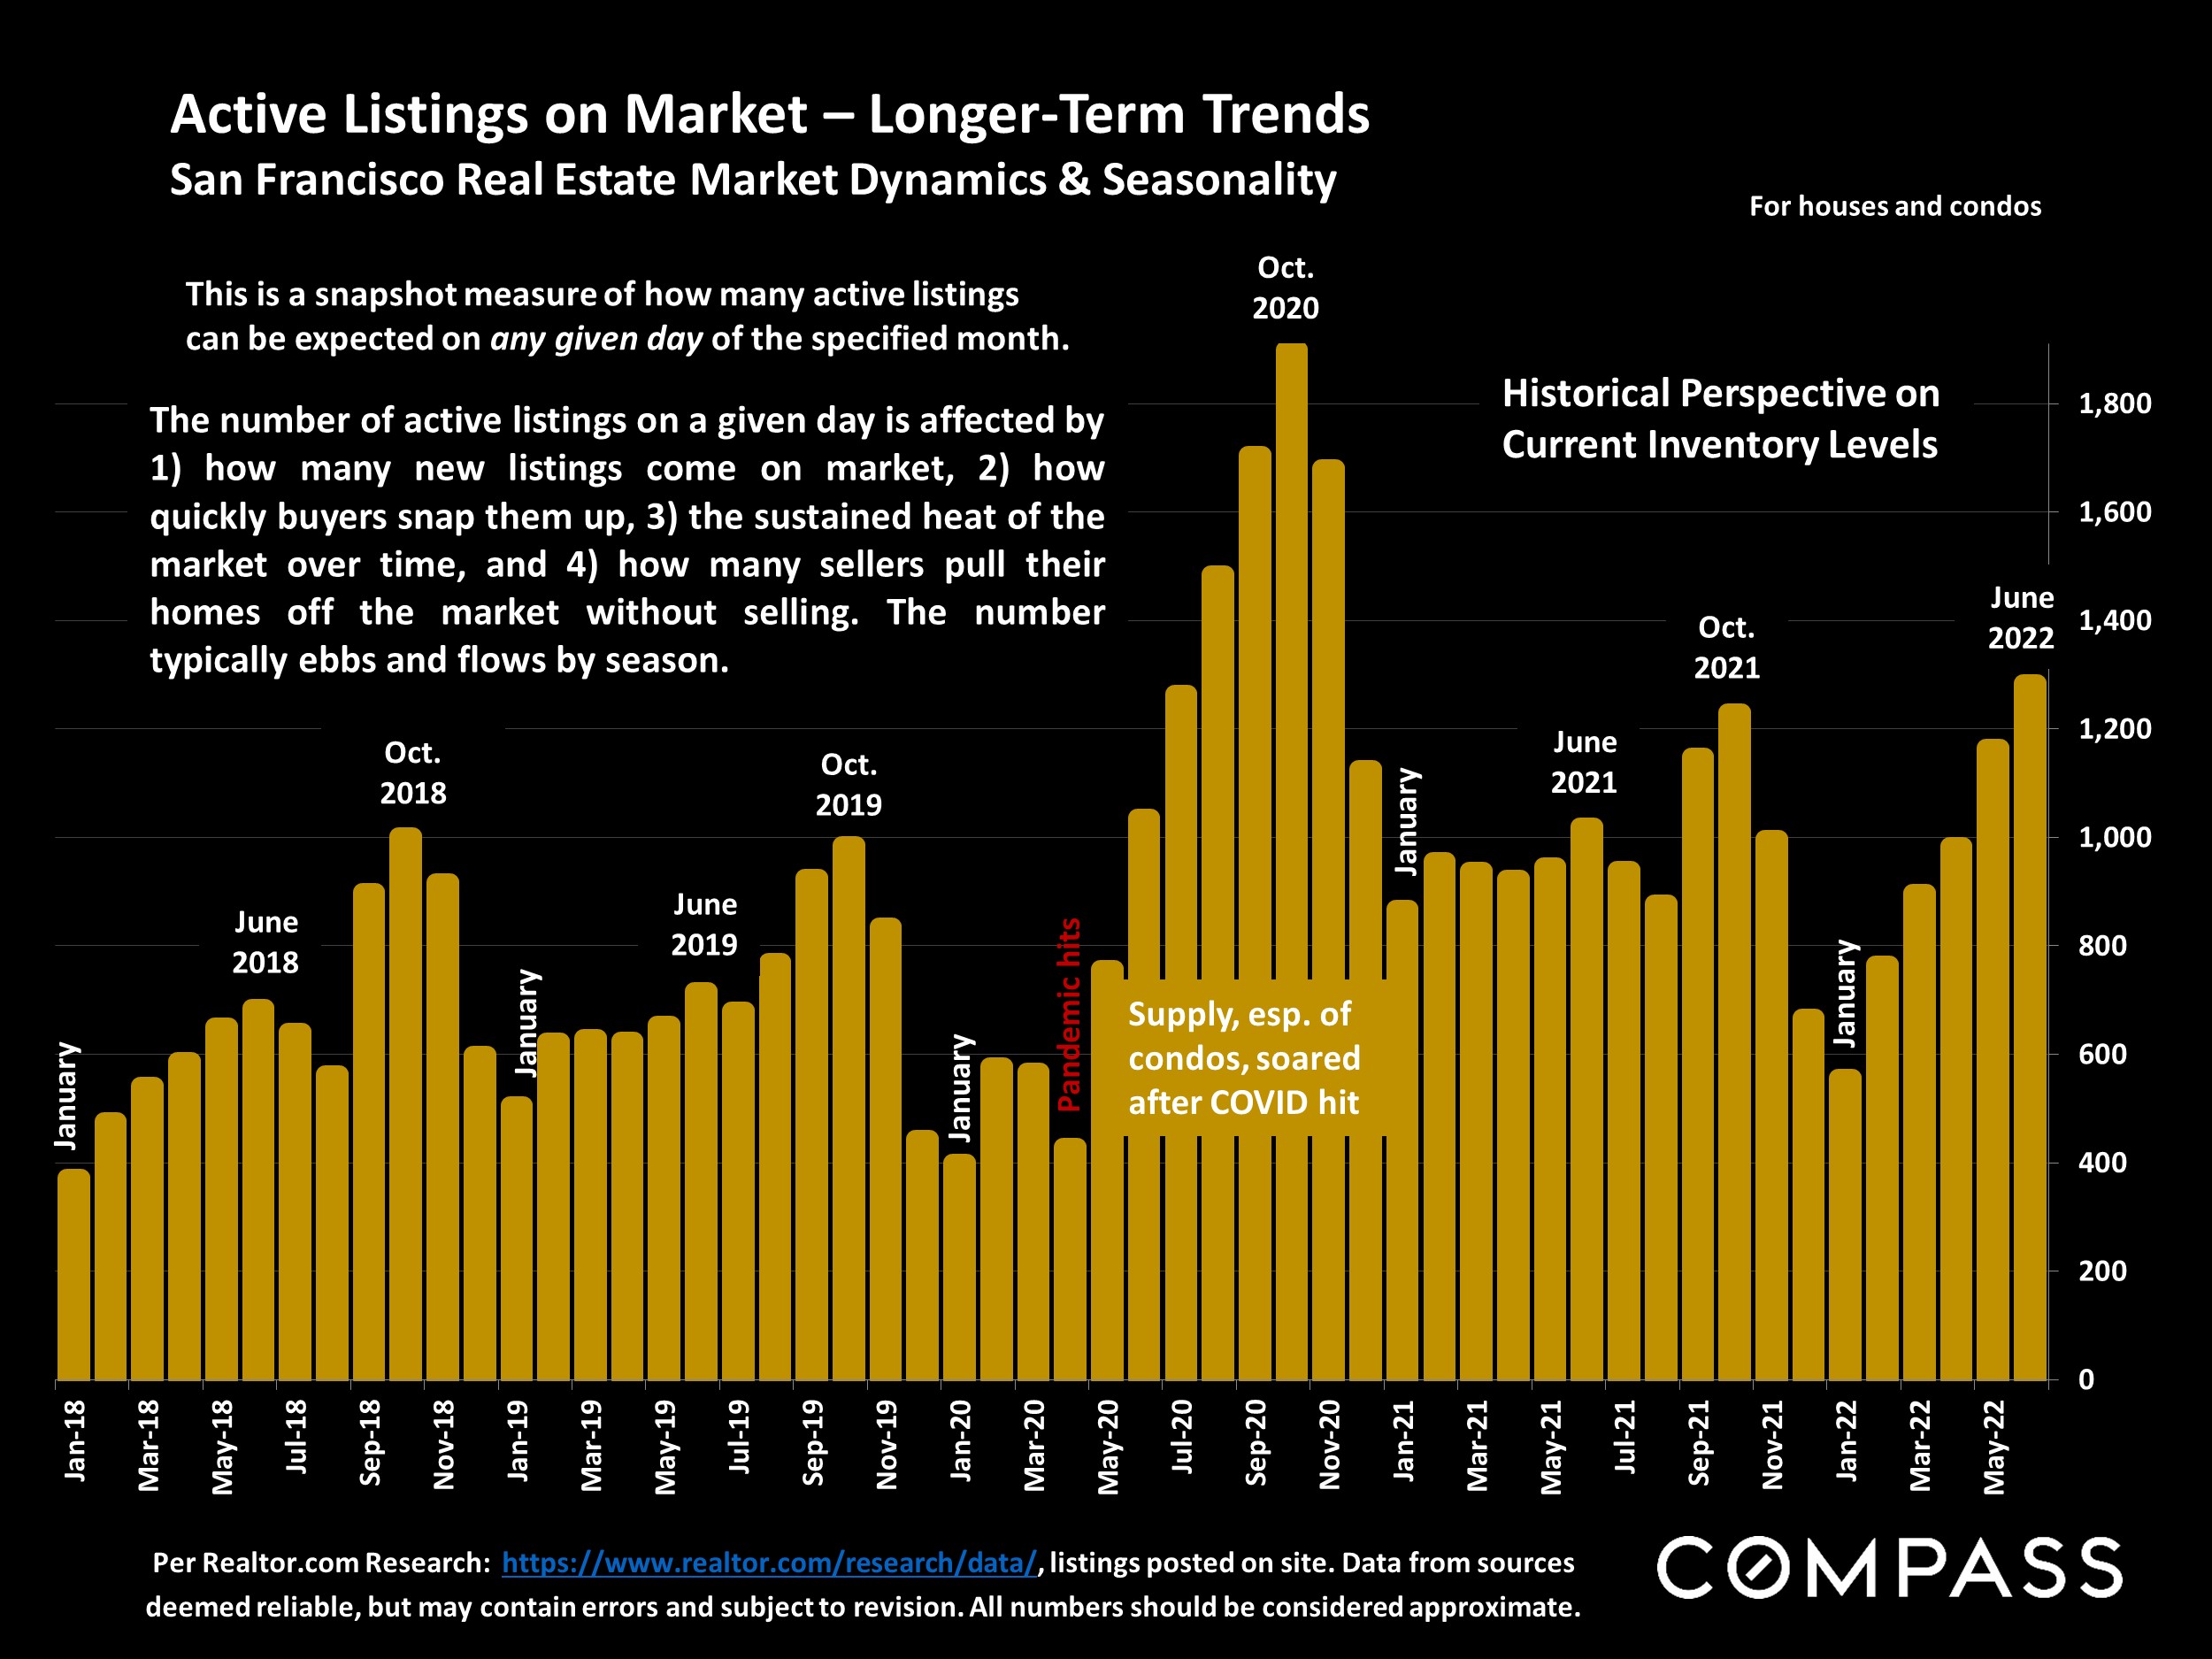
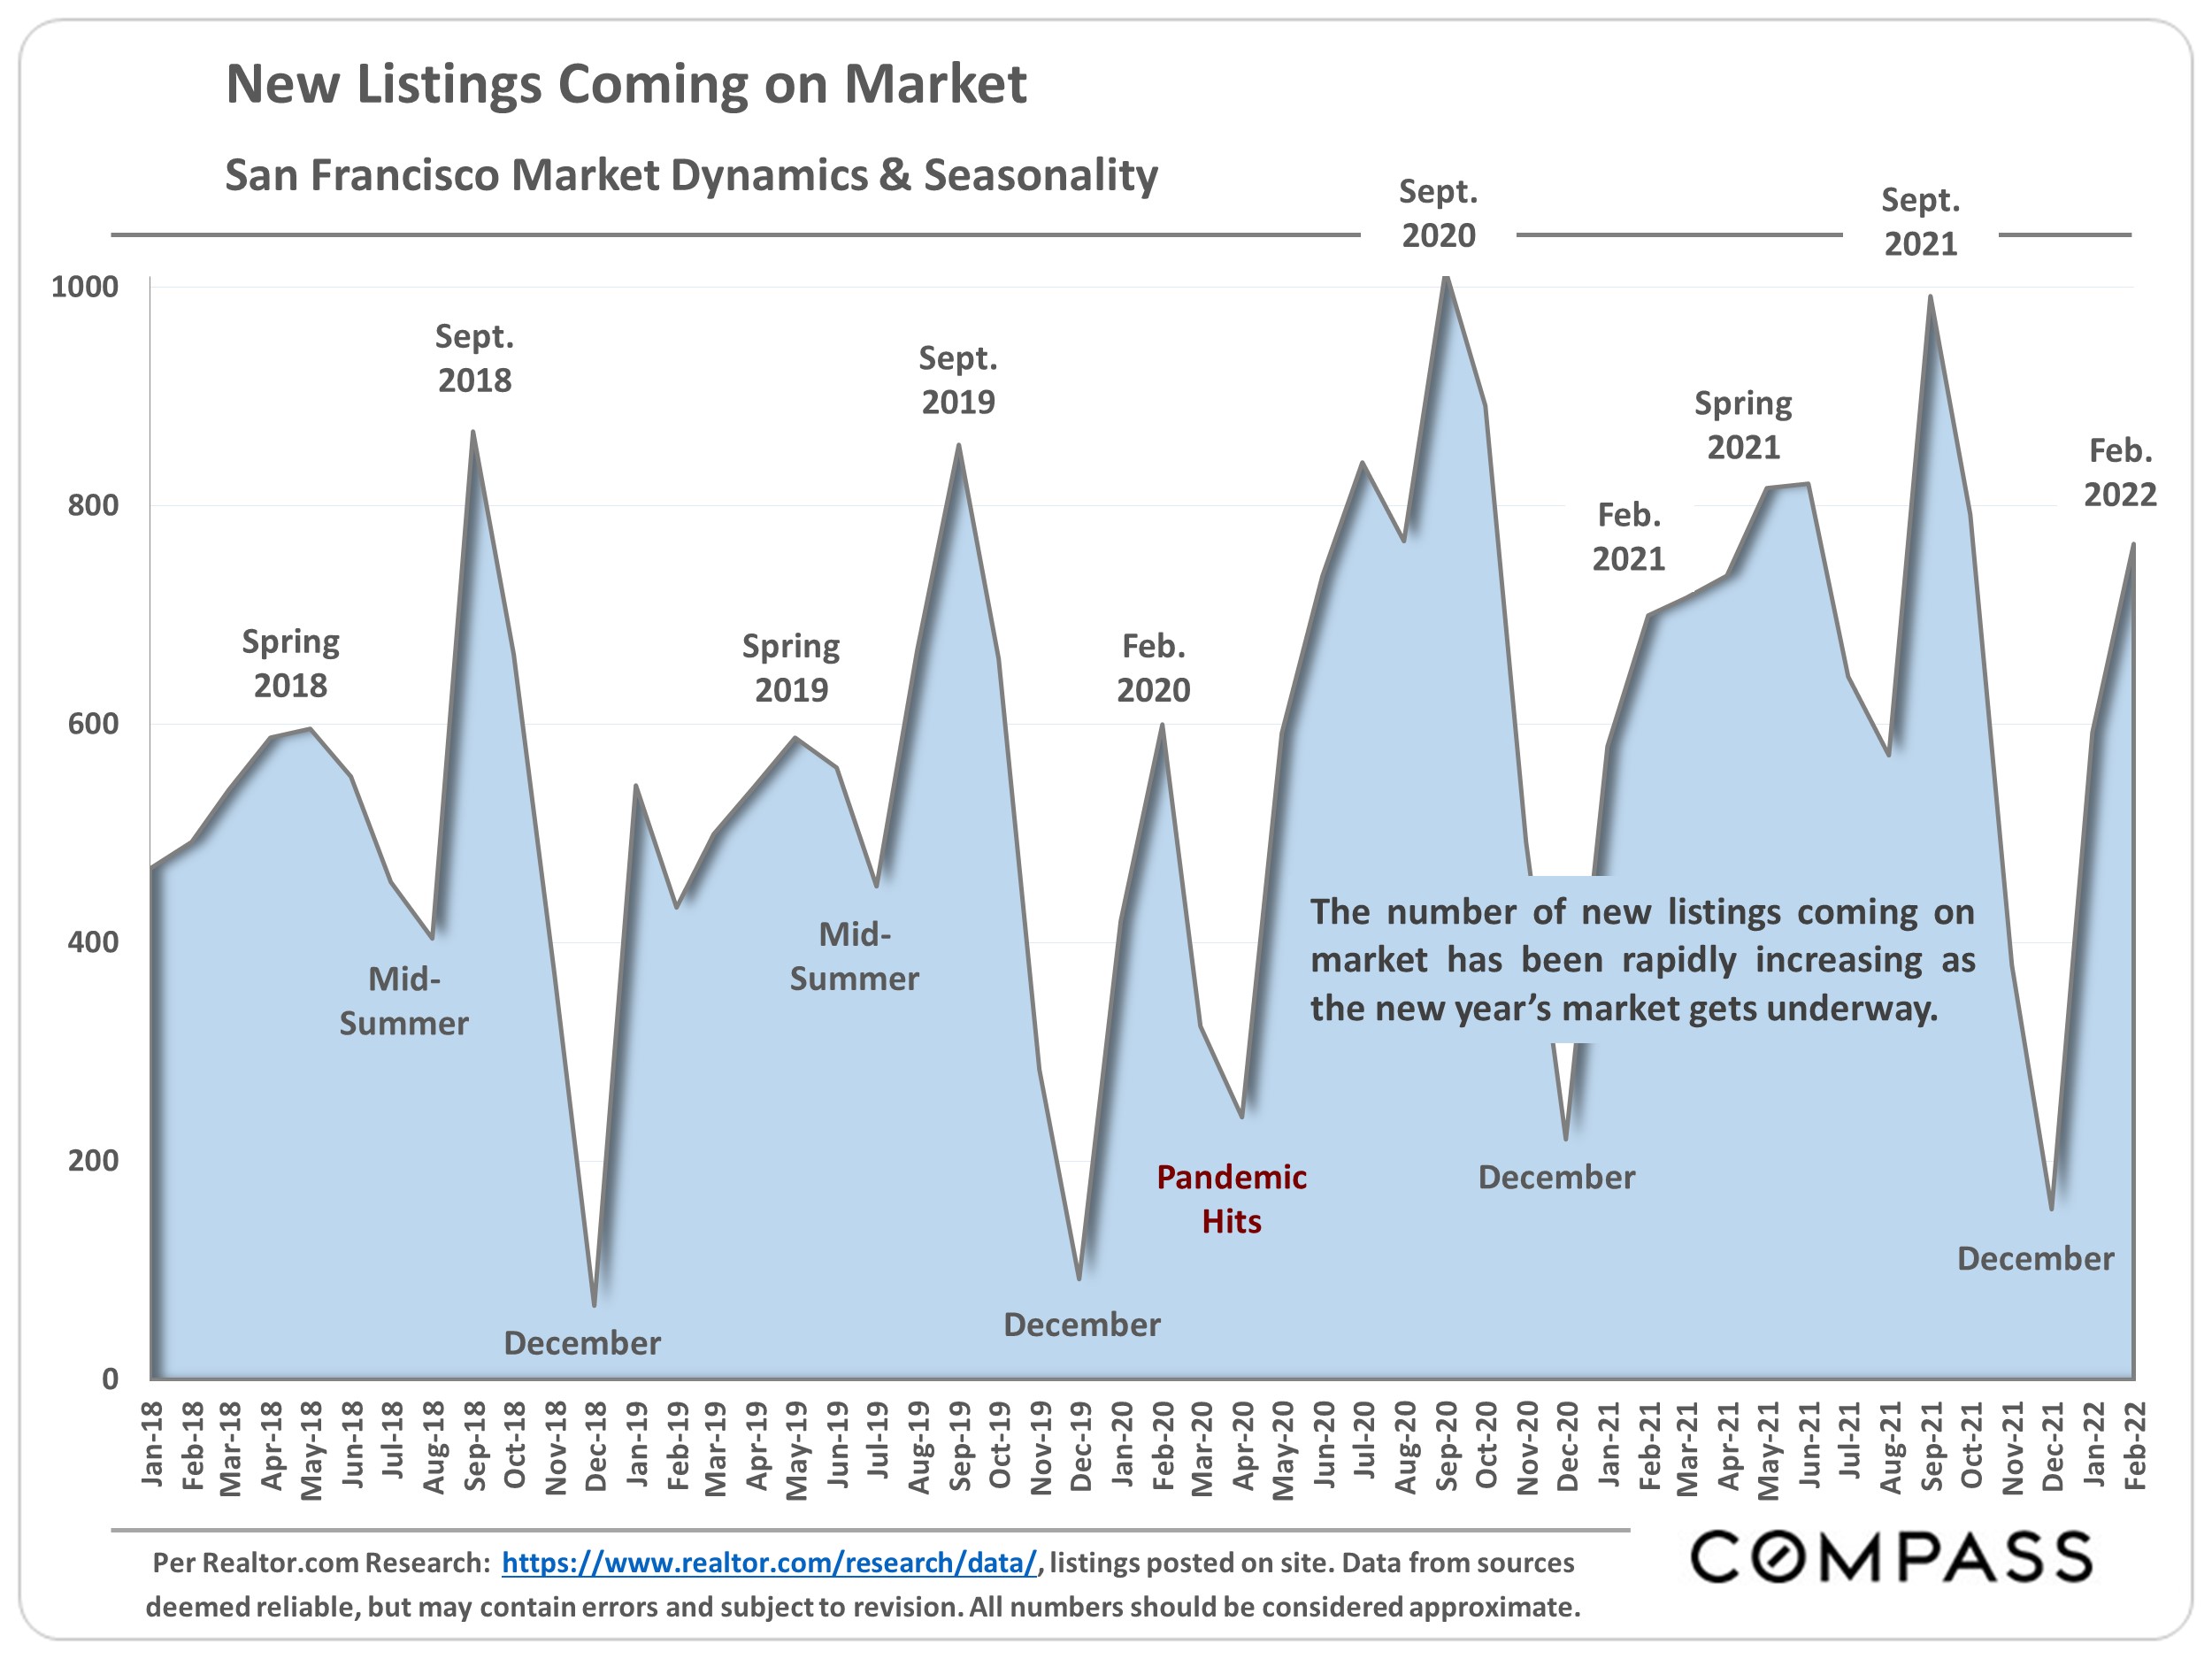
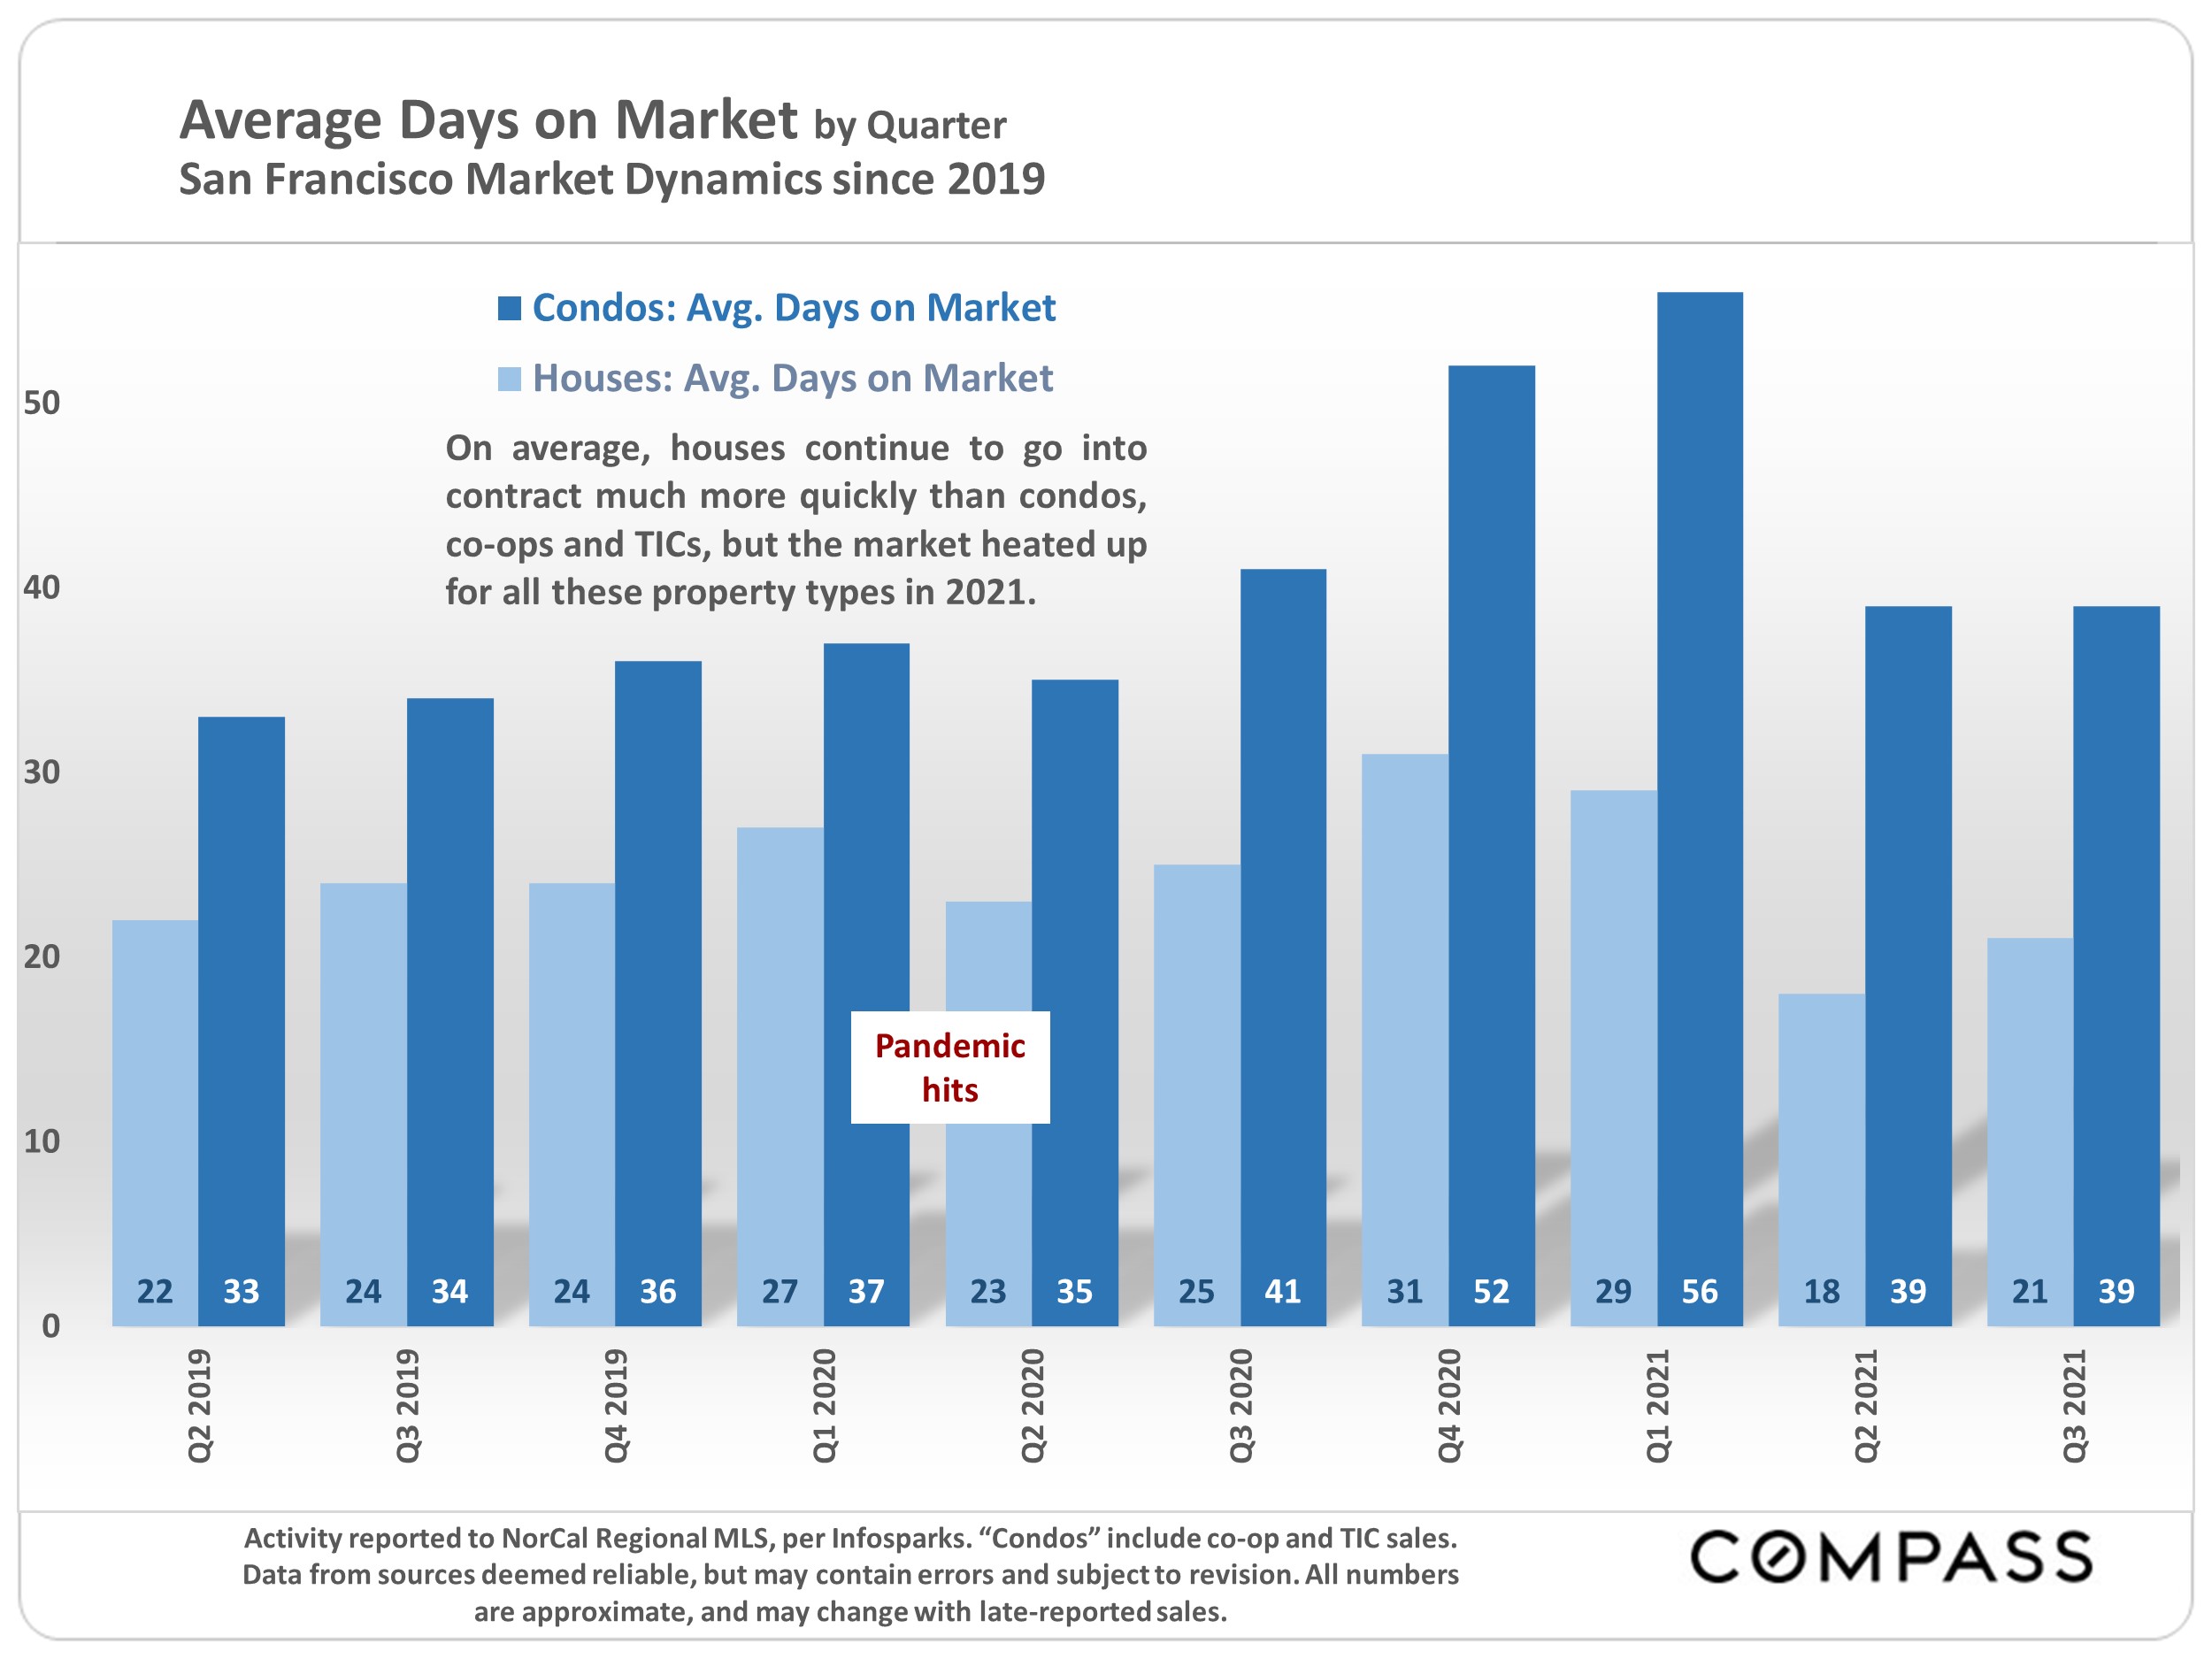
The most dramatic change is the increase in the number of listings for sale. Condo, co-op and TIC listings in MLS are at their highest point ever, approximately 85% higher than one year ago. House listings are also up, but much less dramatically, running about 20% to 25% higher than in autumn 2019.
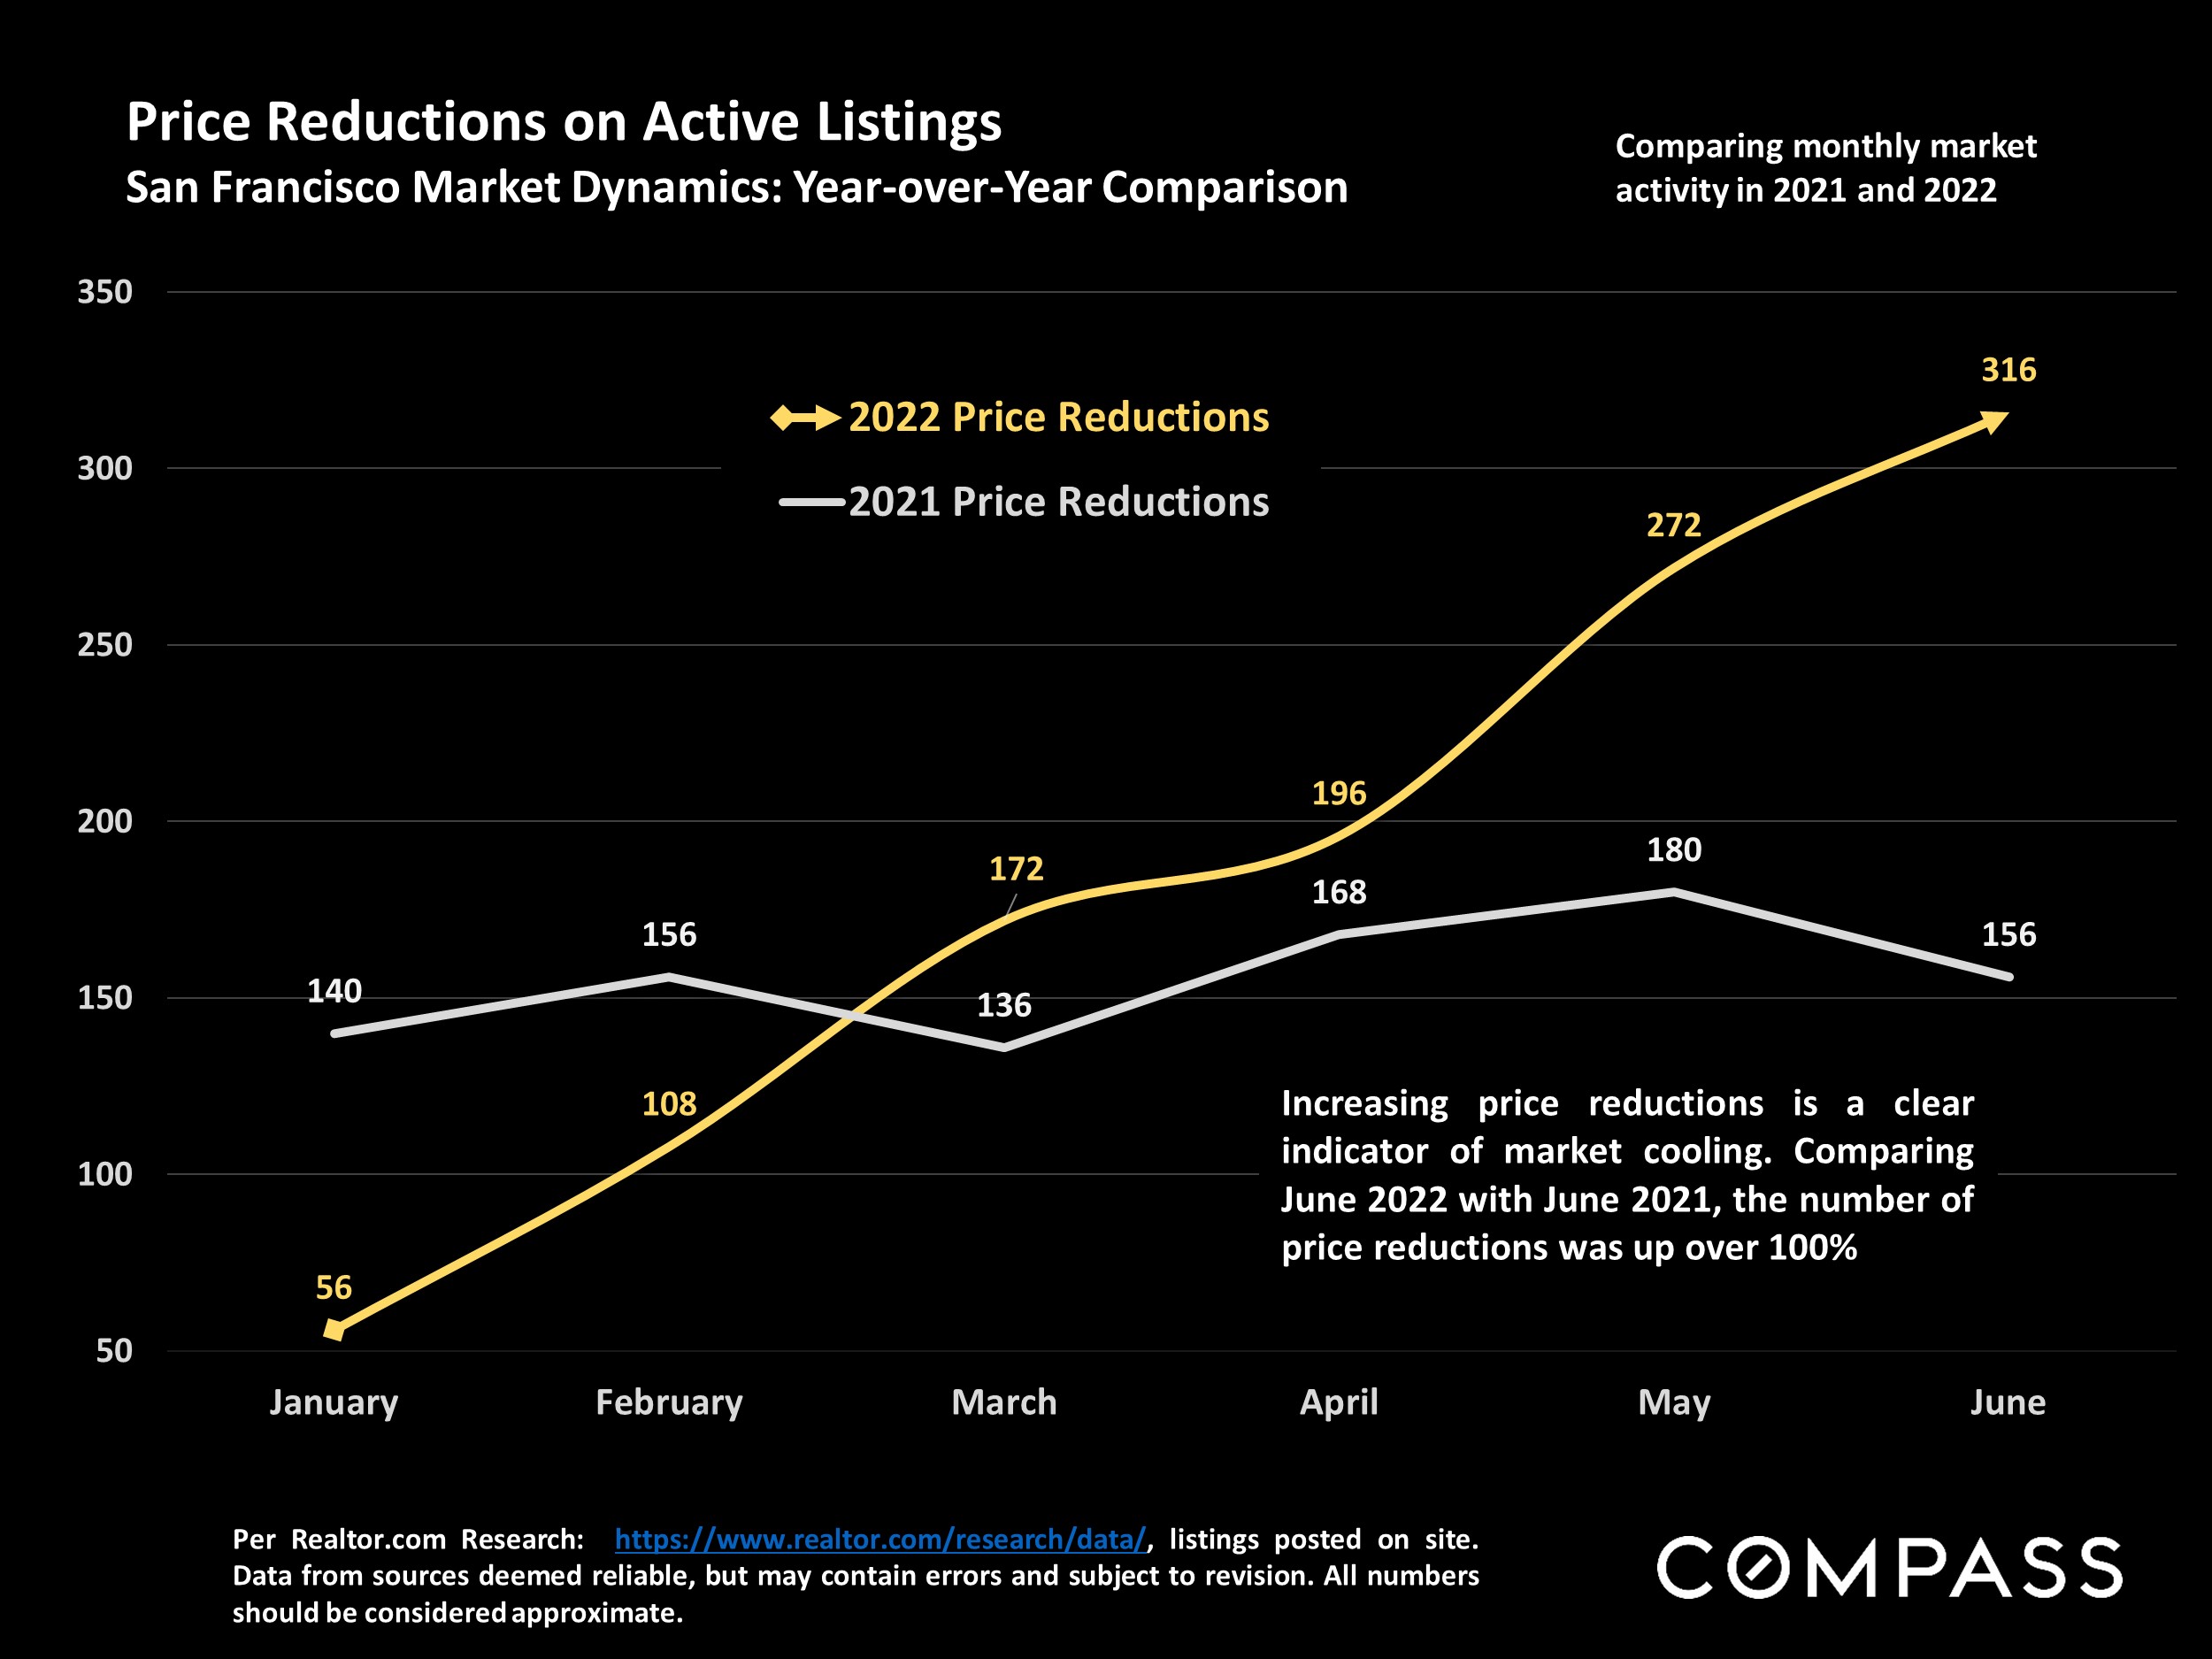
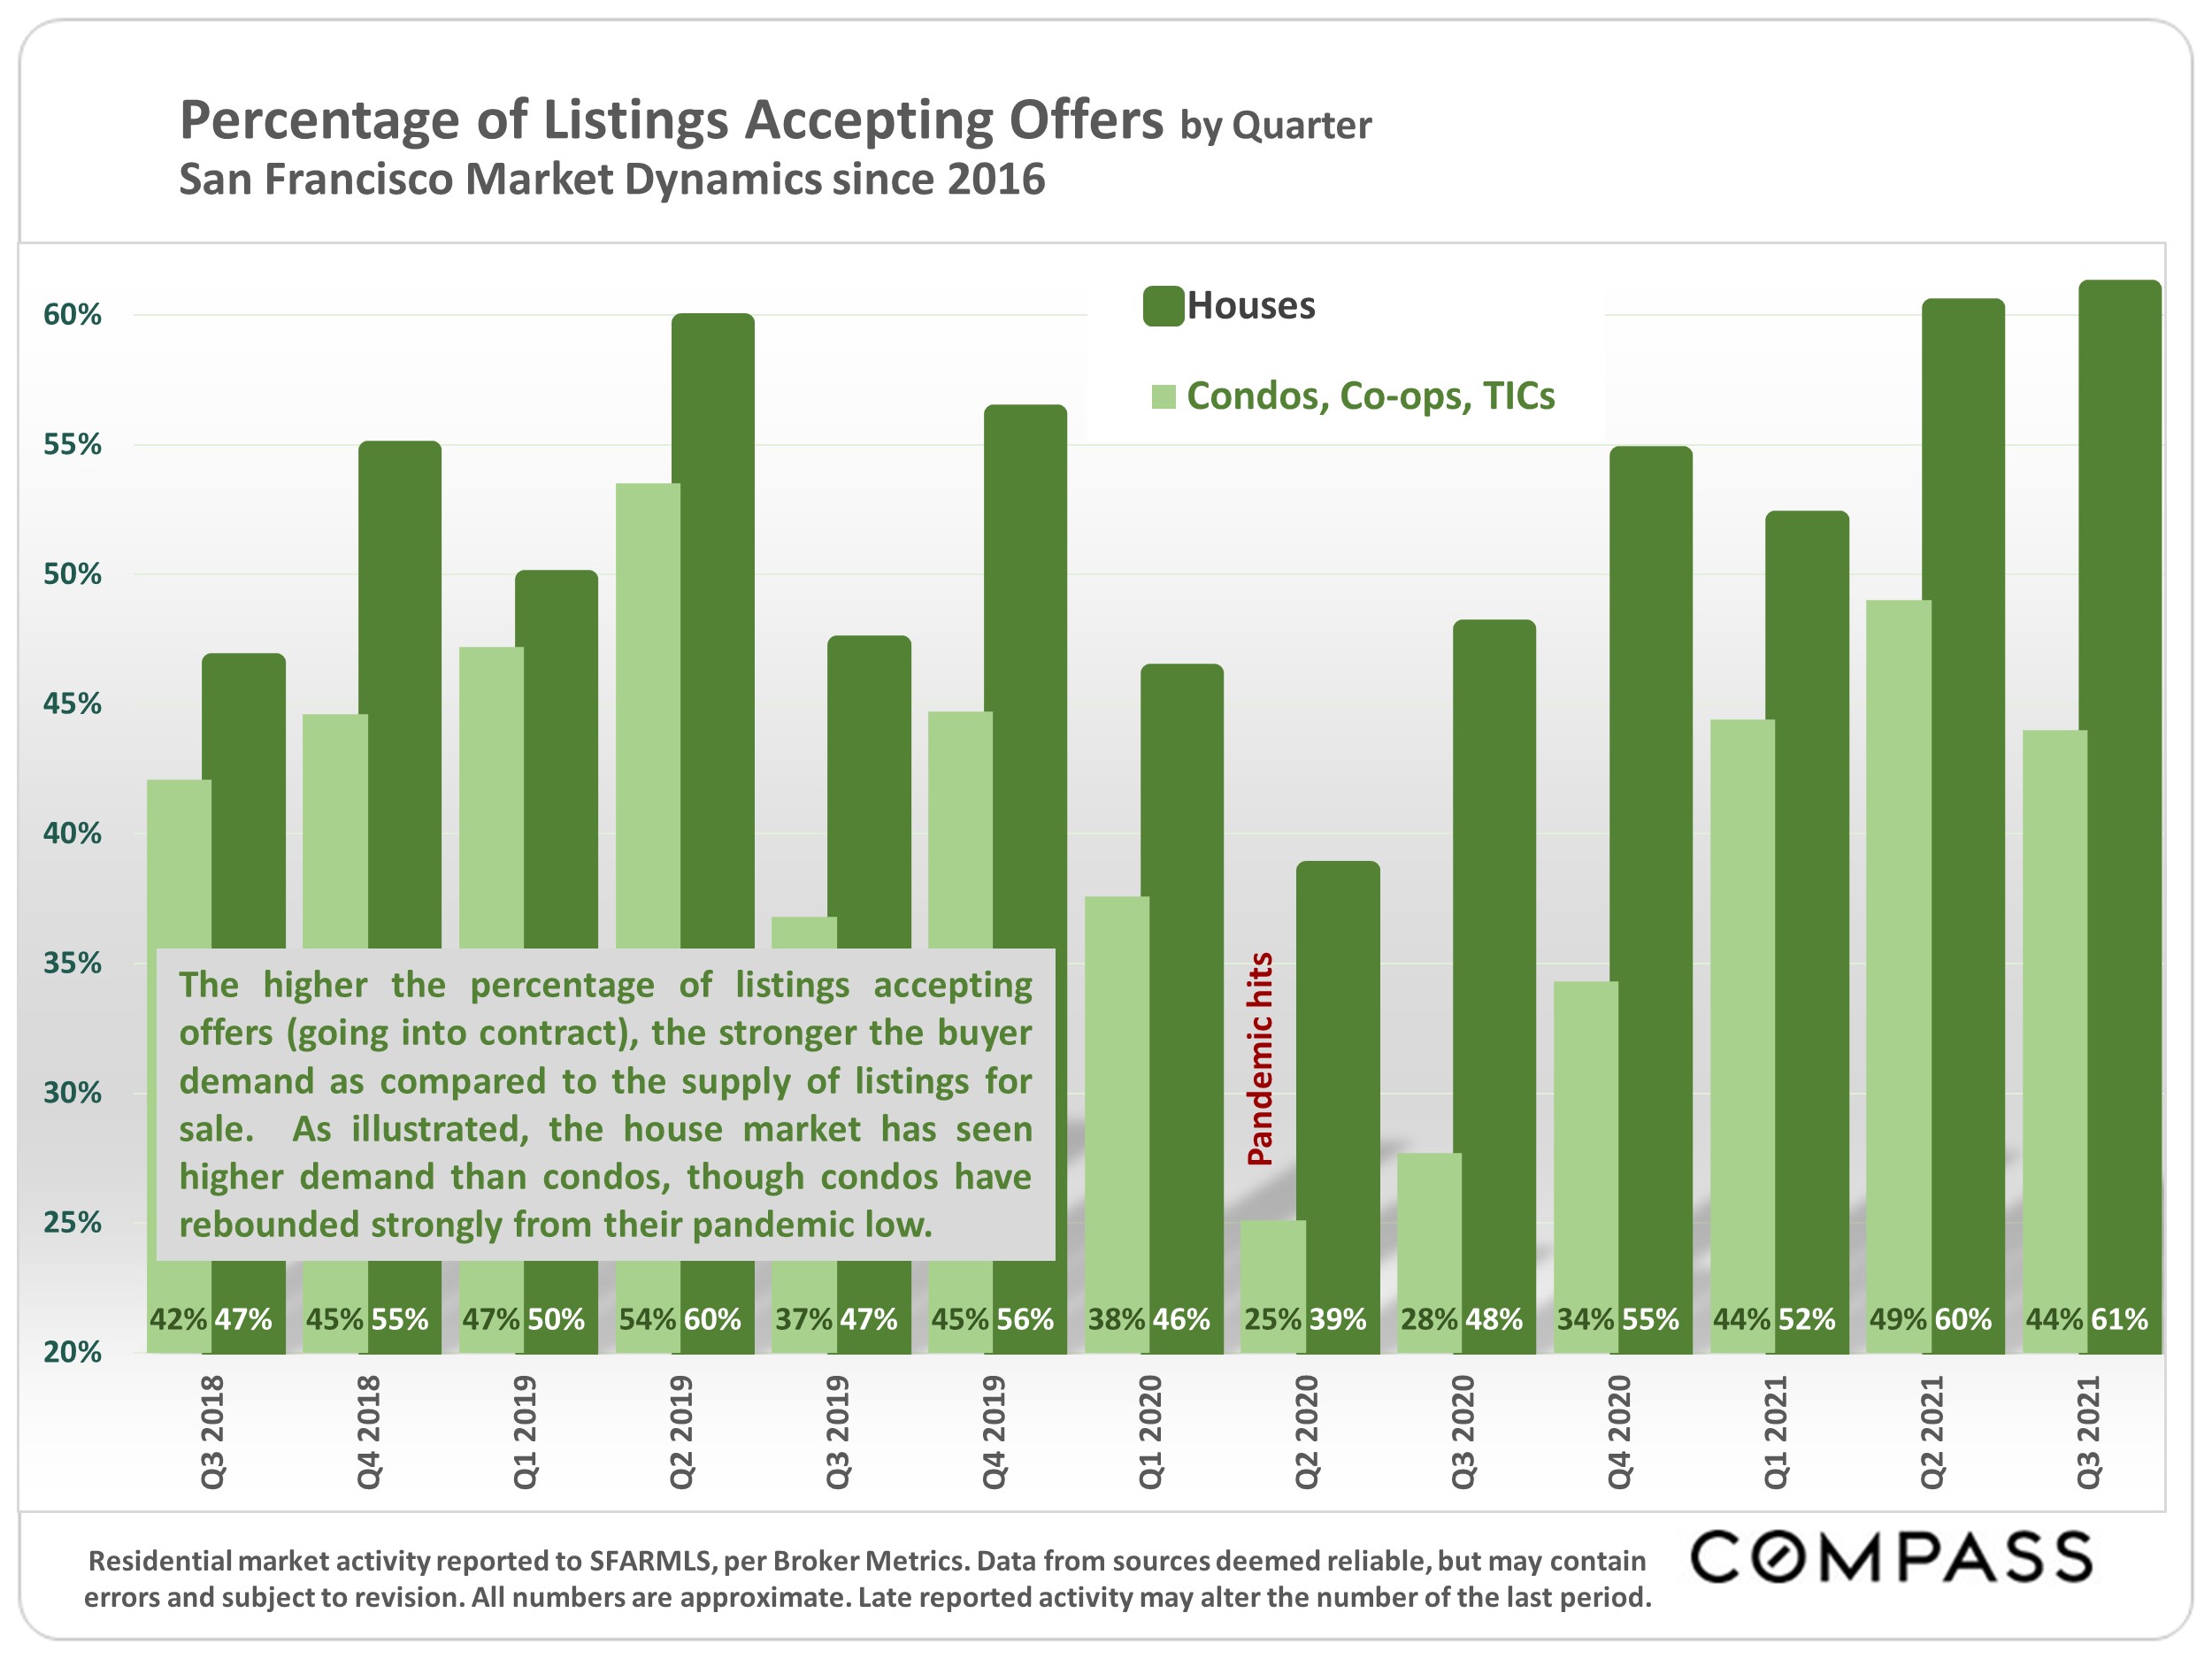
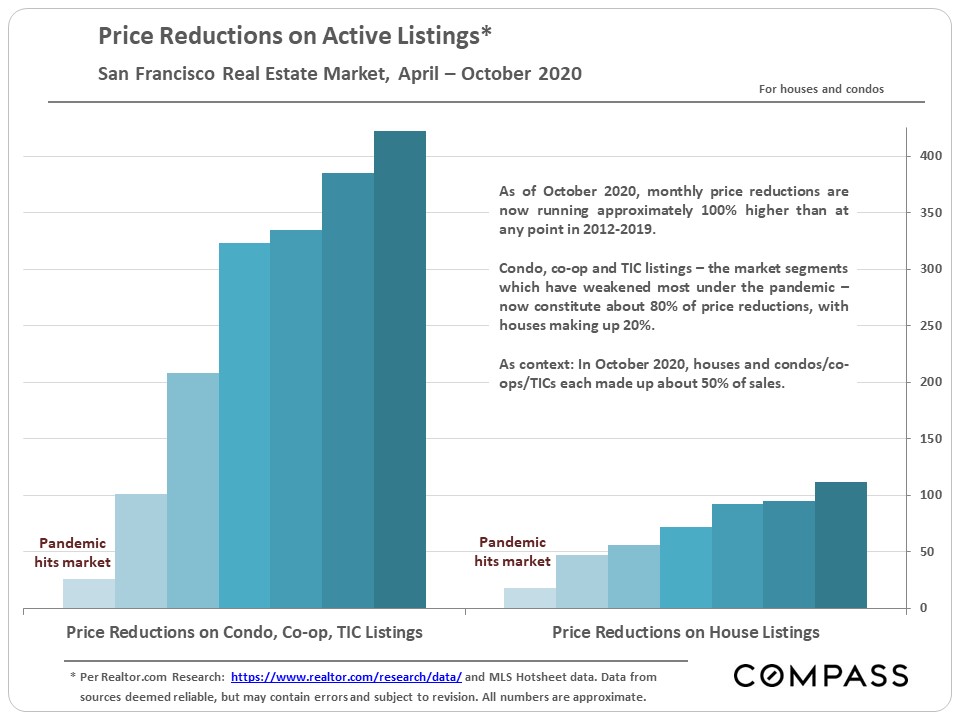
Steady demand but soaring inventory has led to an increase in price reductions. When demand outweighs supply, buyers compete for listings, usually by overbidding. When supply outweighs demand, sellers often compete for buyers through price reductions. The condo market is probably seeing its highest number of reductions in history.
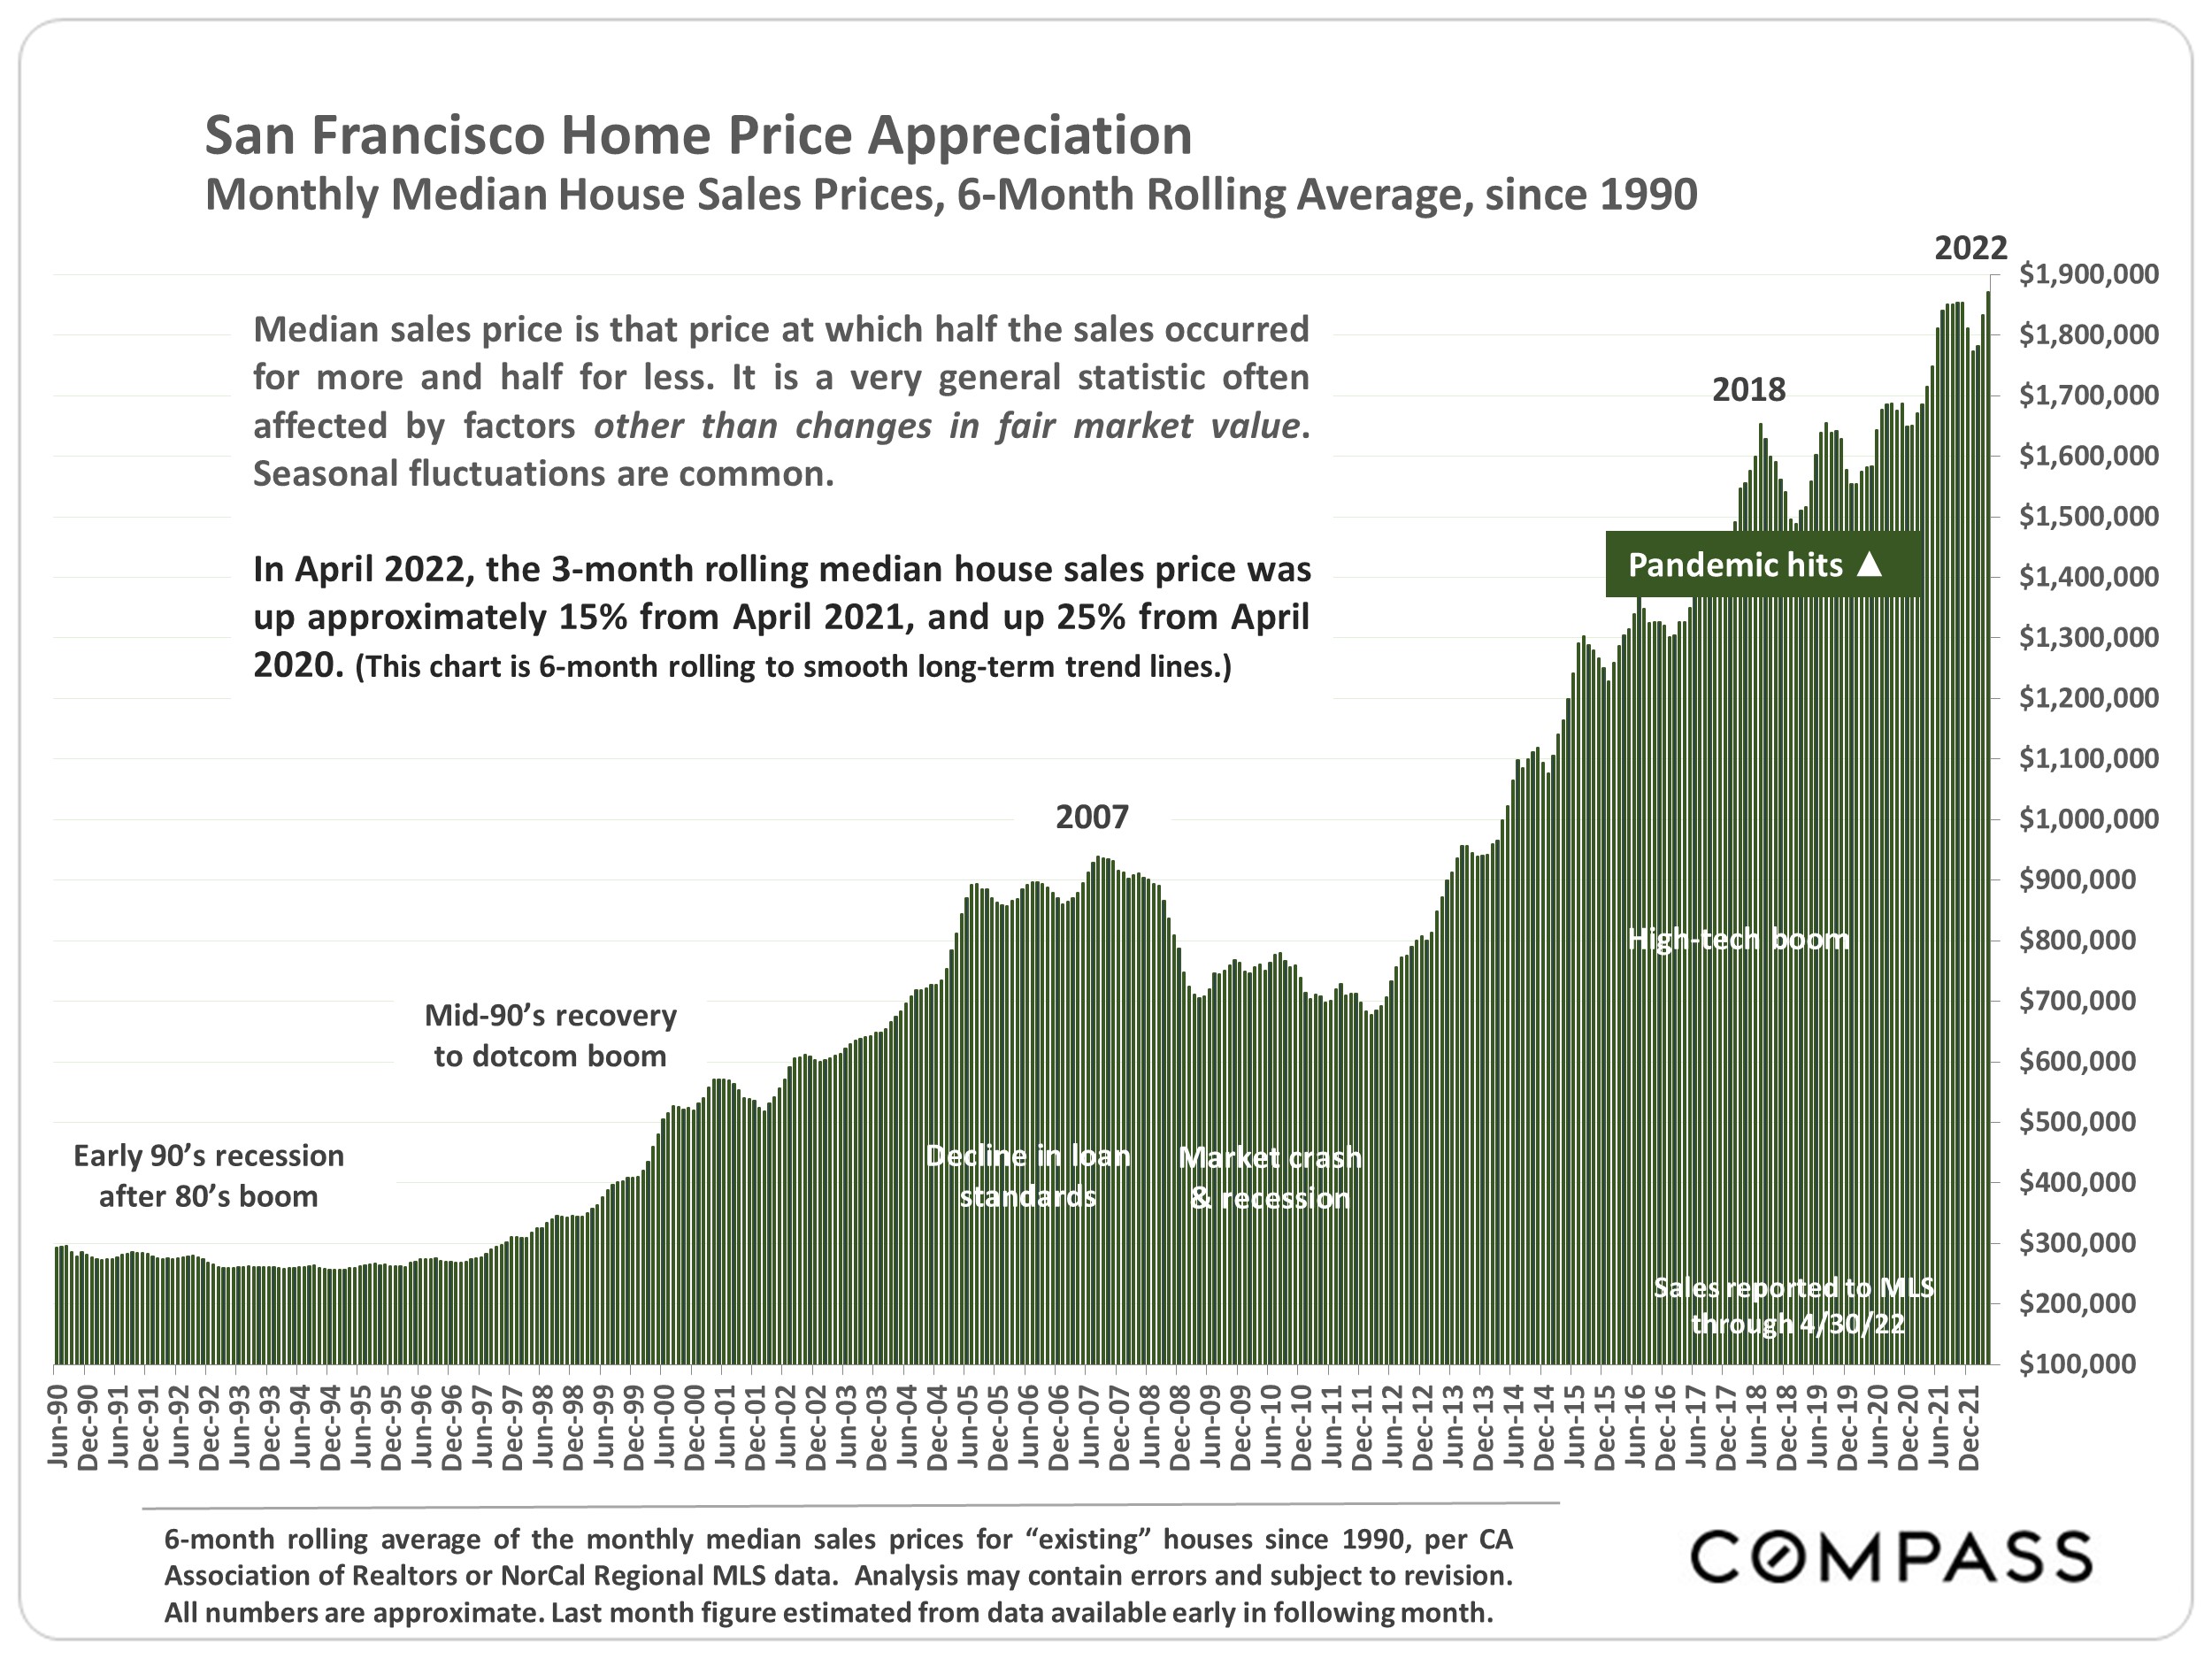
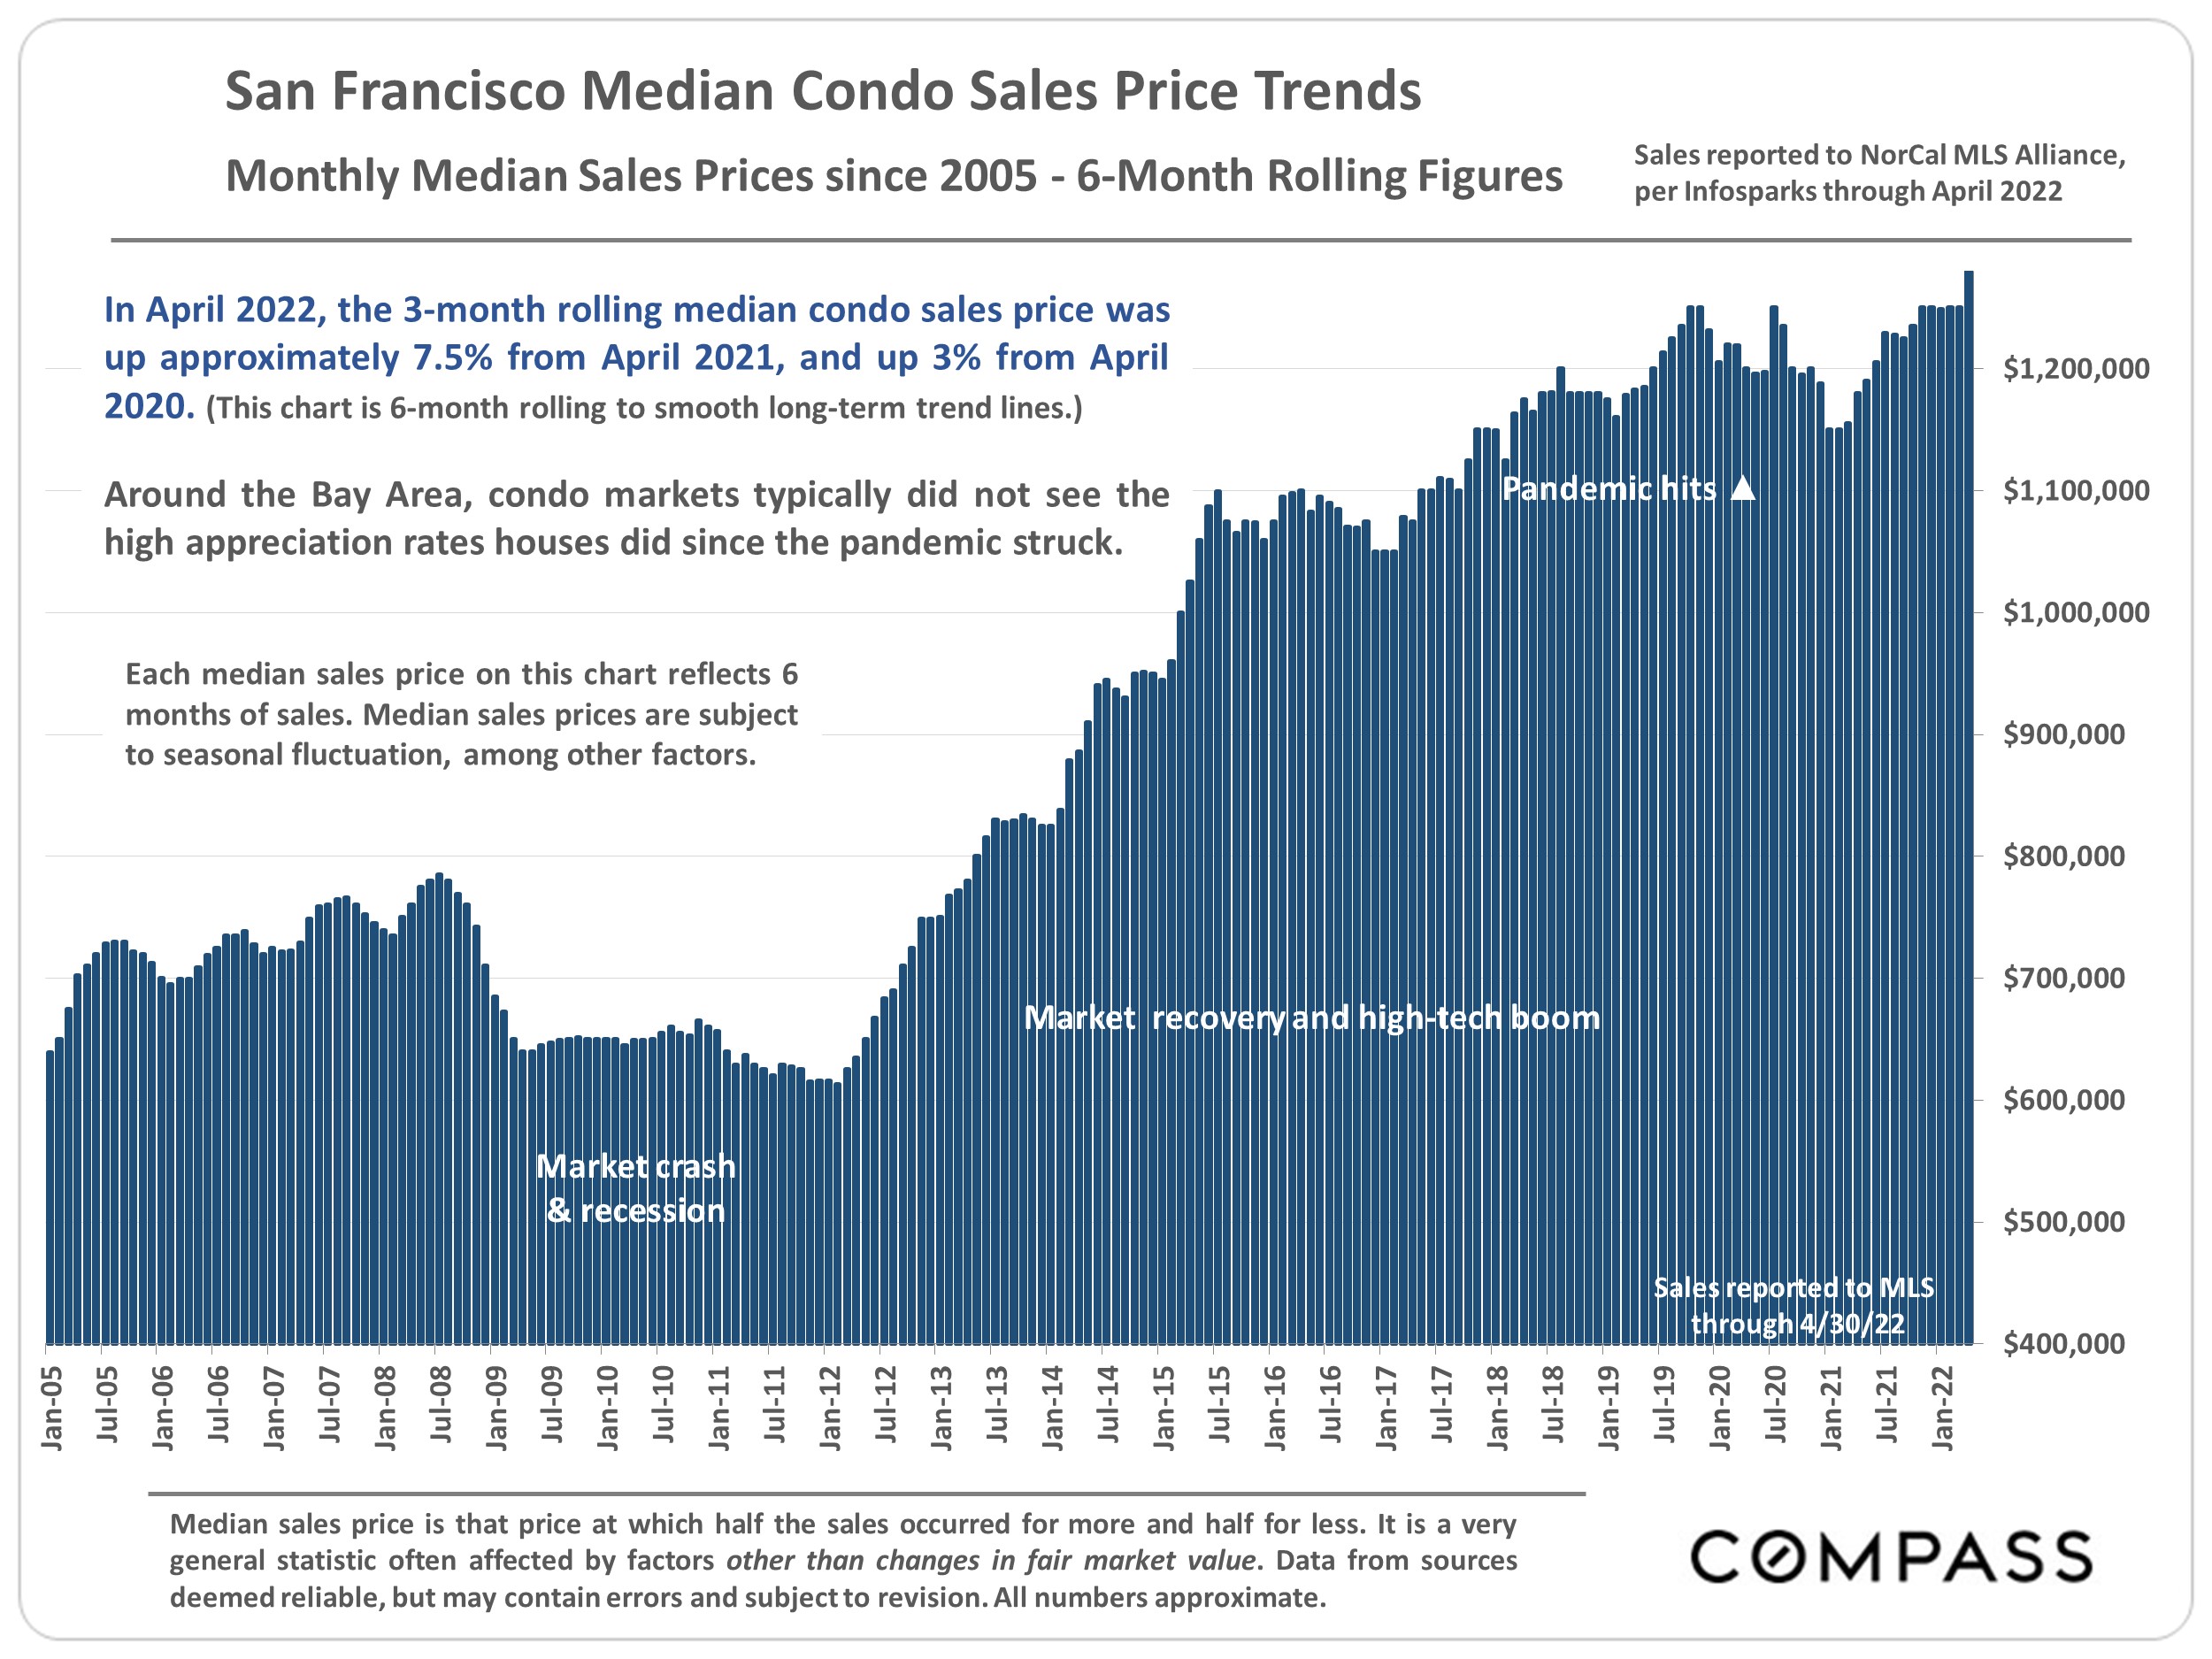
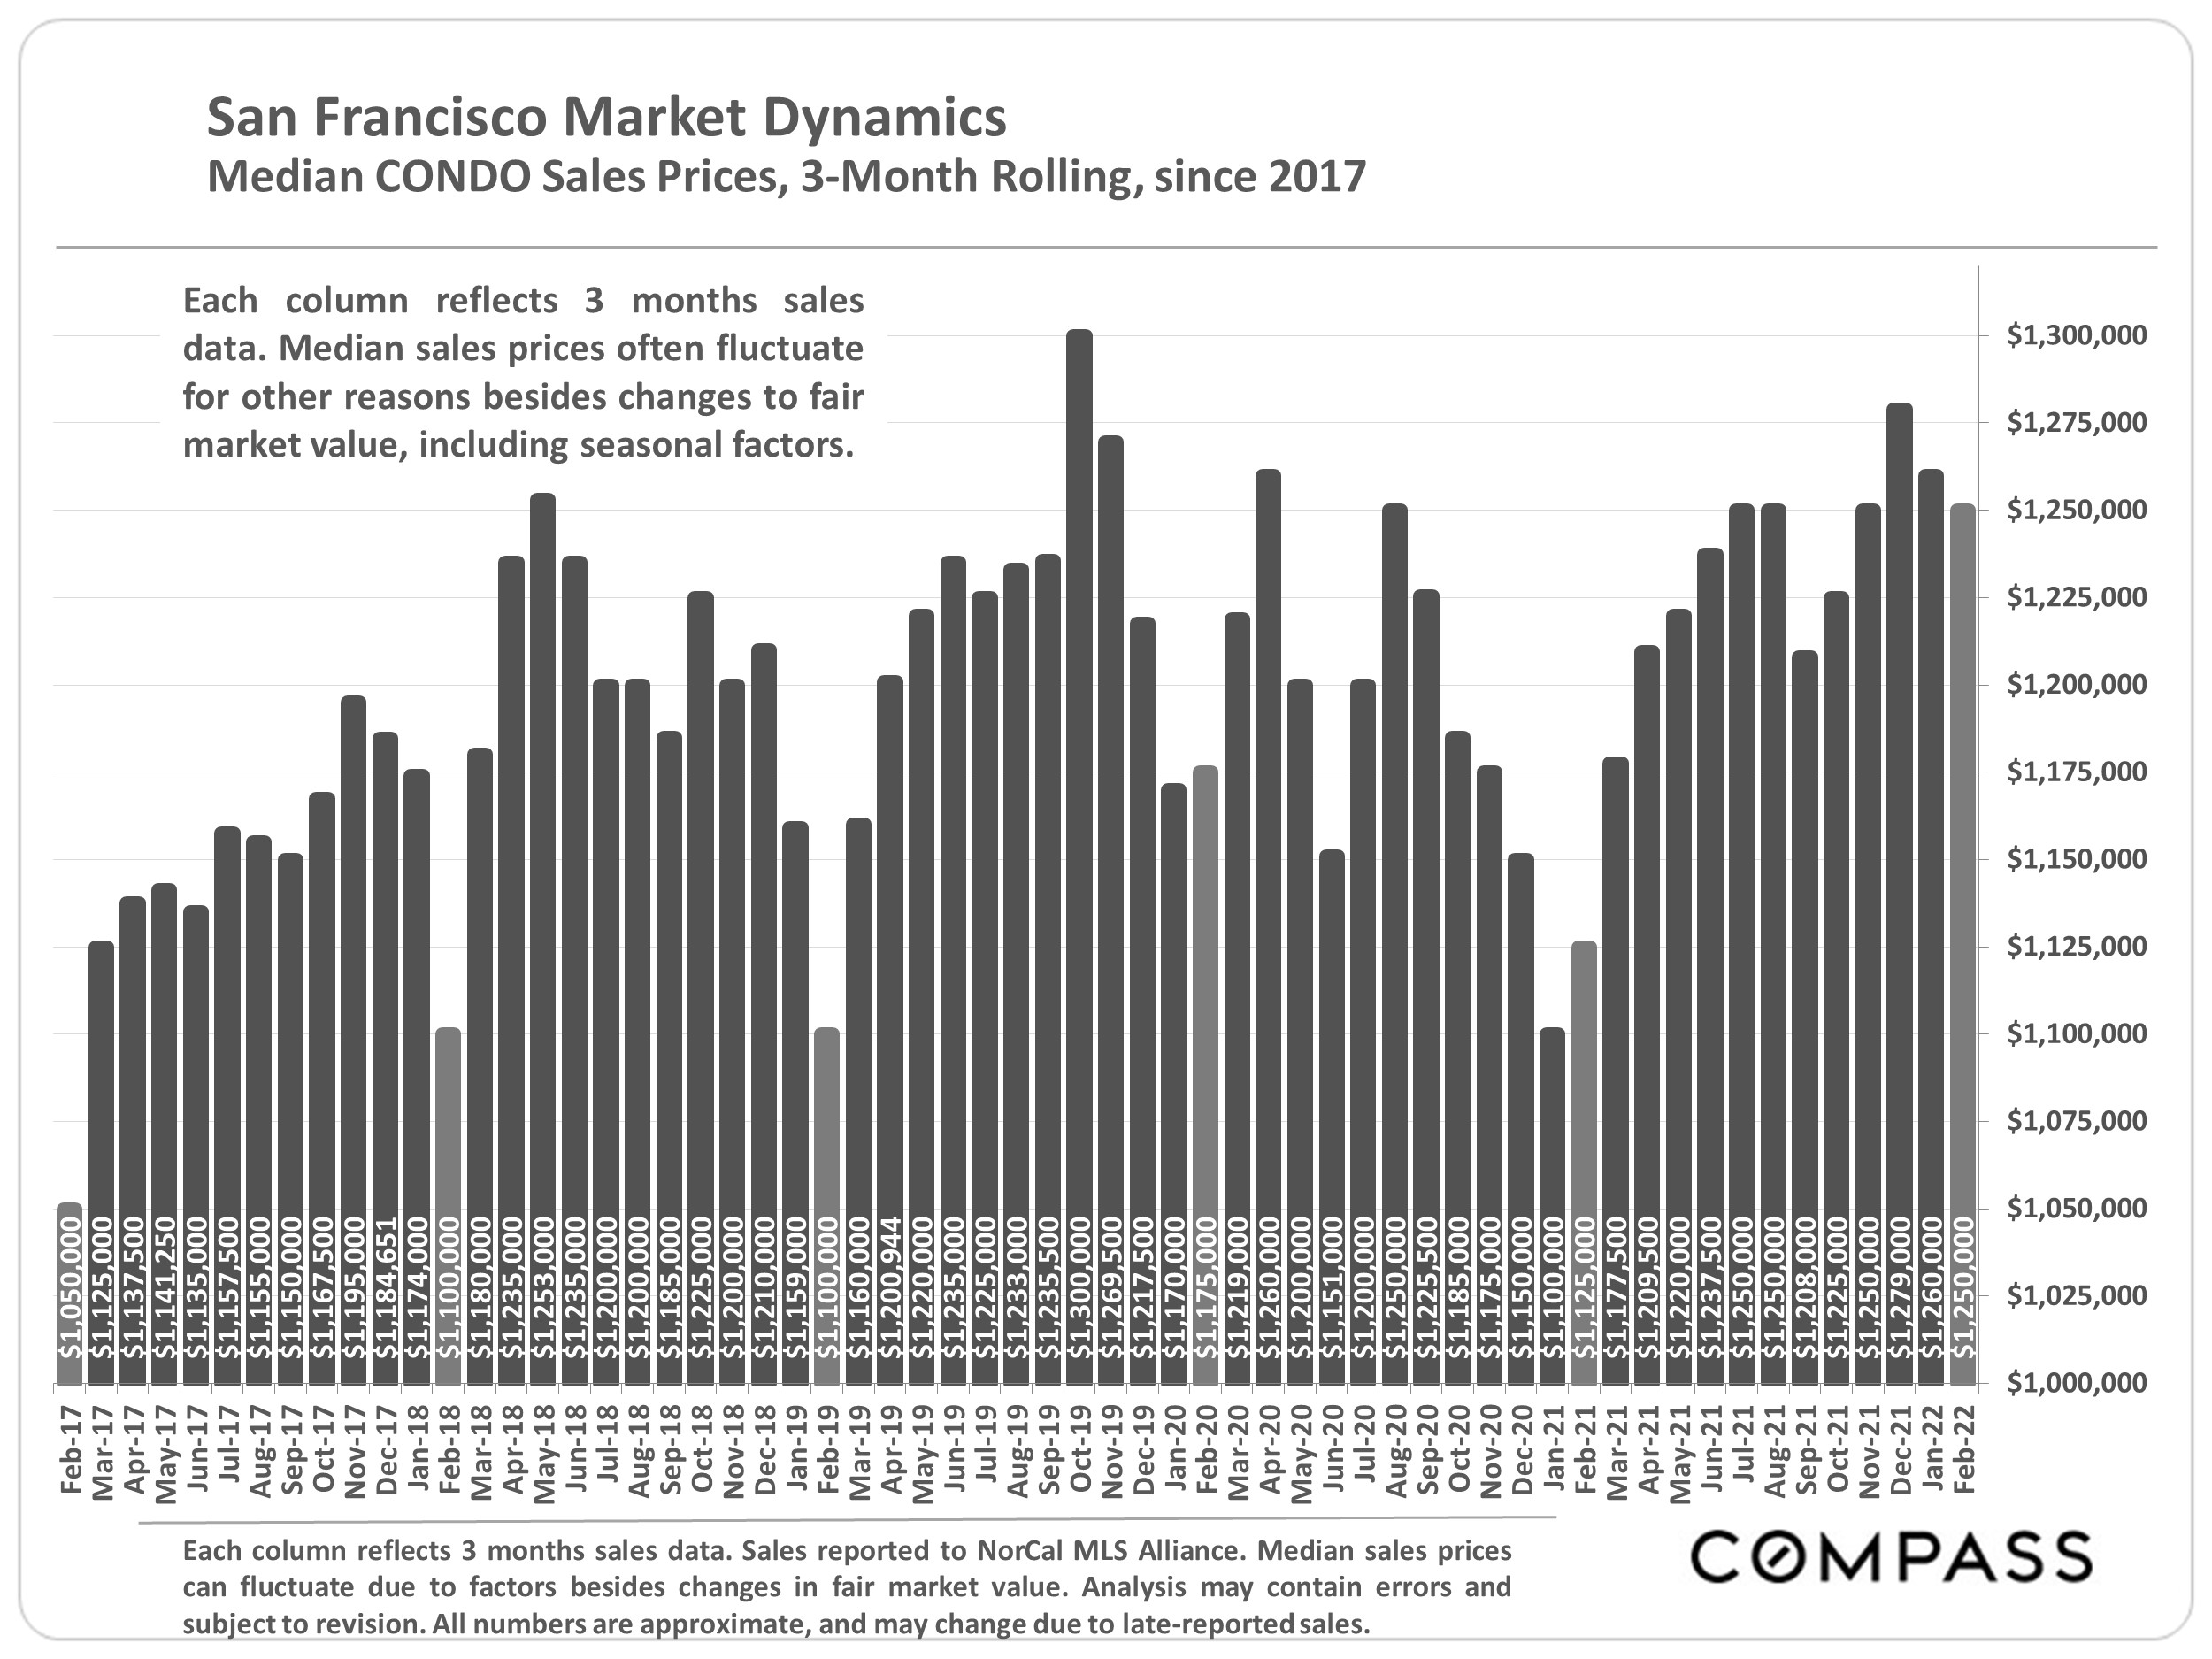
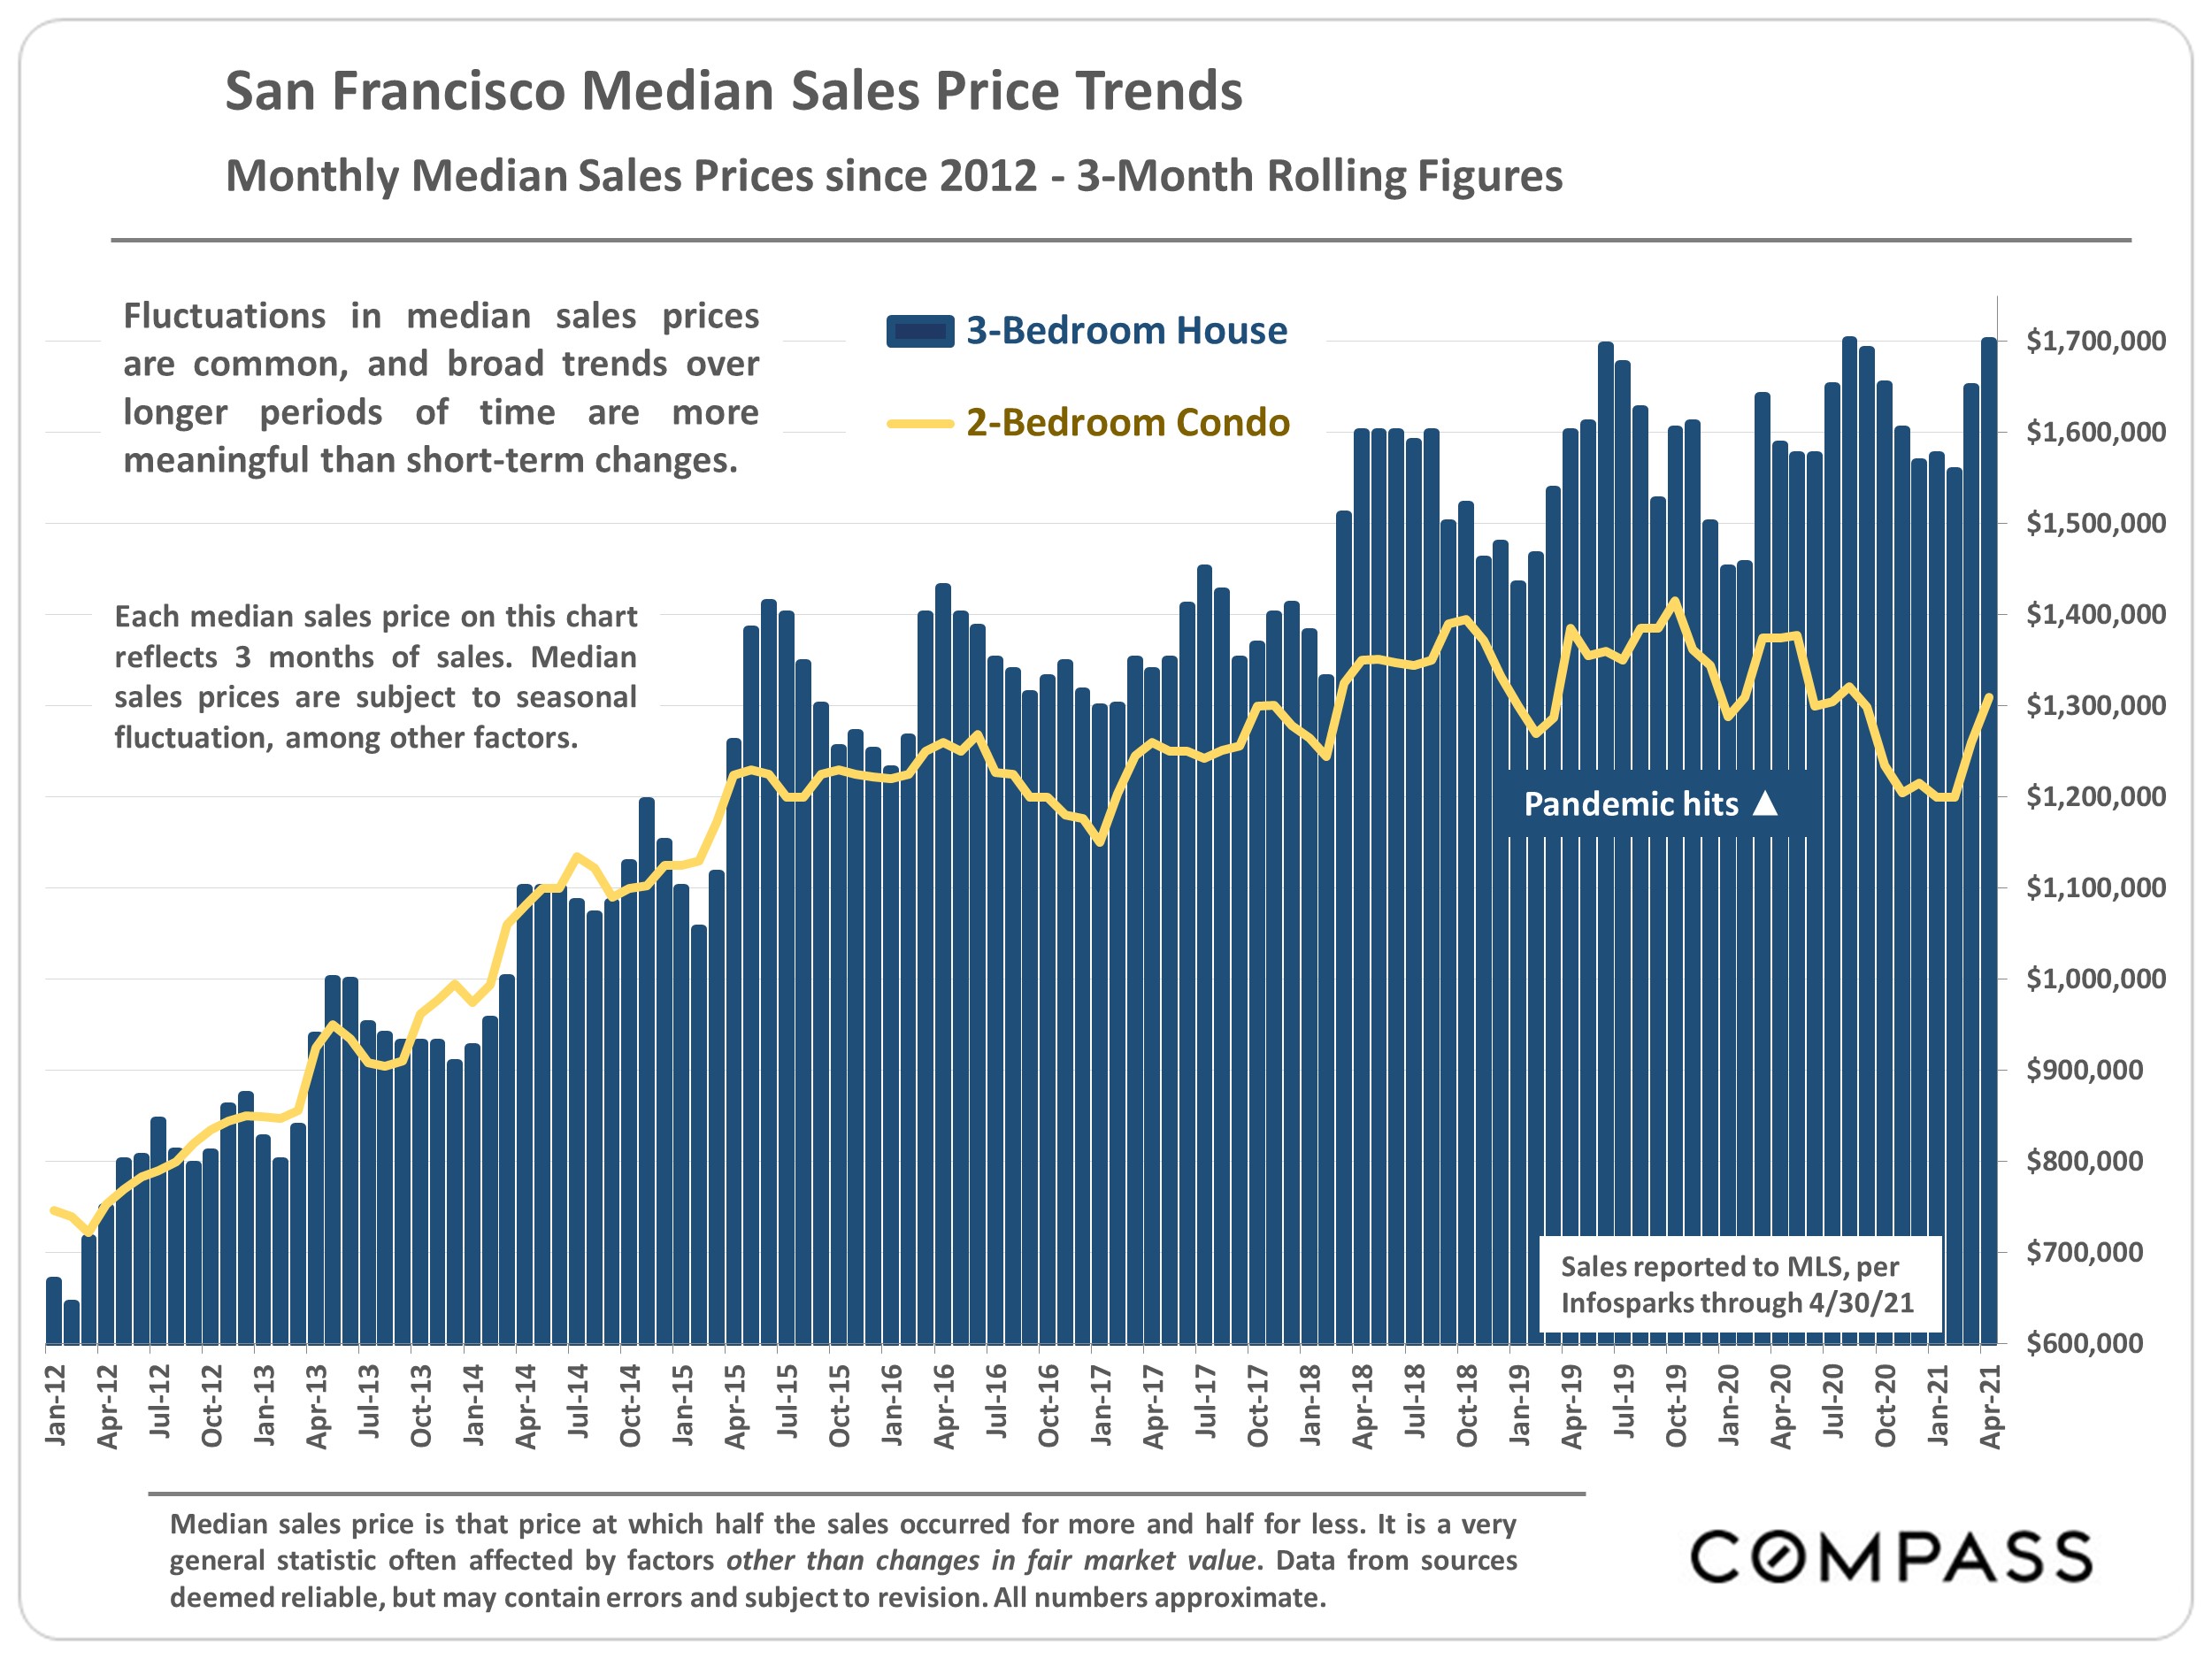
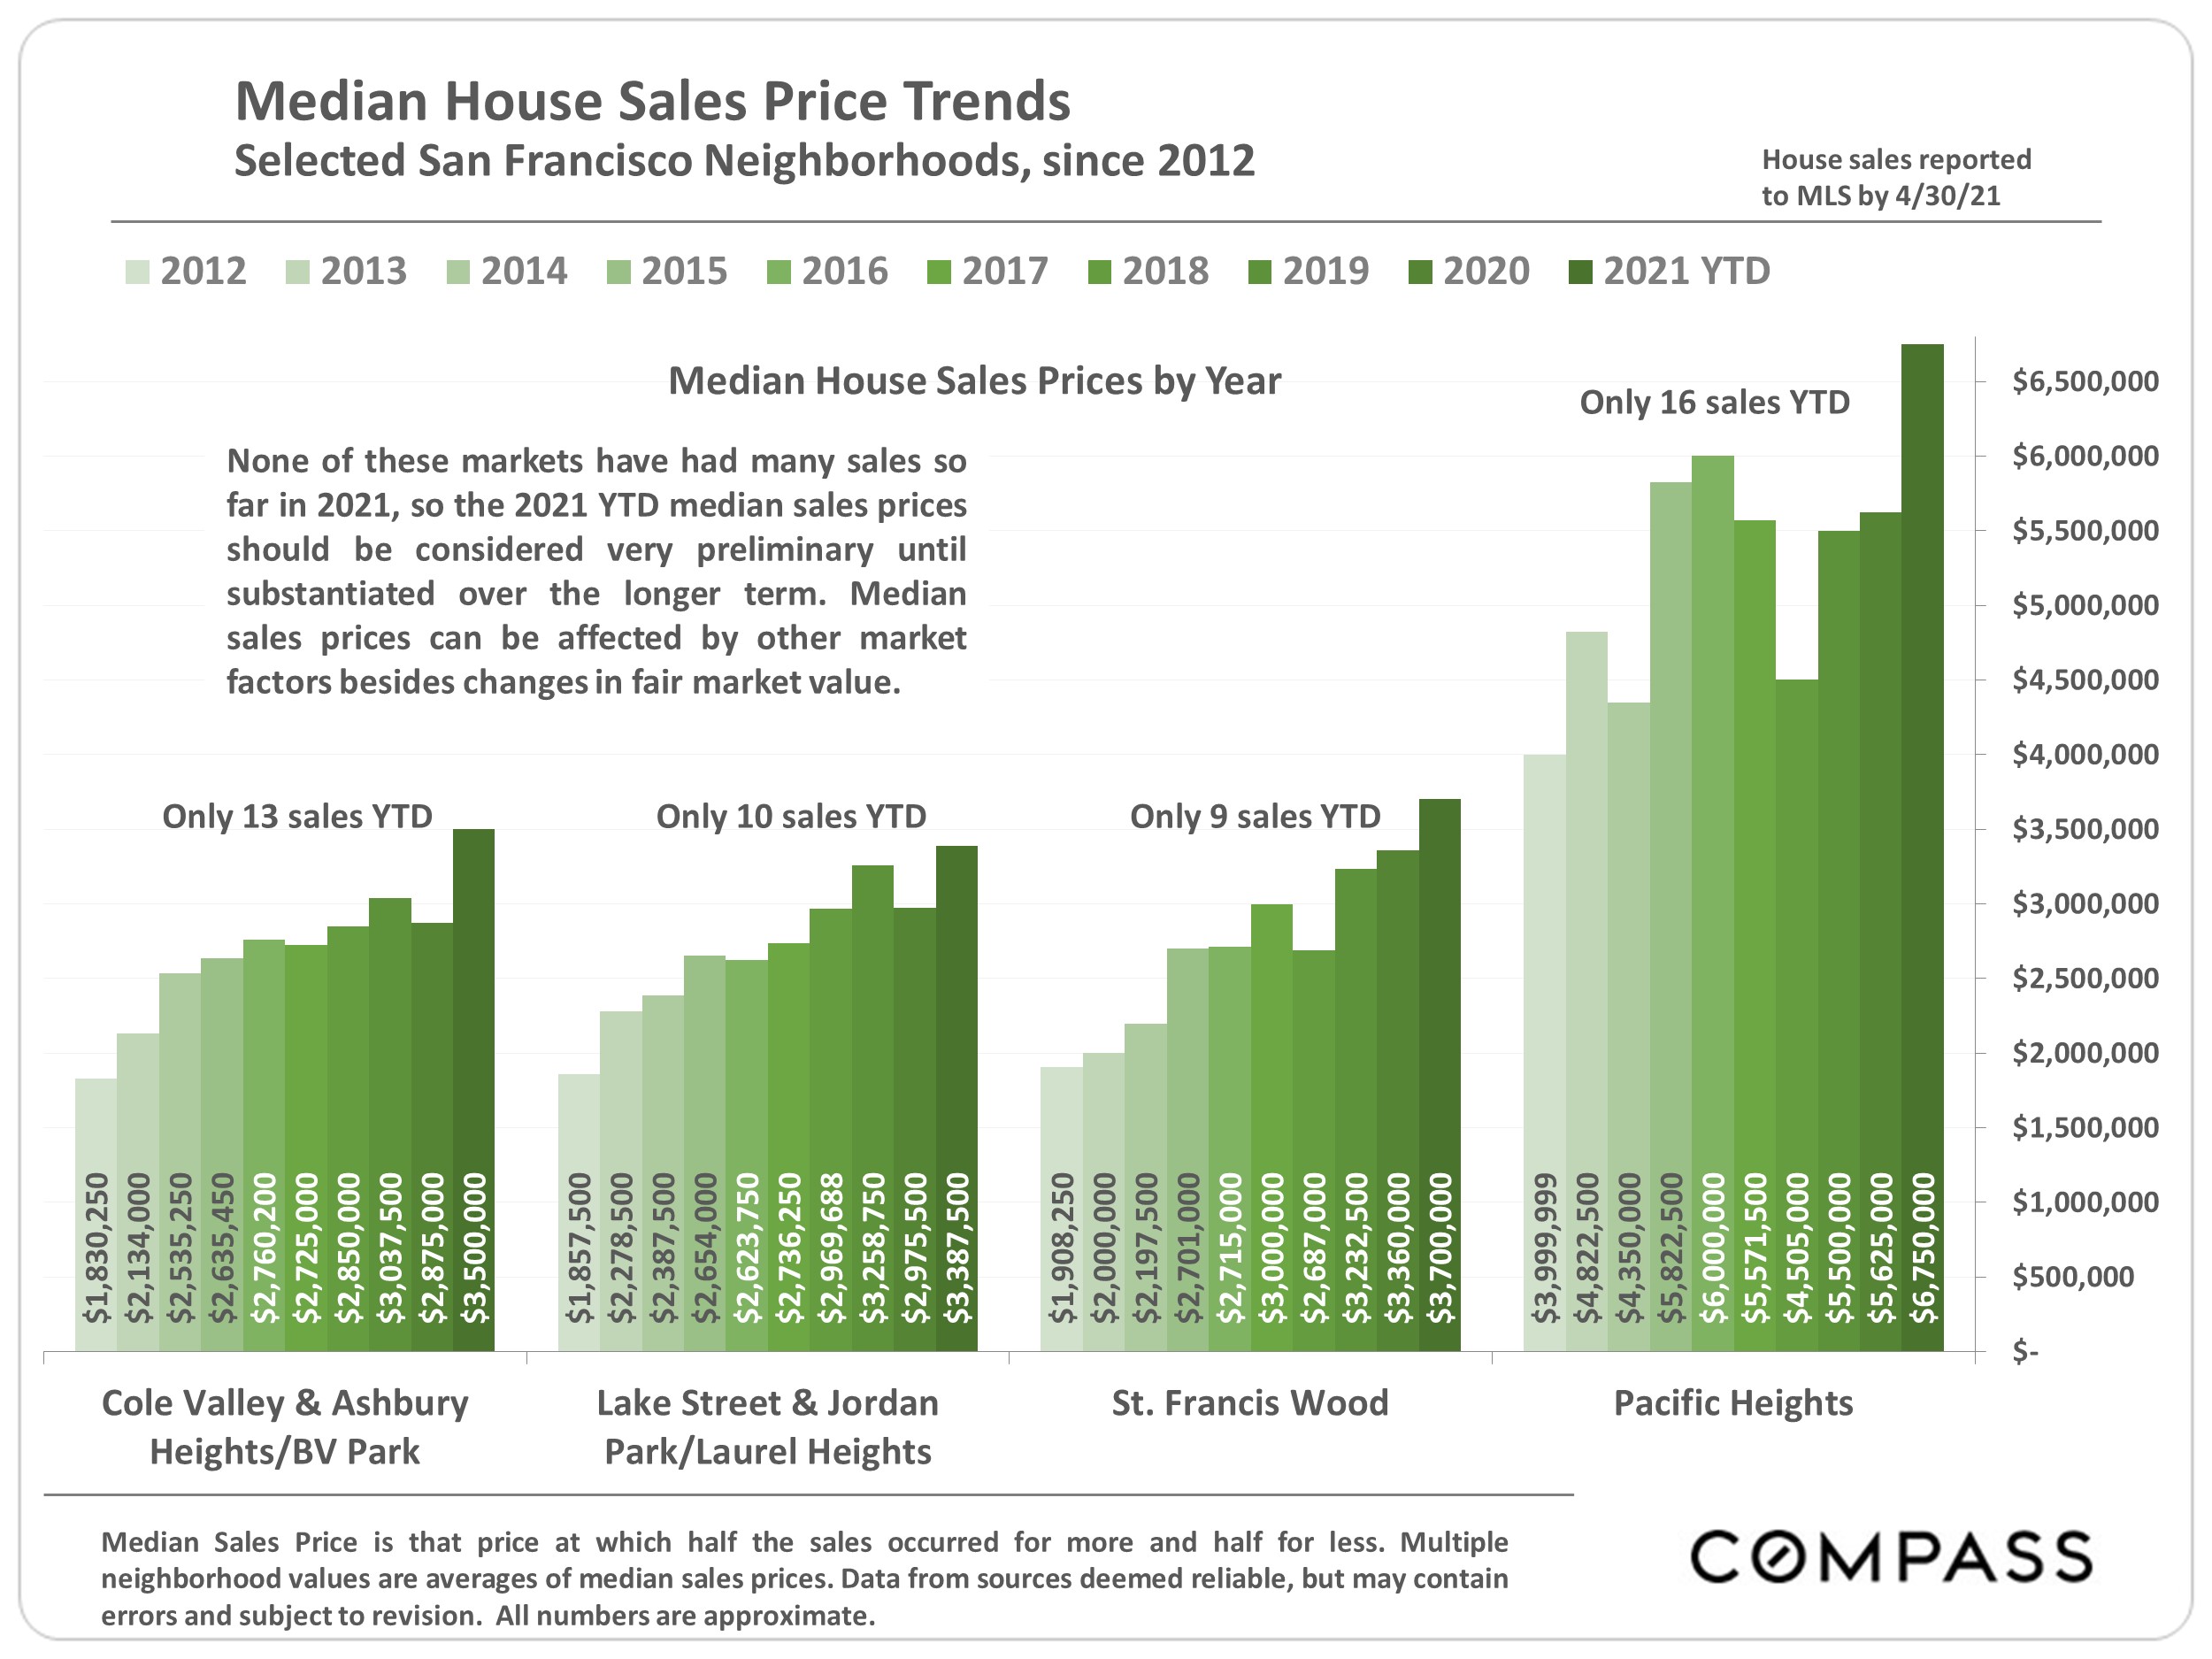
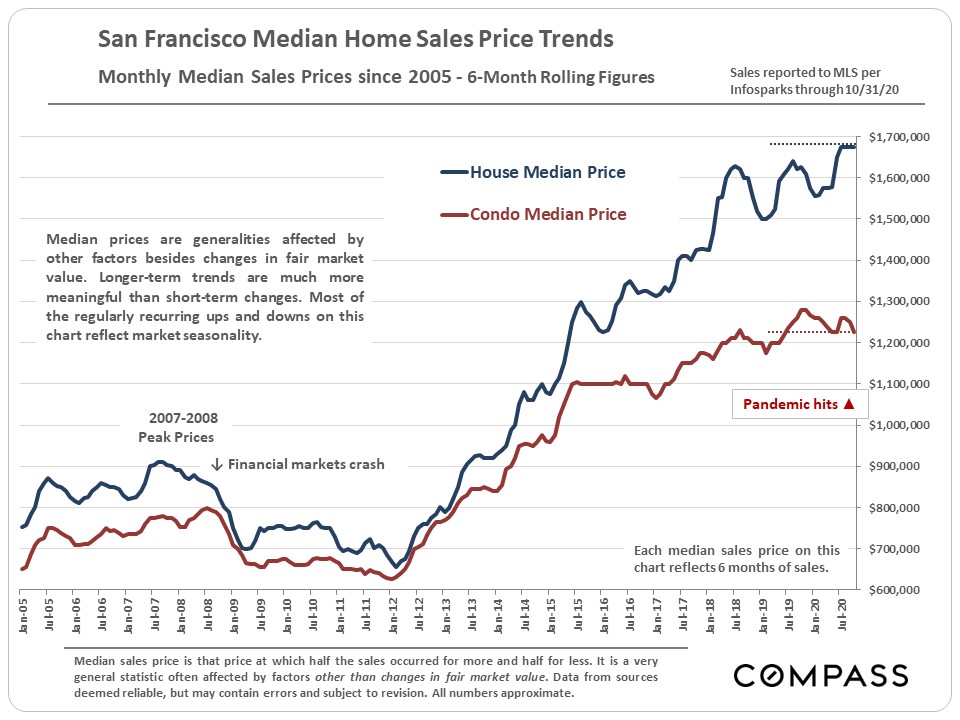
Long-term median sales price trends, 6-month rolling:
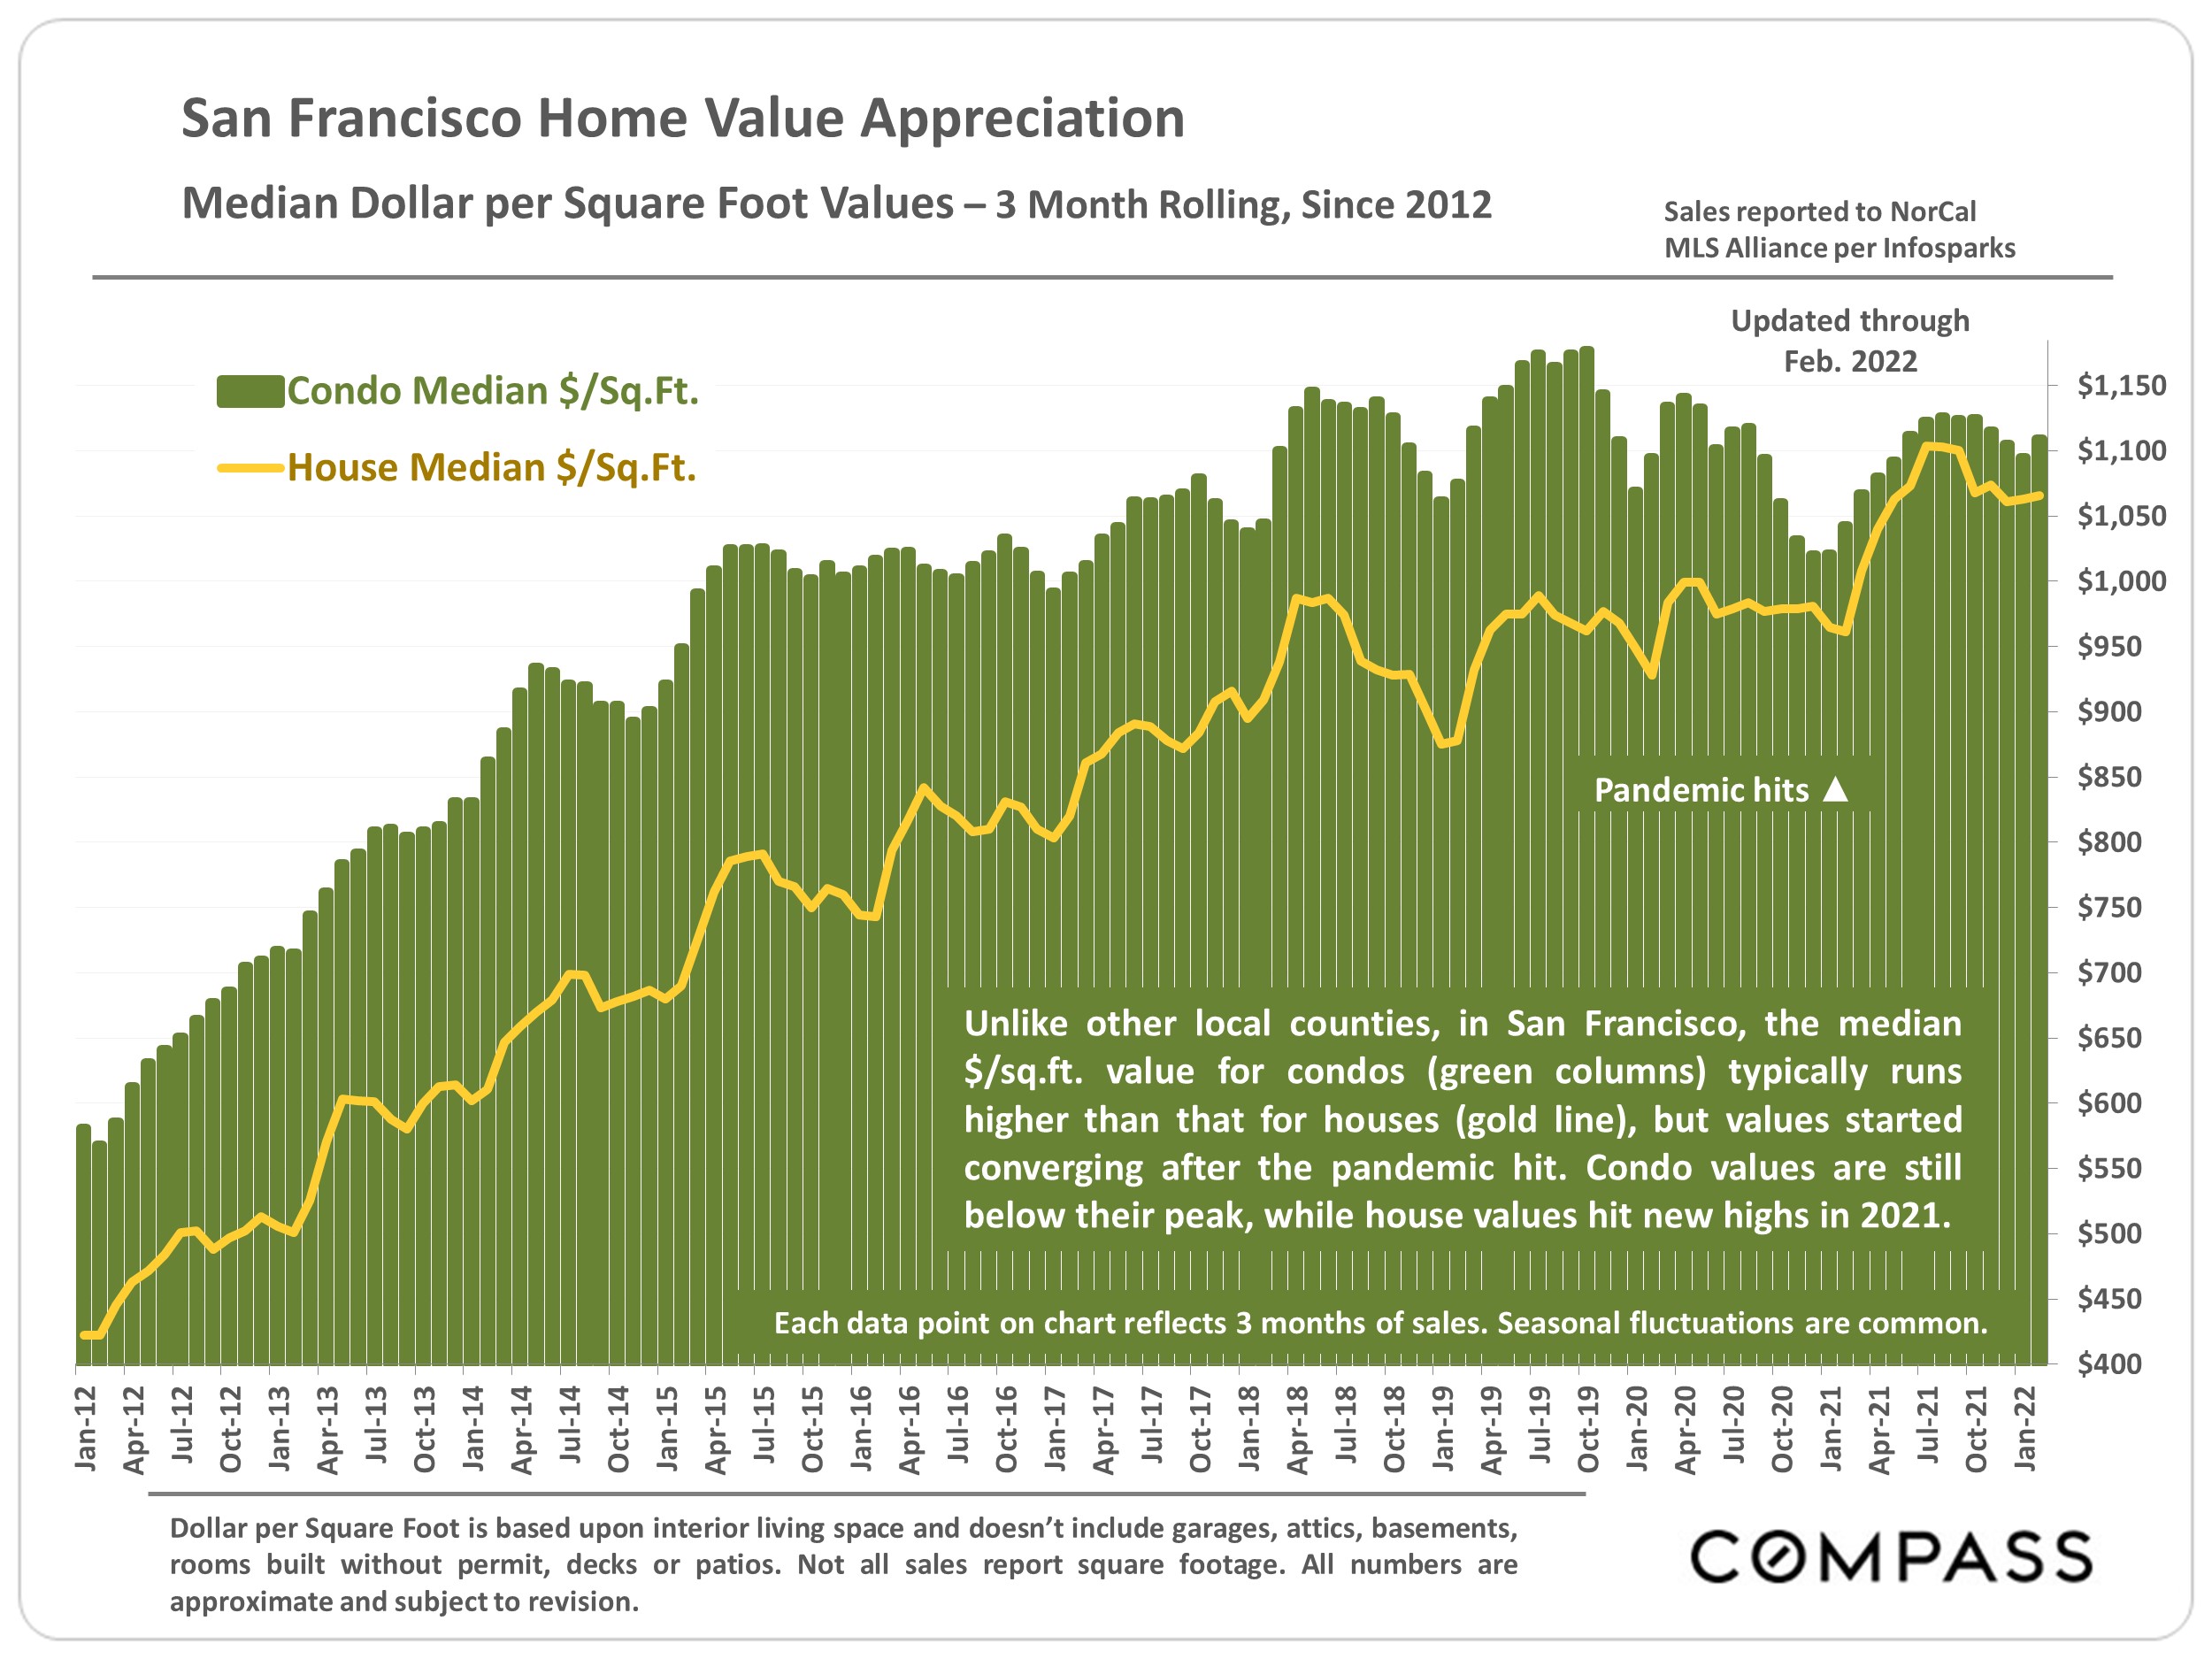
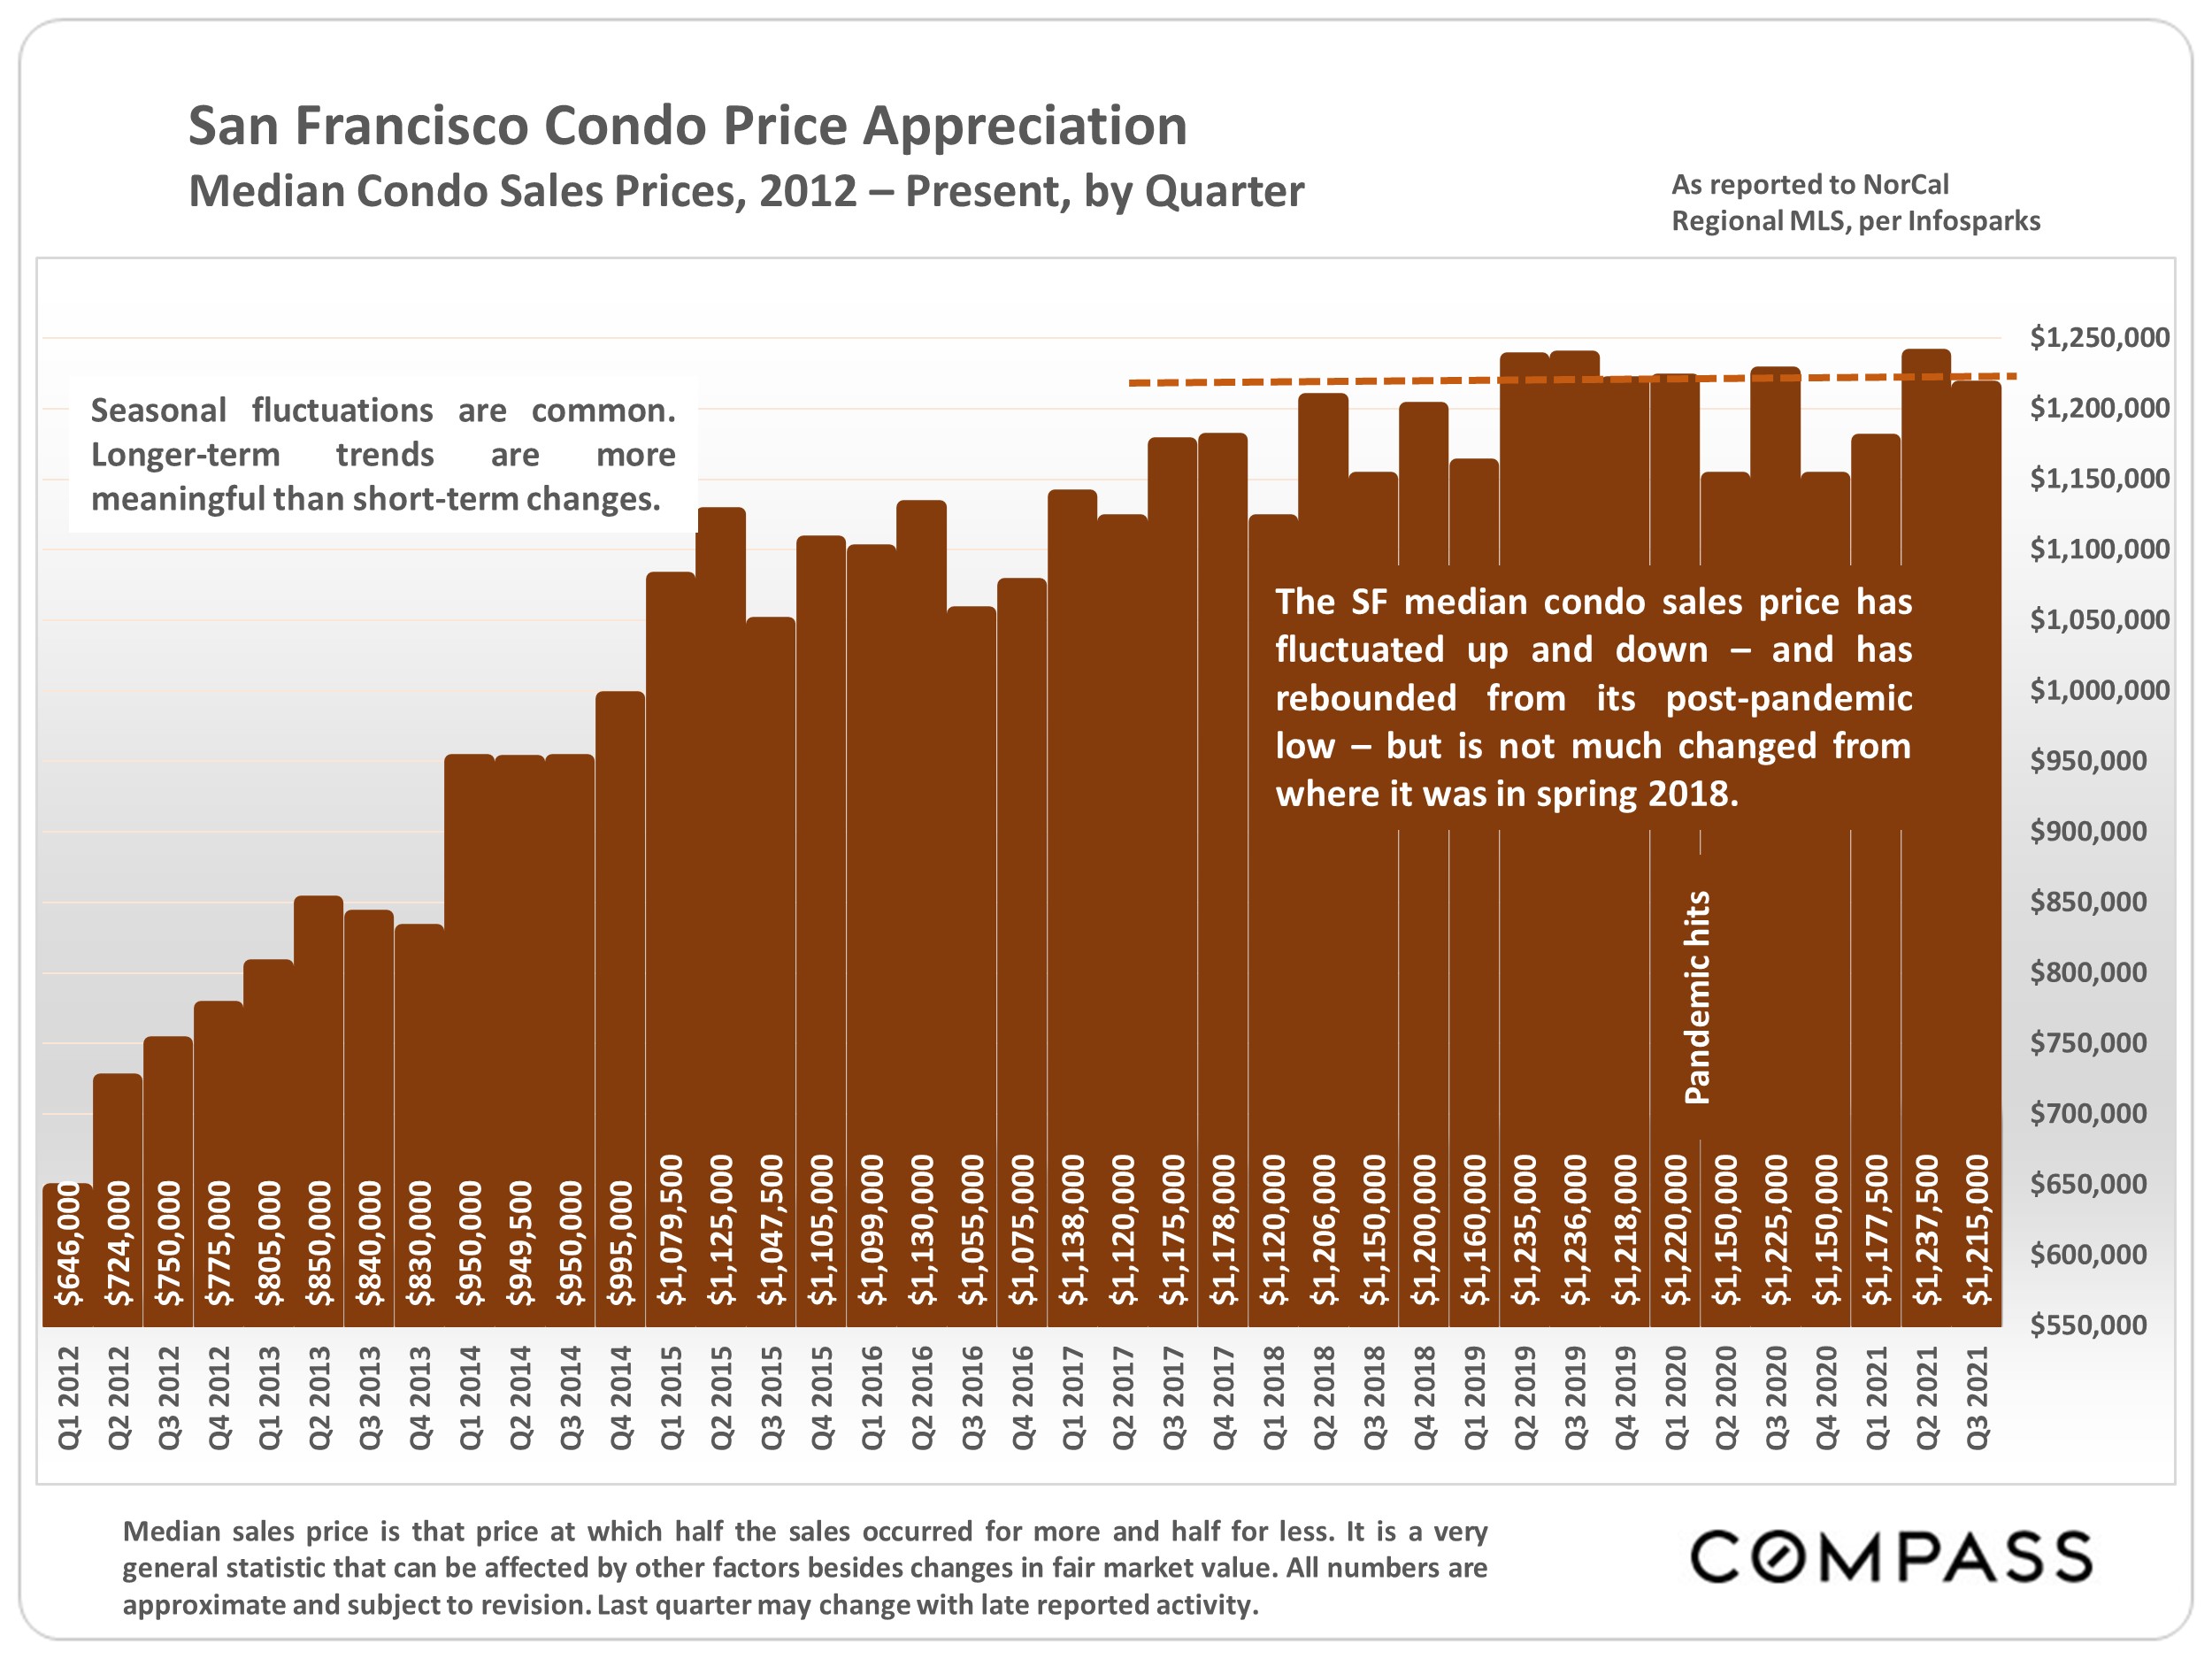
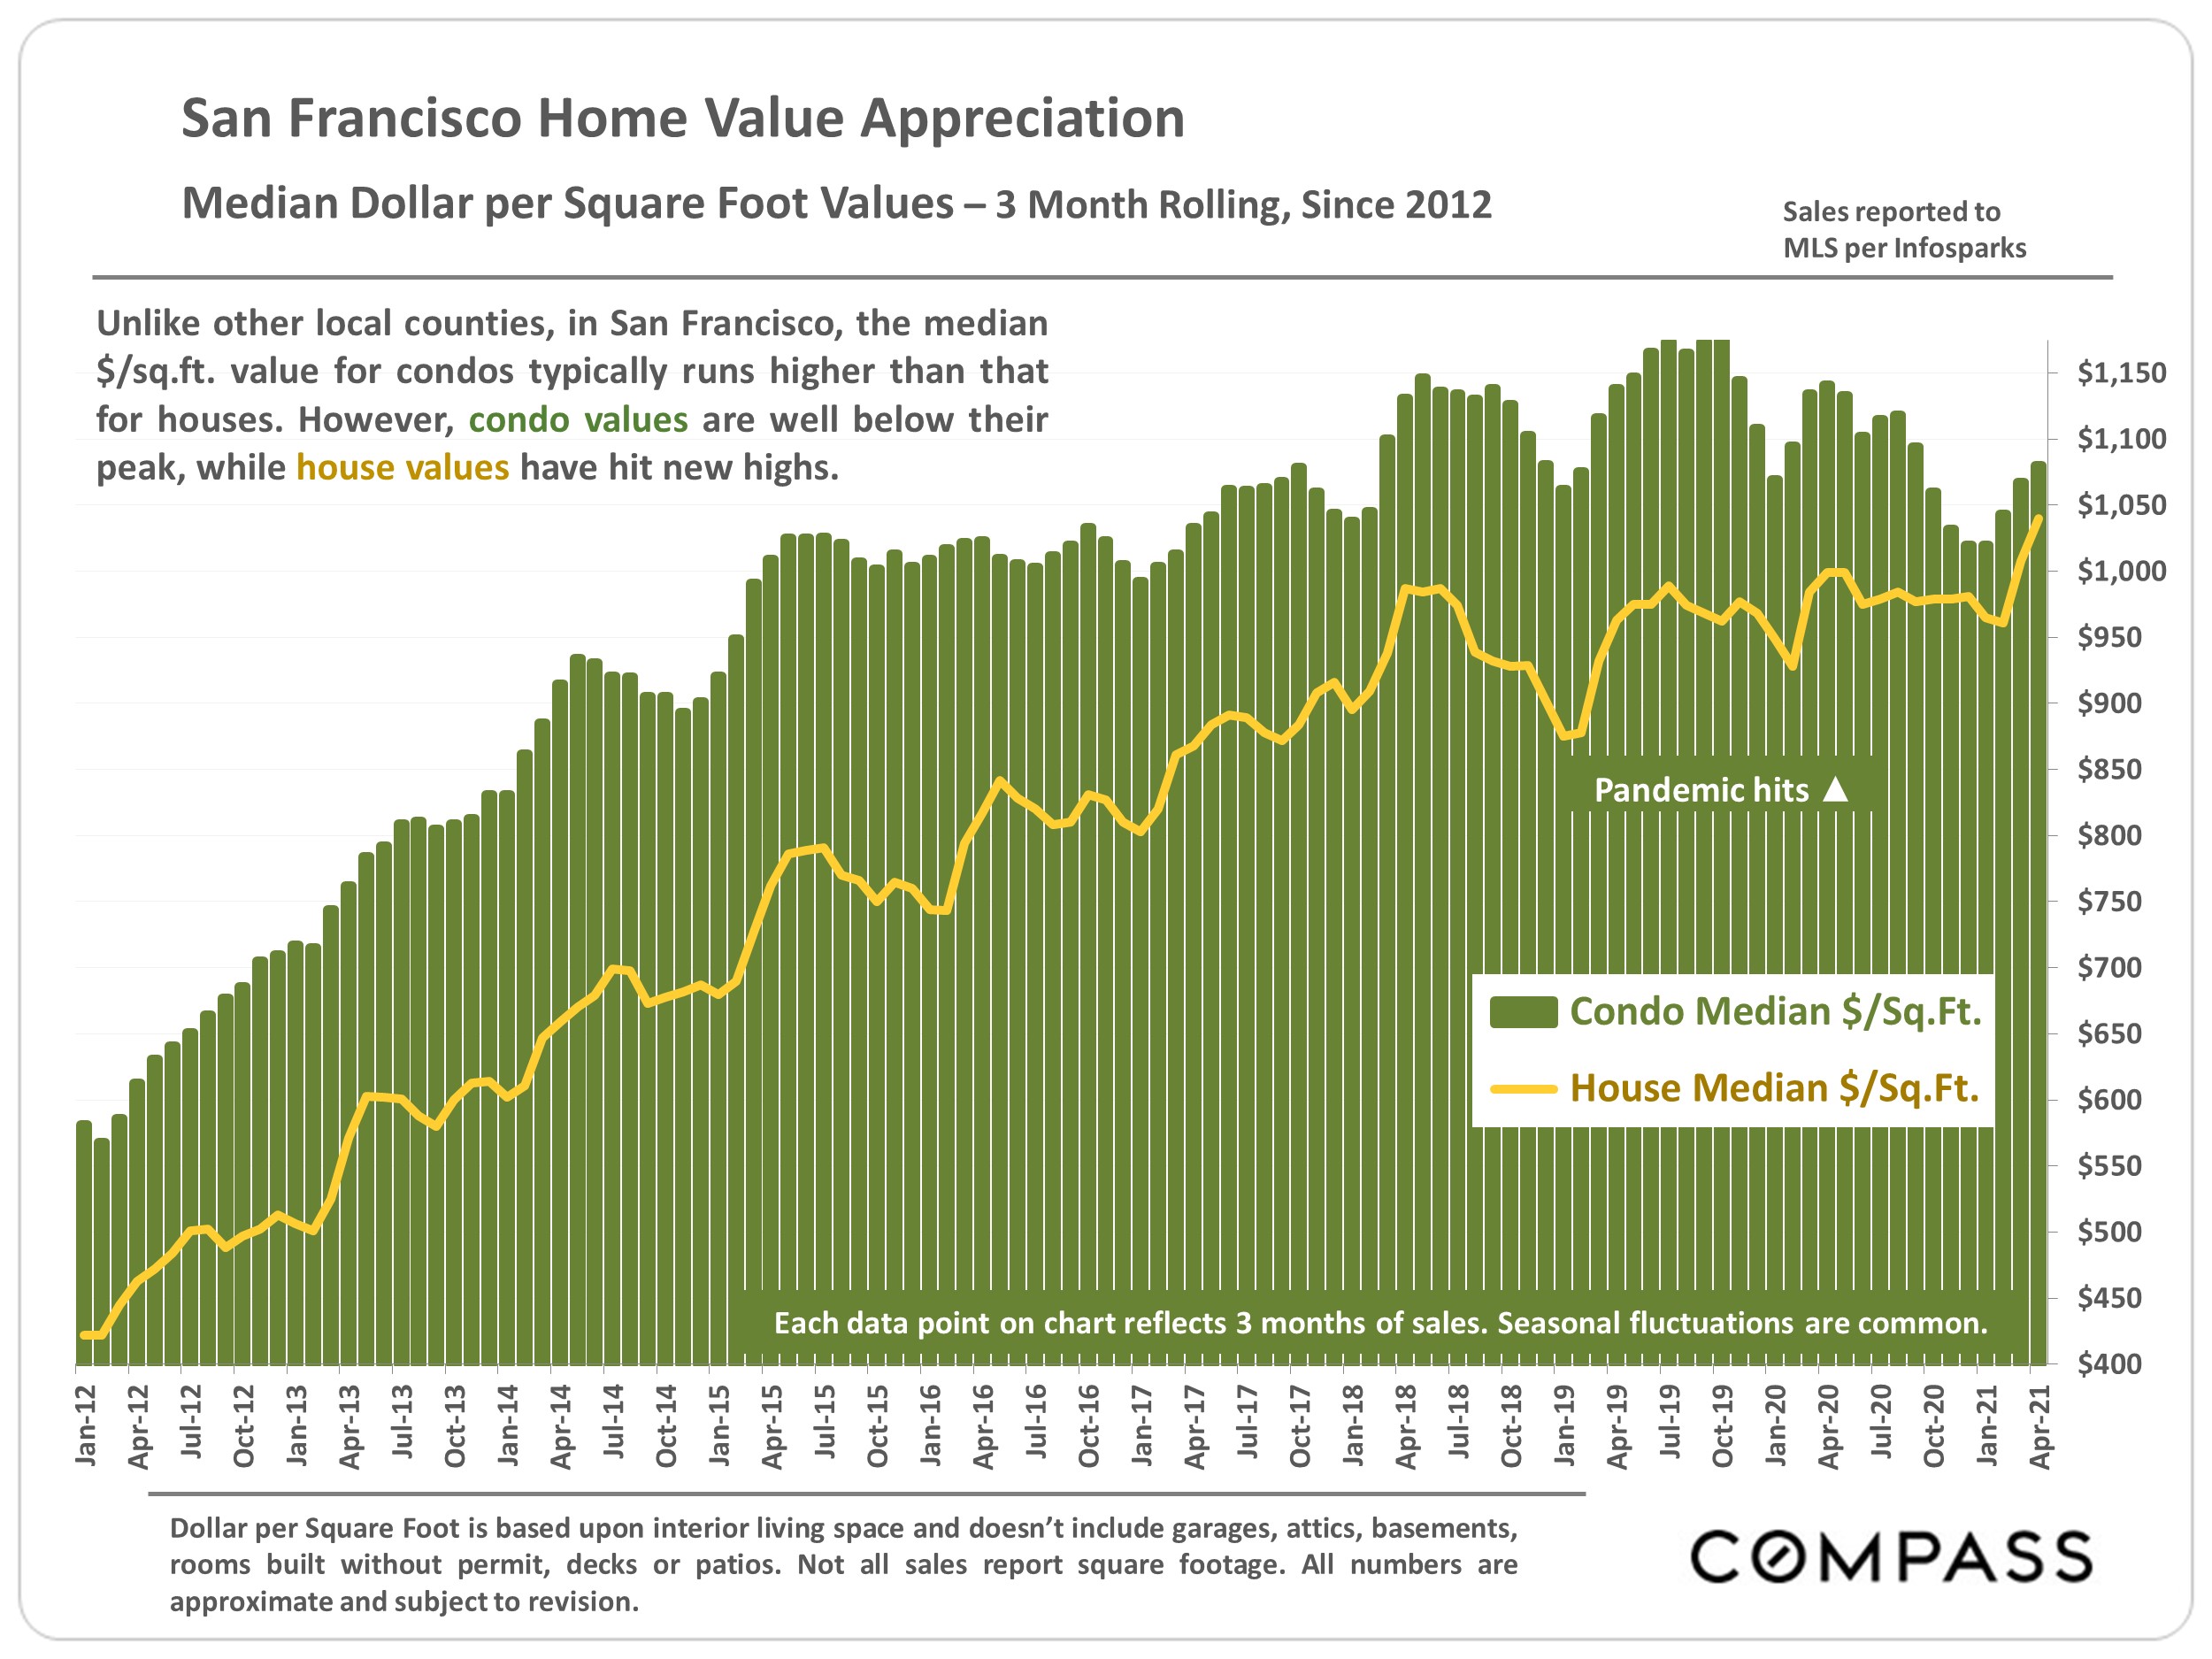
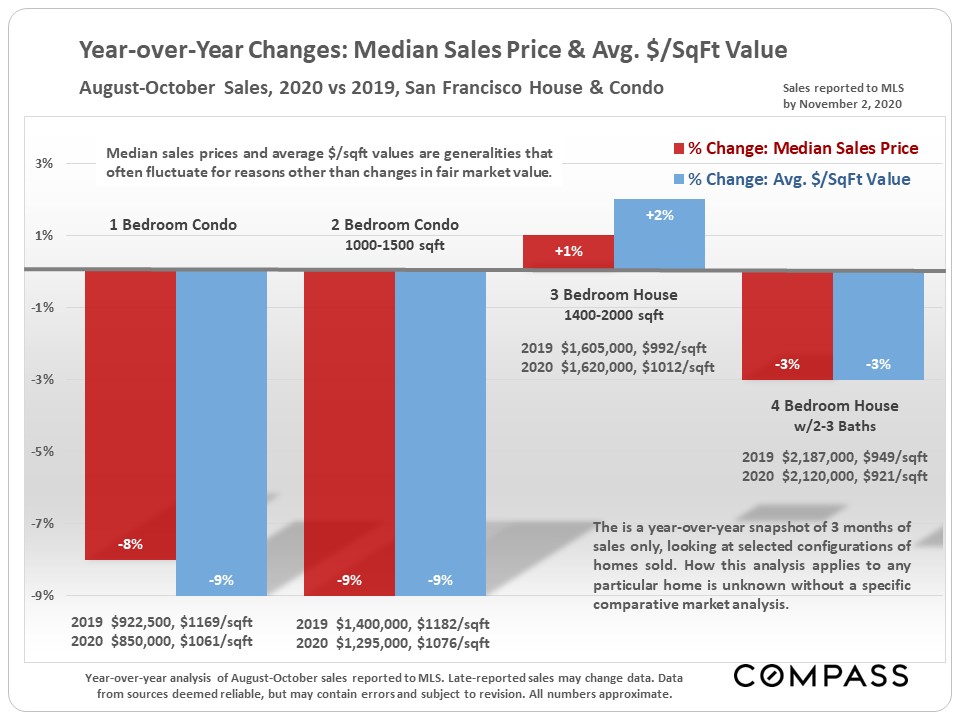
Year-over-year changes in median sales prices and average dollar per square foot values in selected home configurations. The condo market has been hit by significant declines in these 2 measurements.
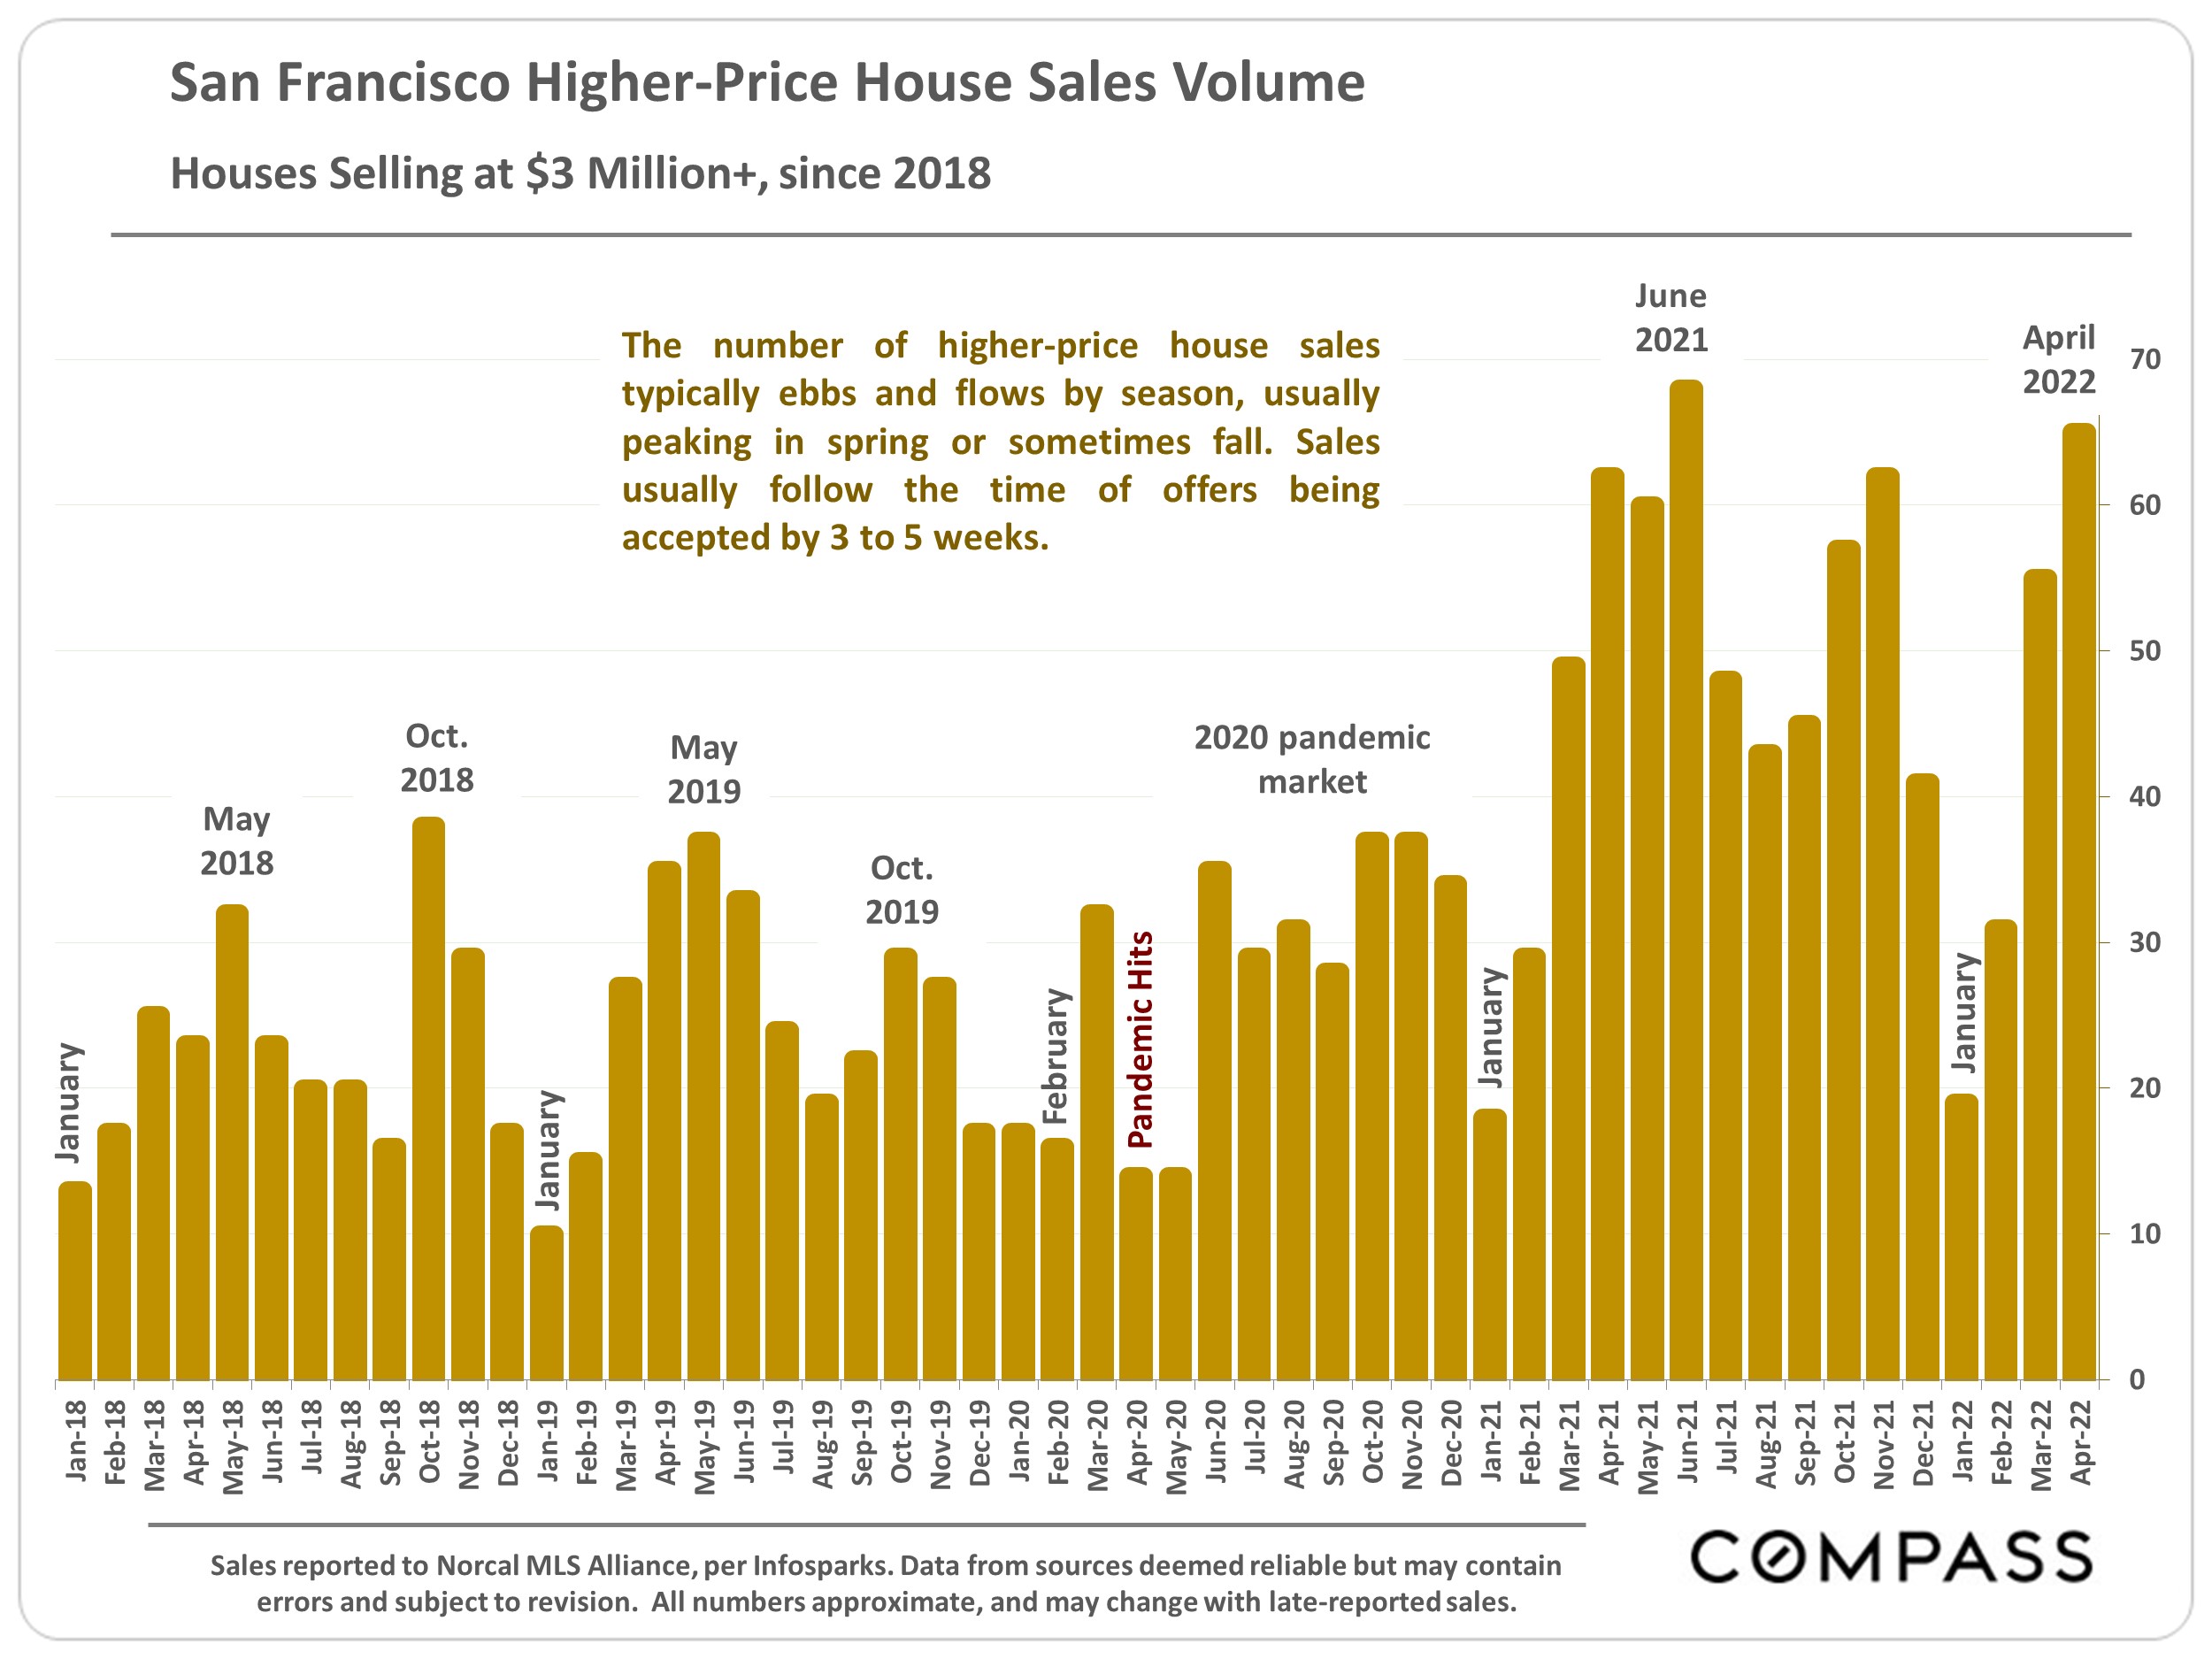
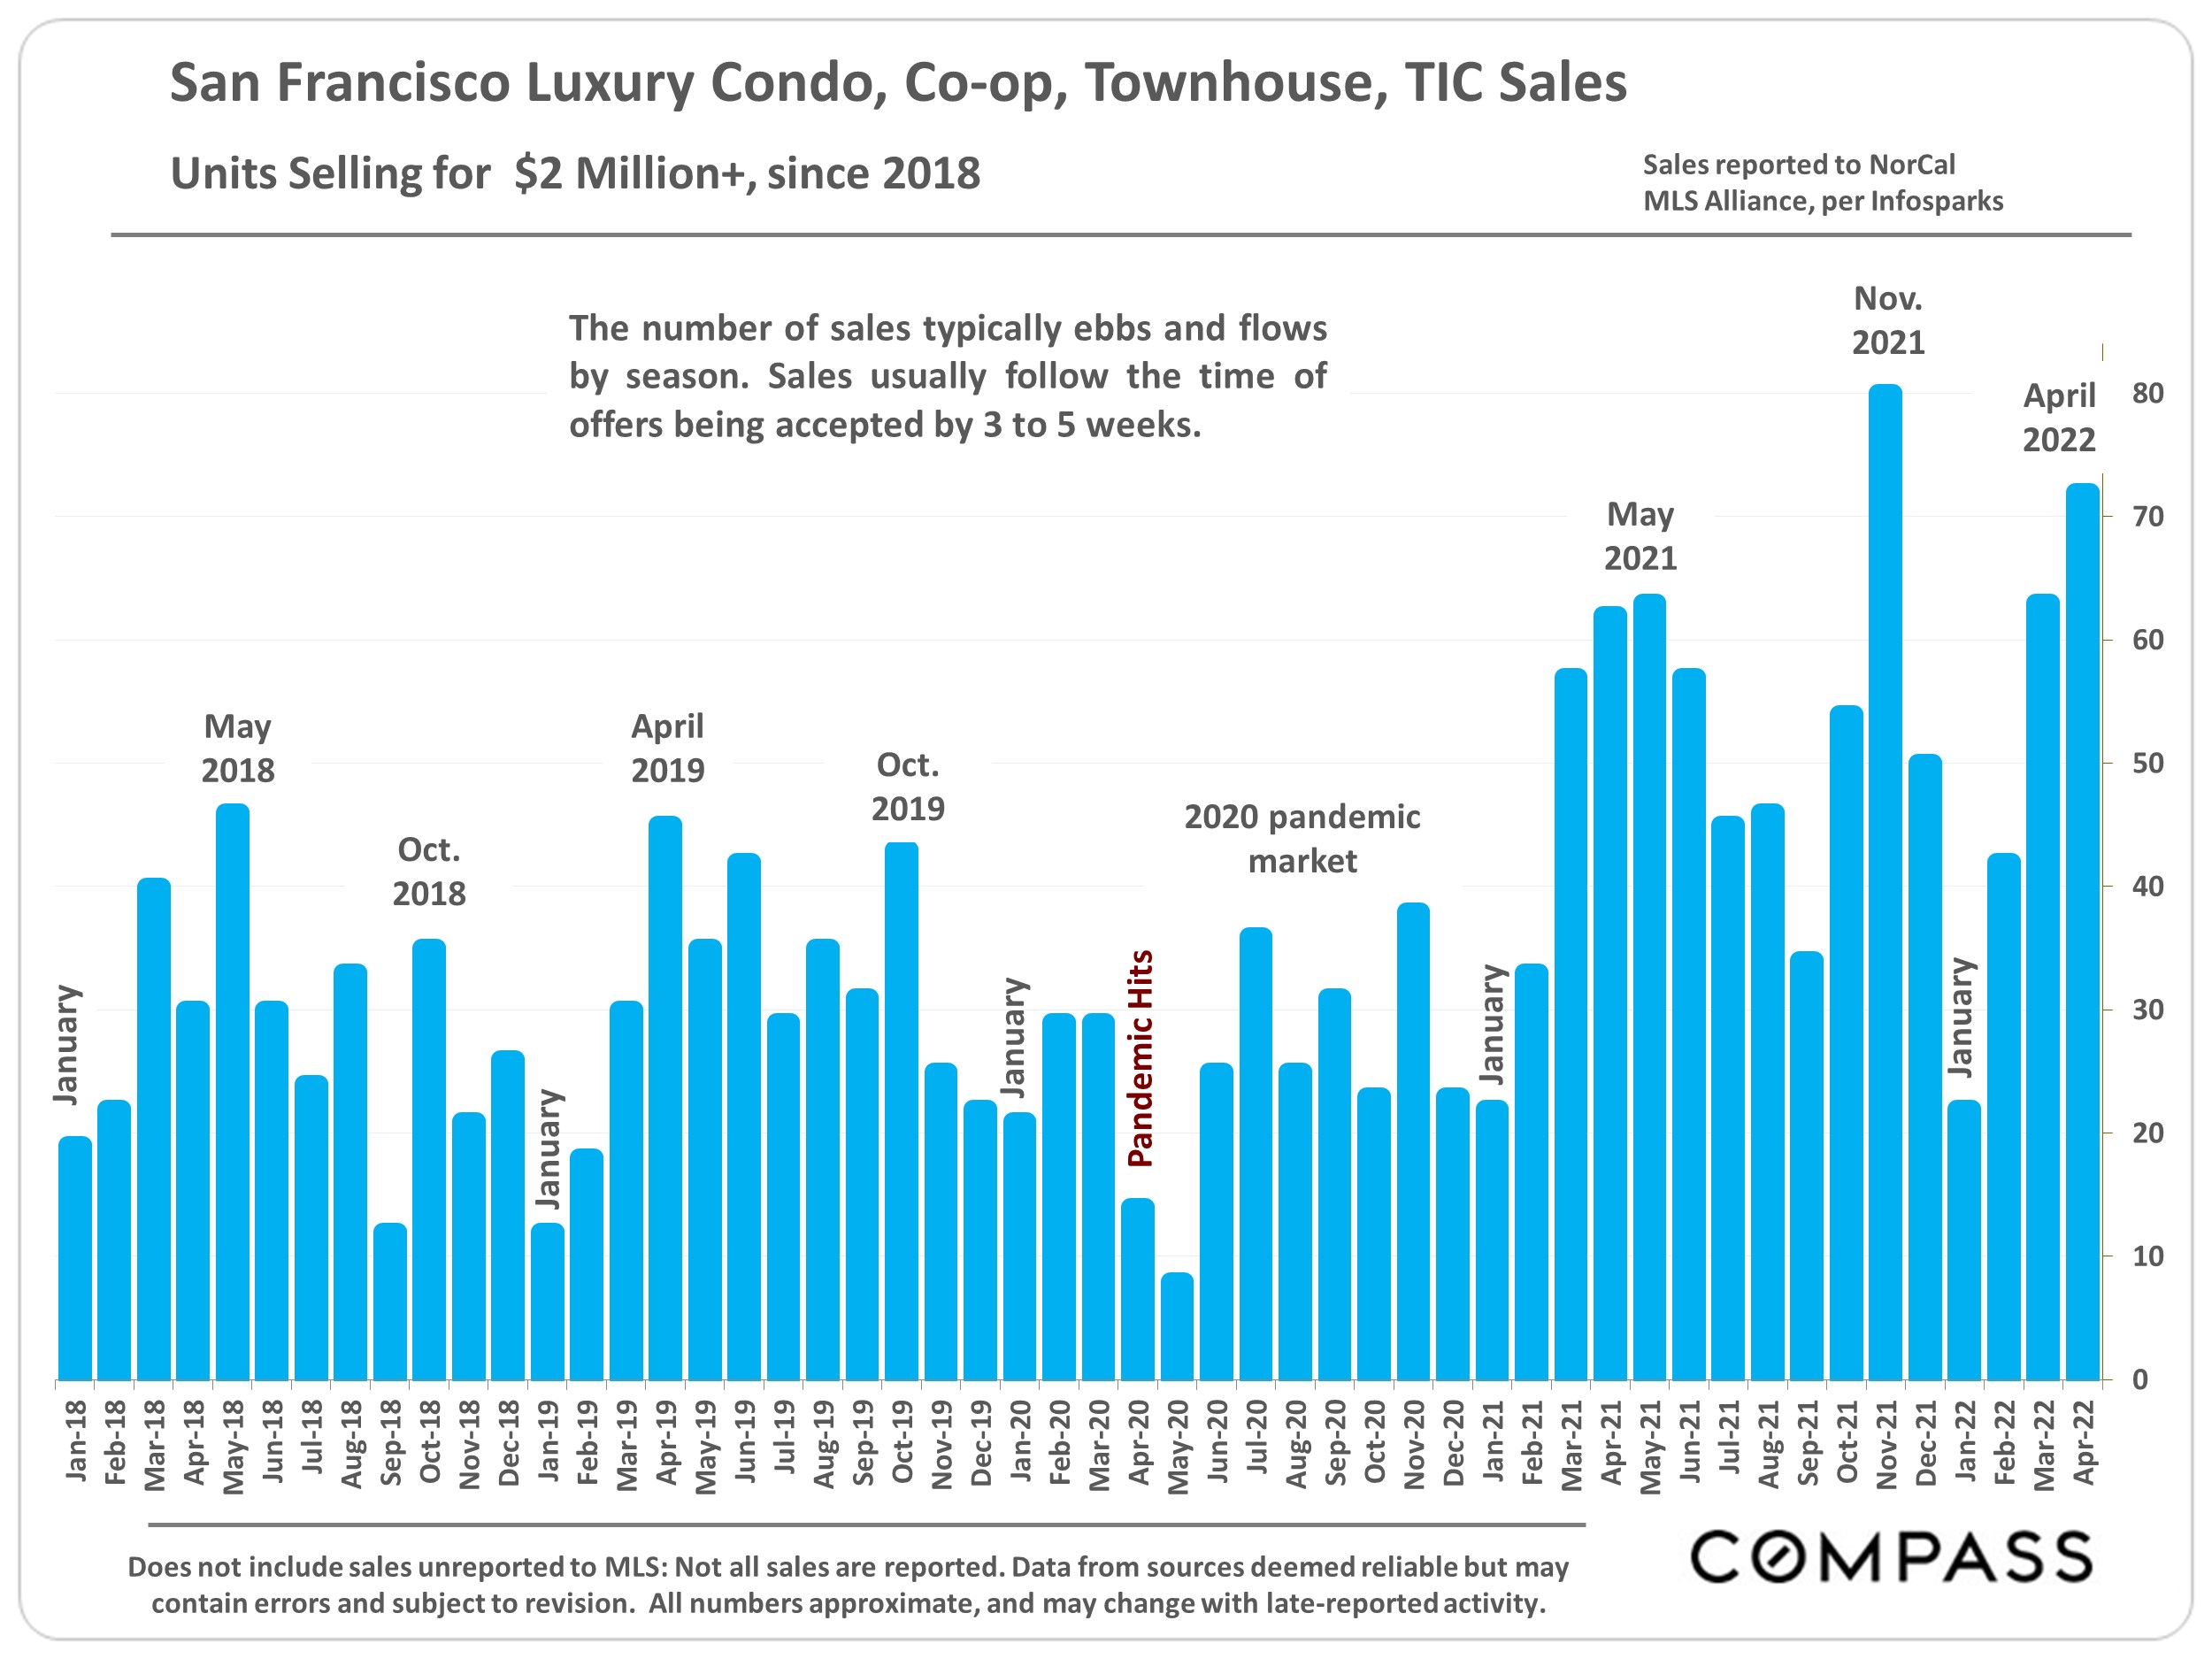
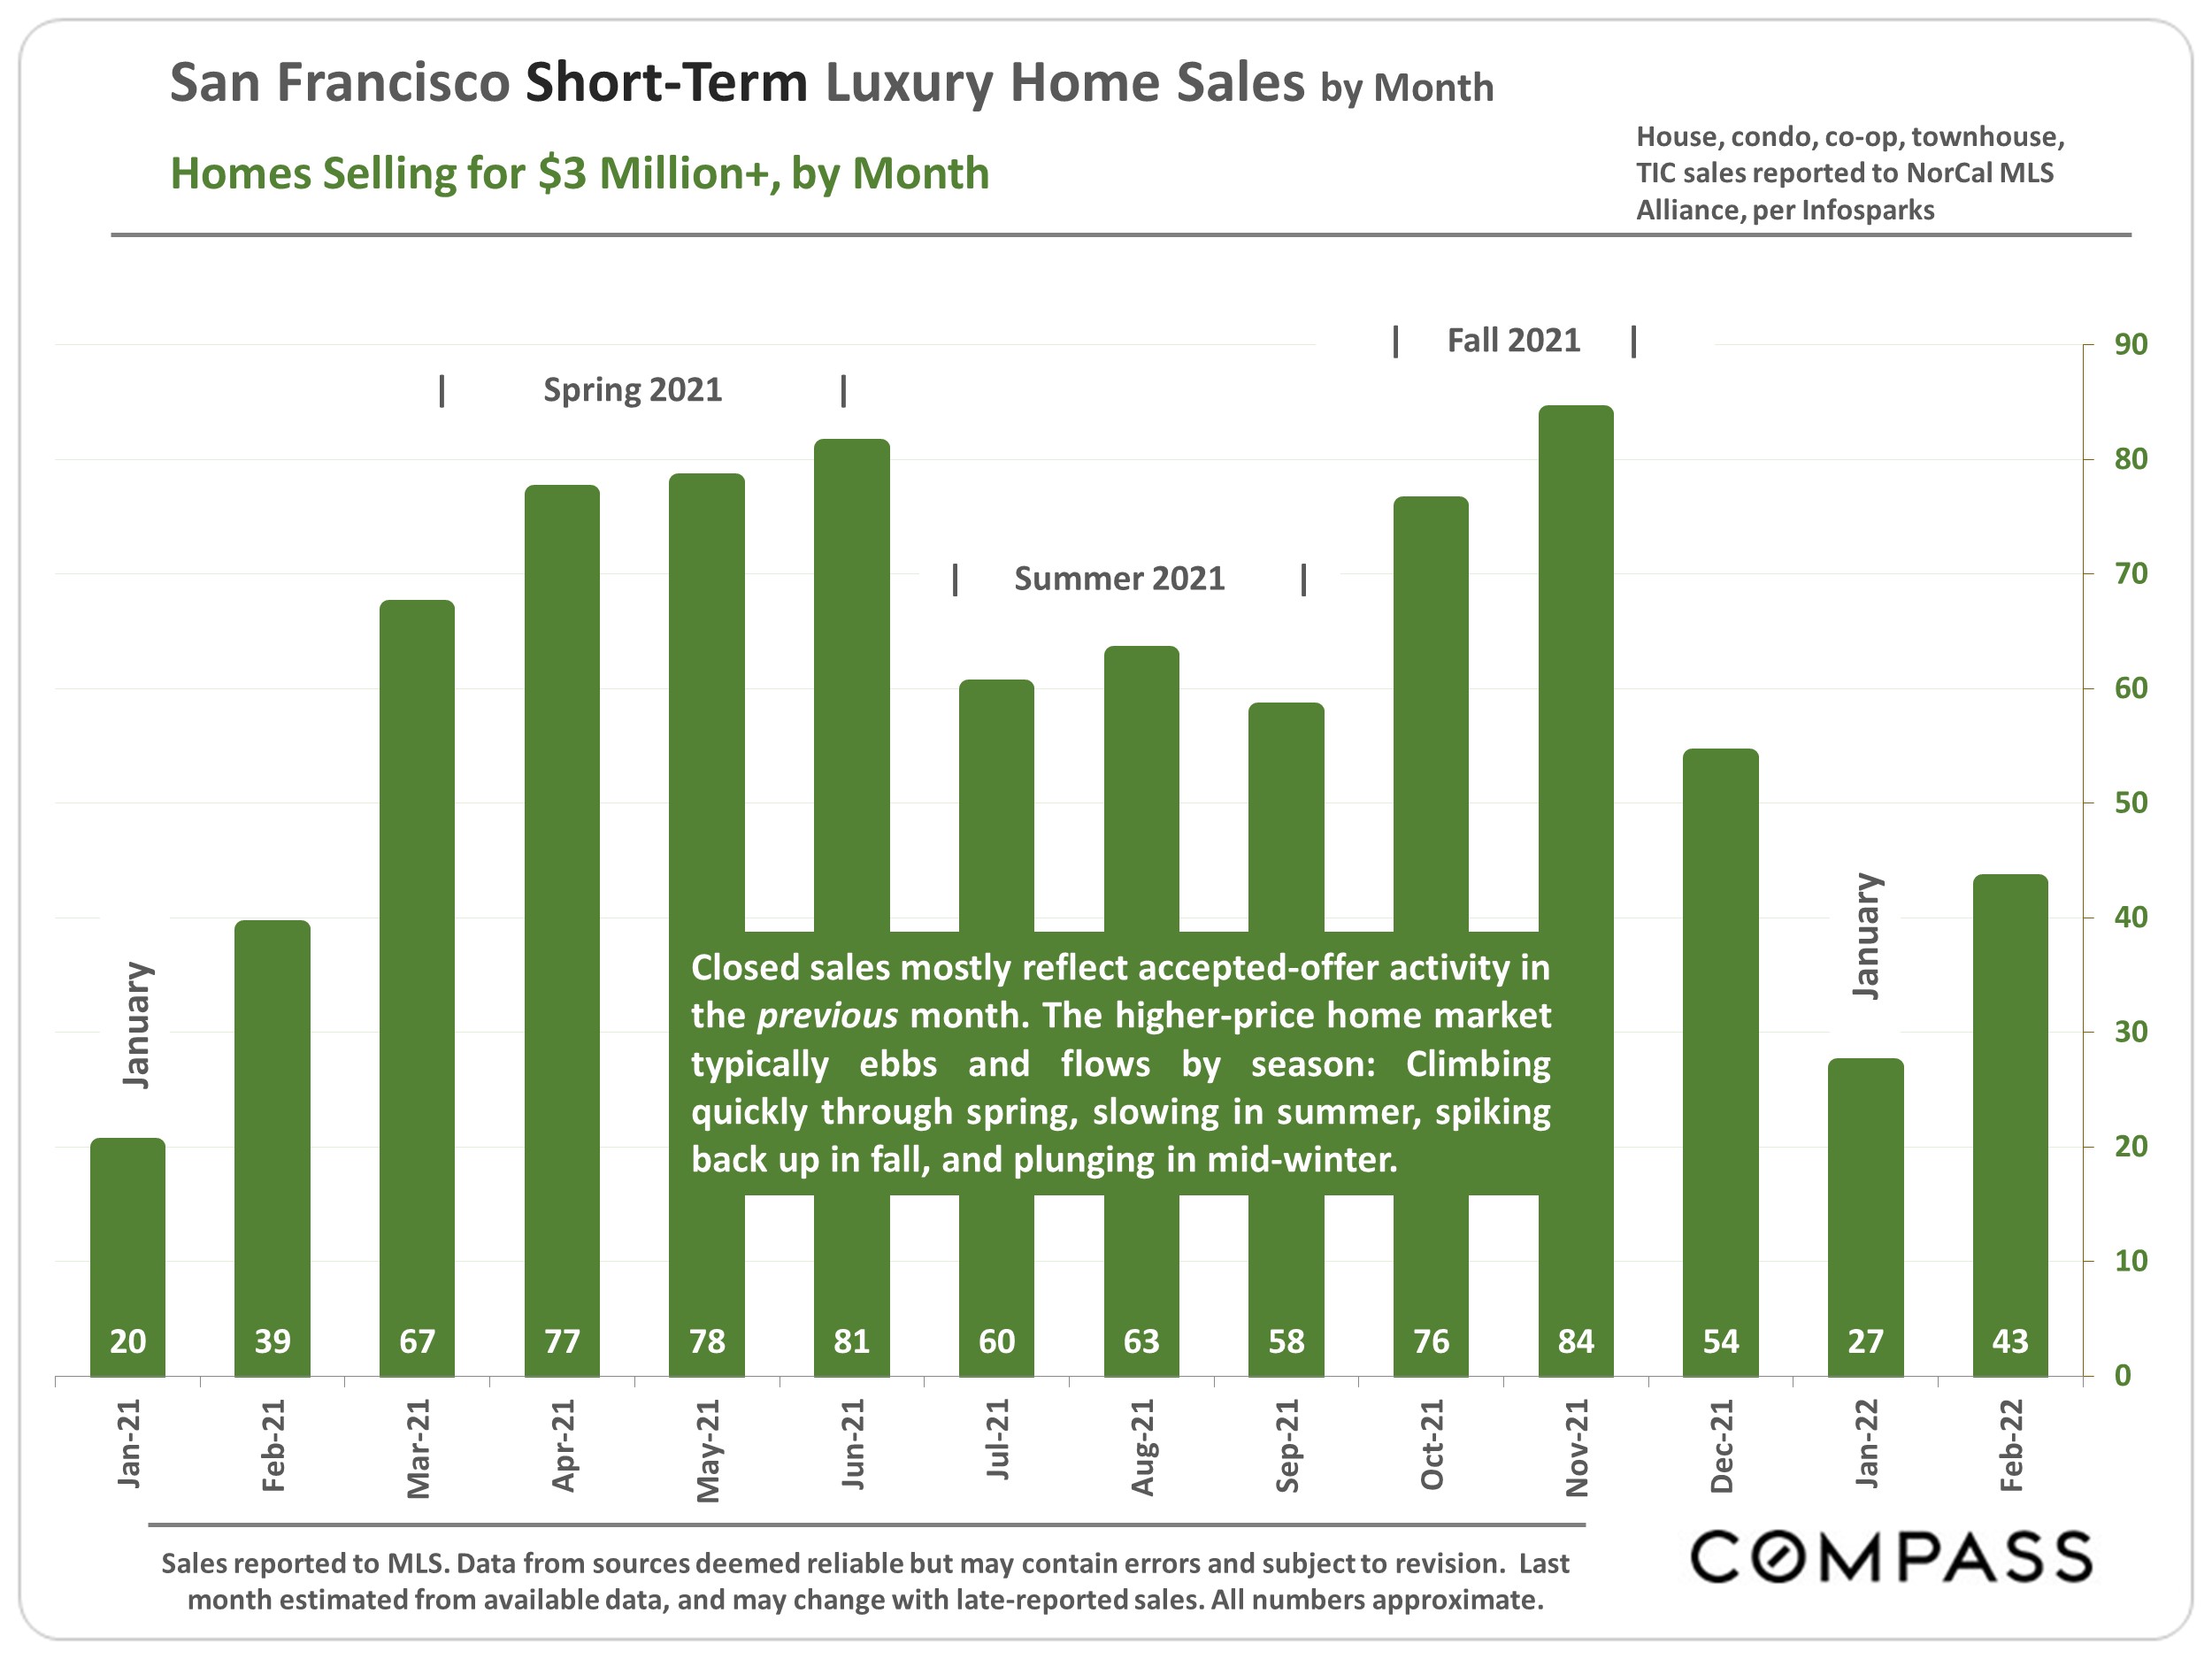
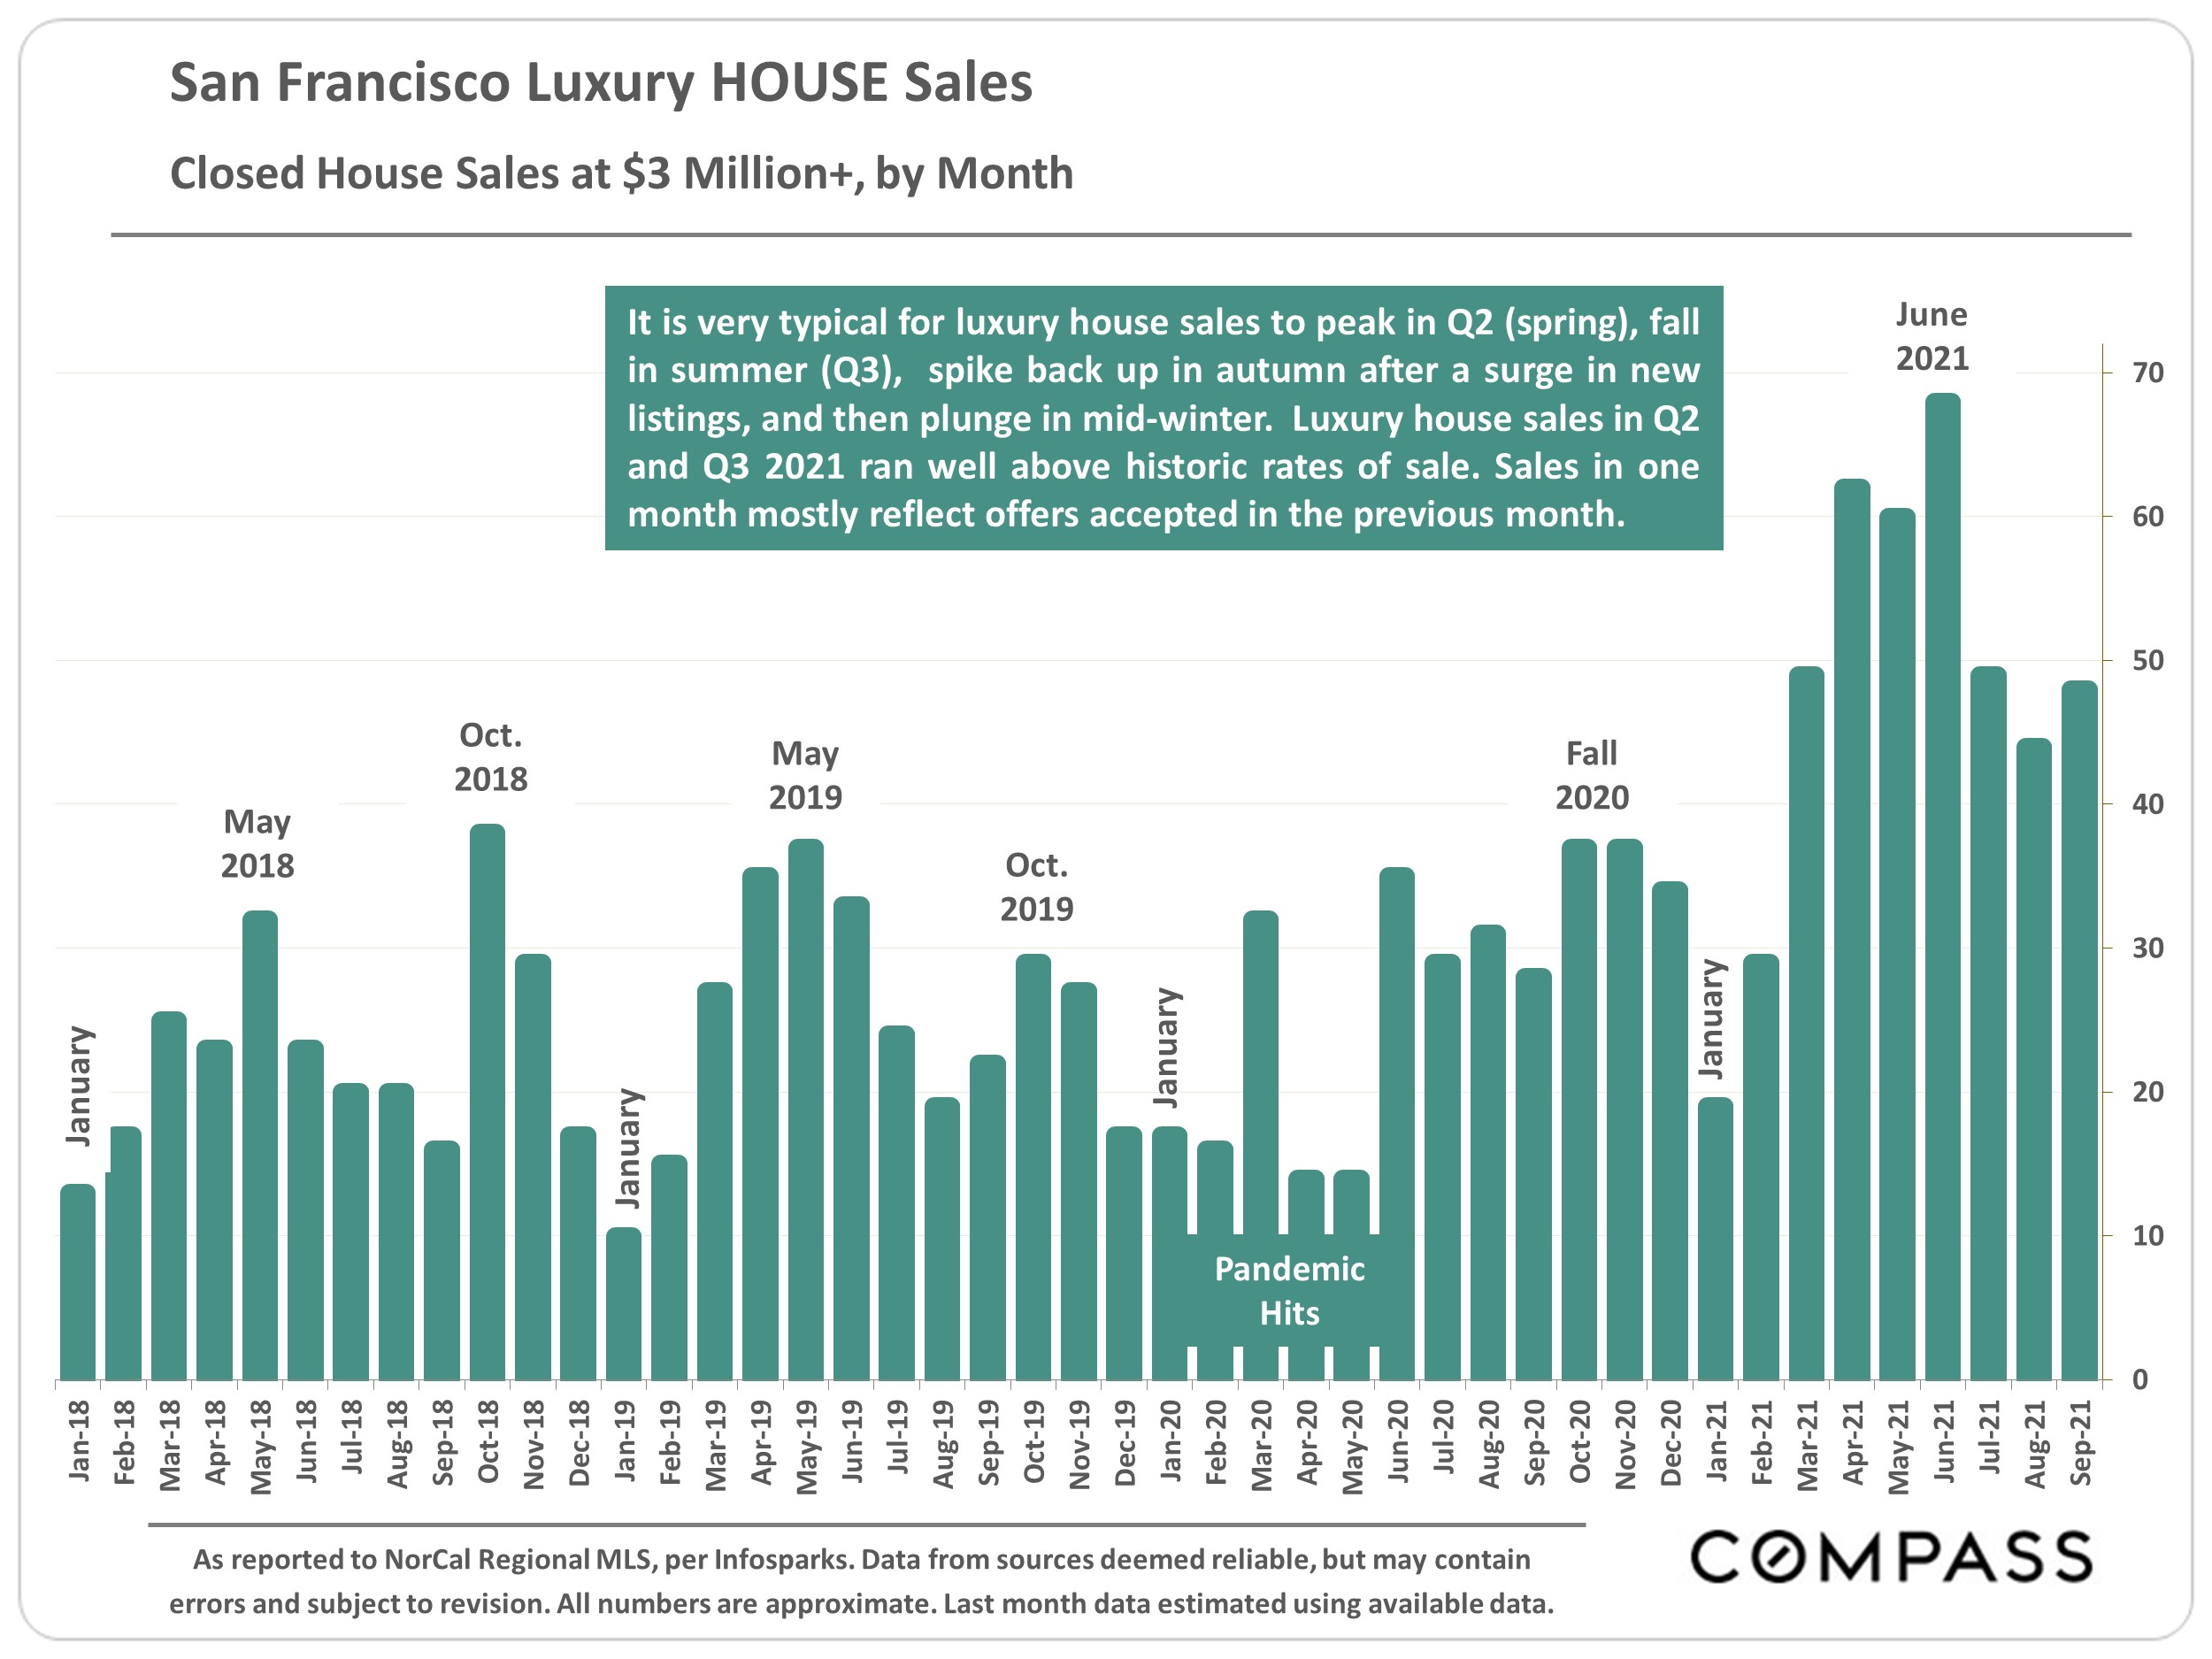
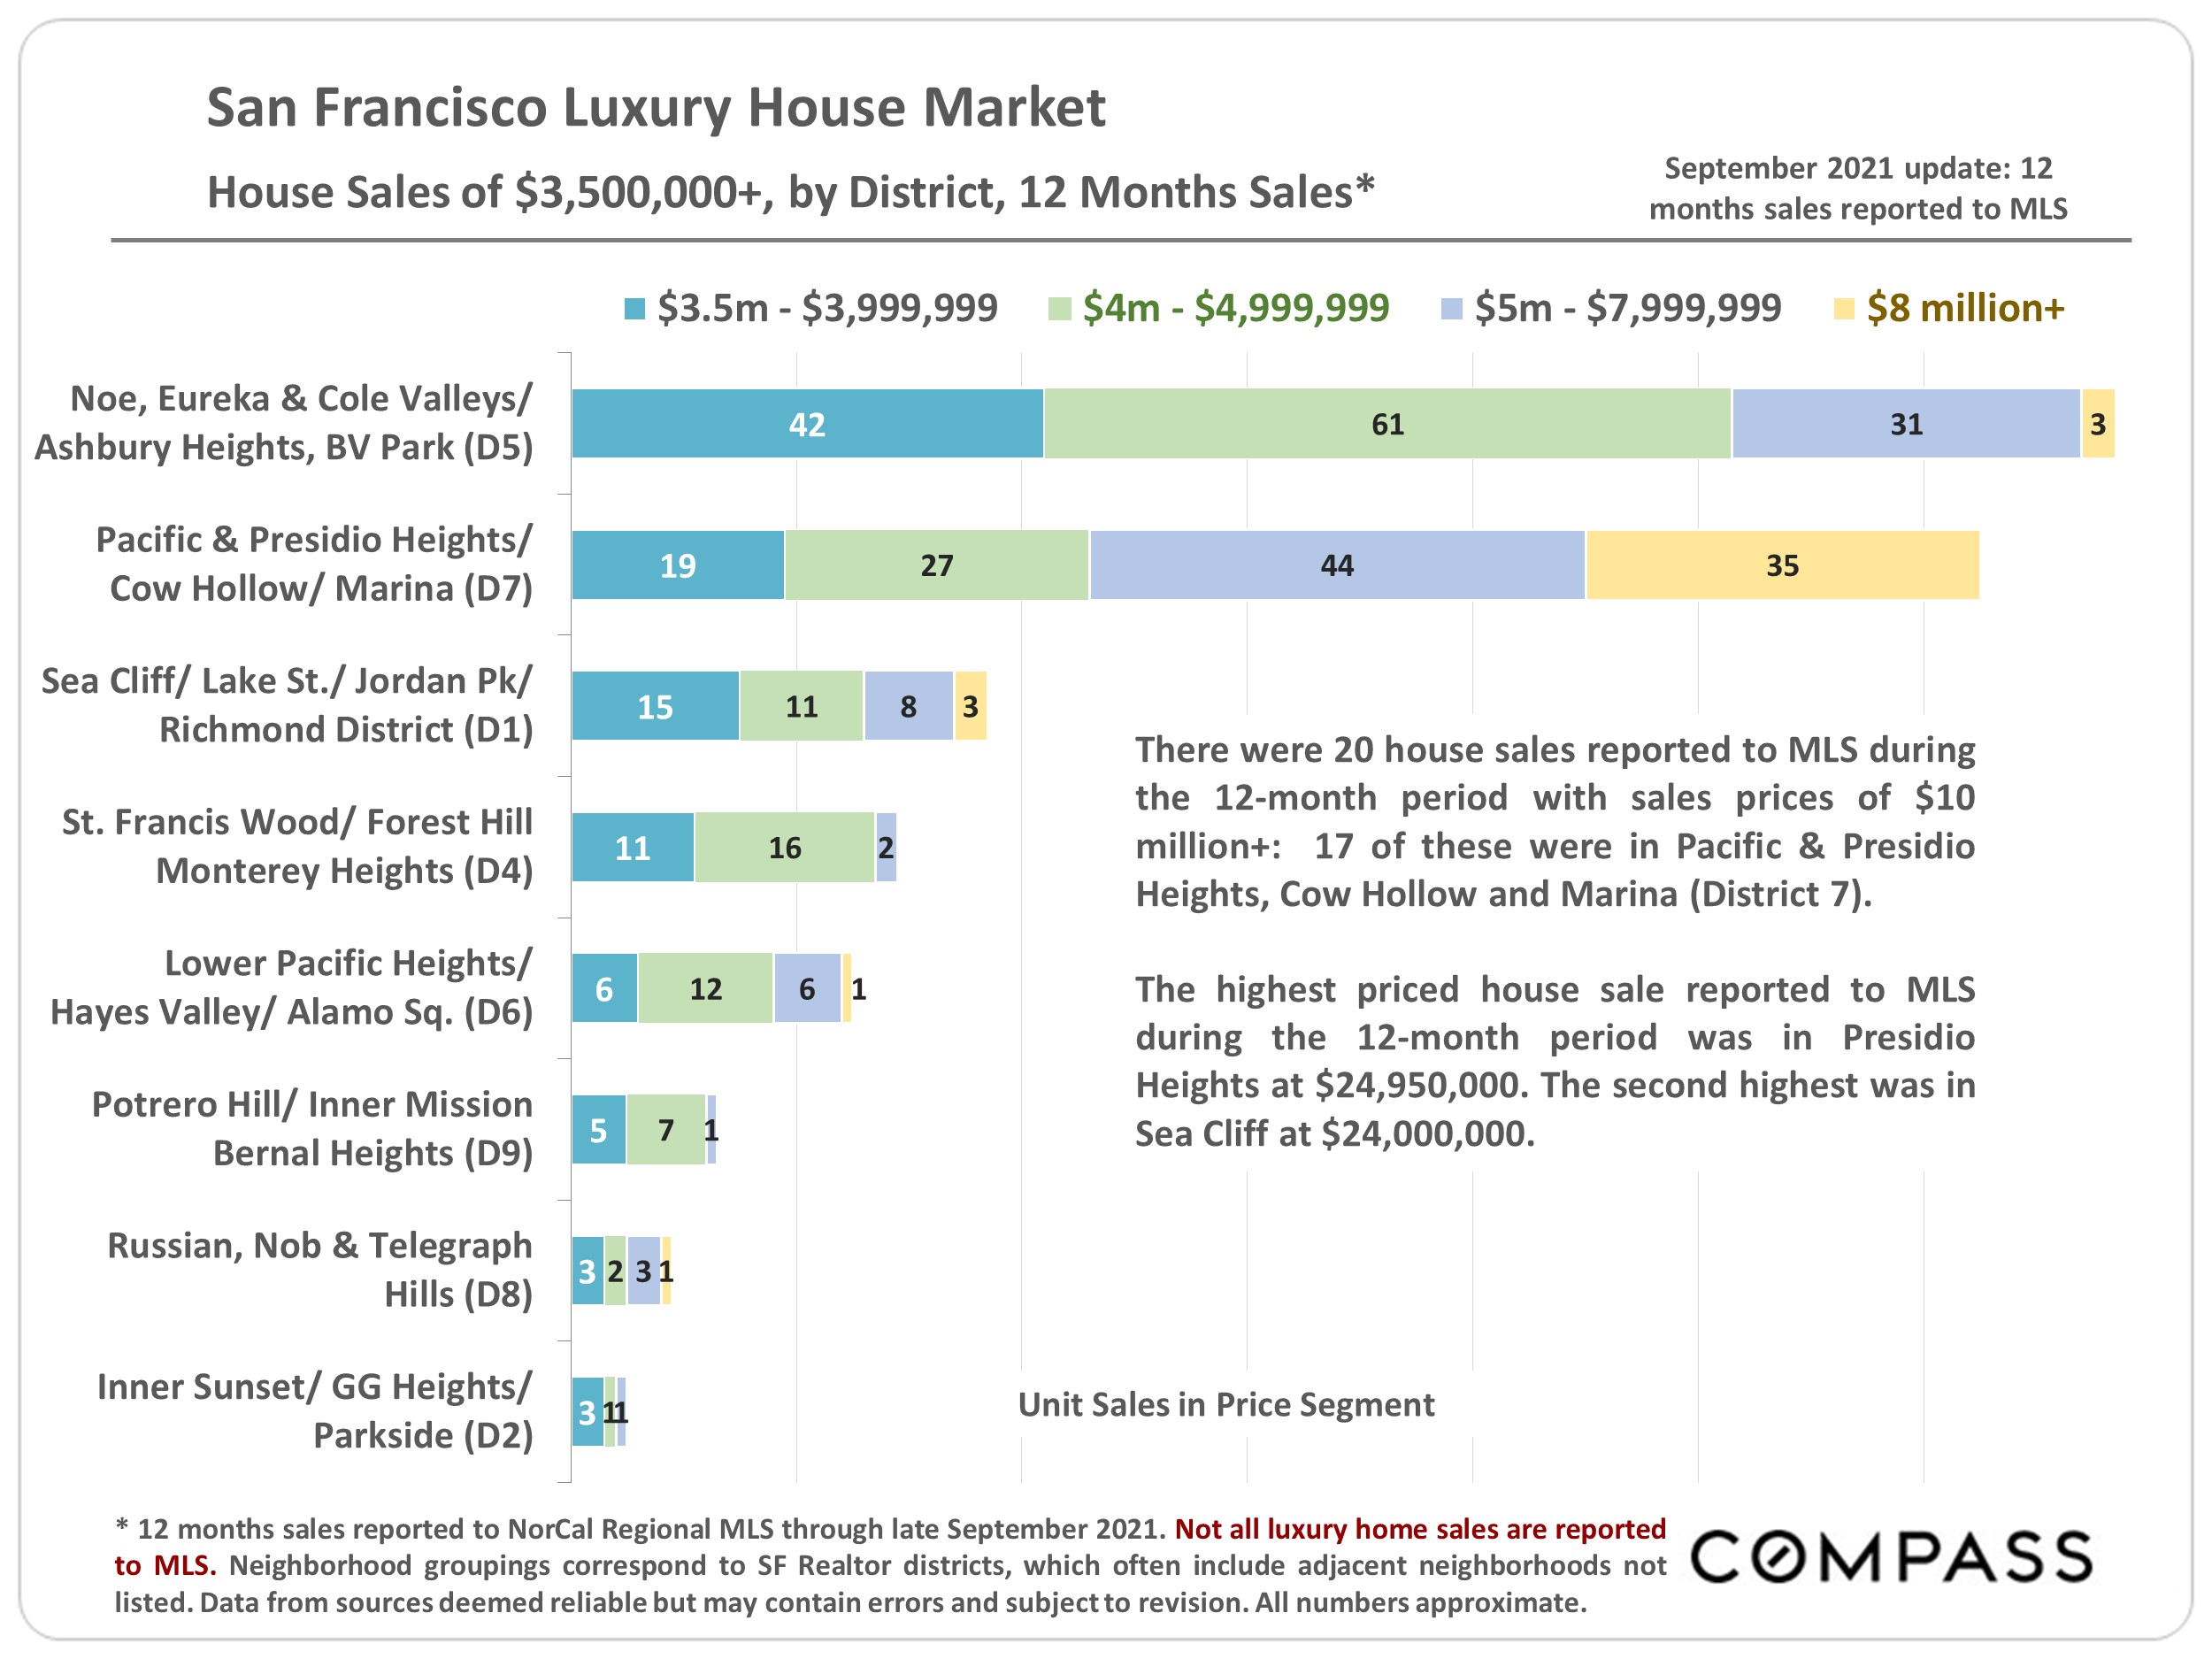
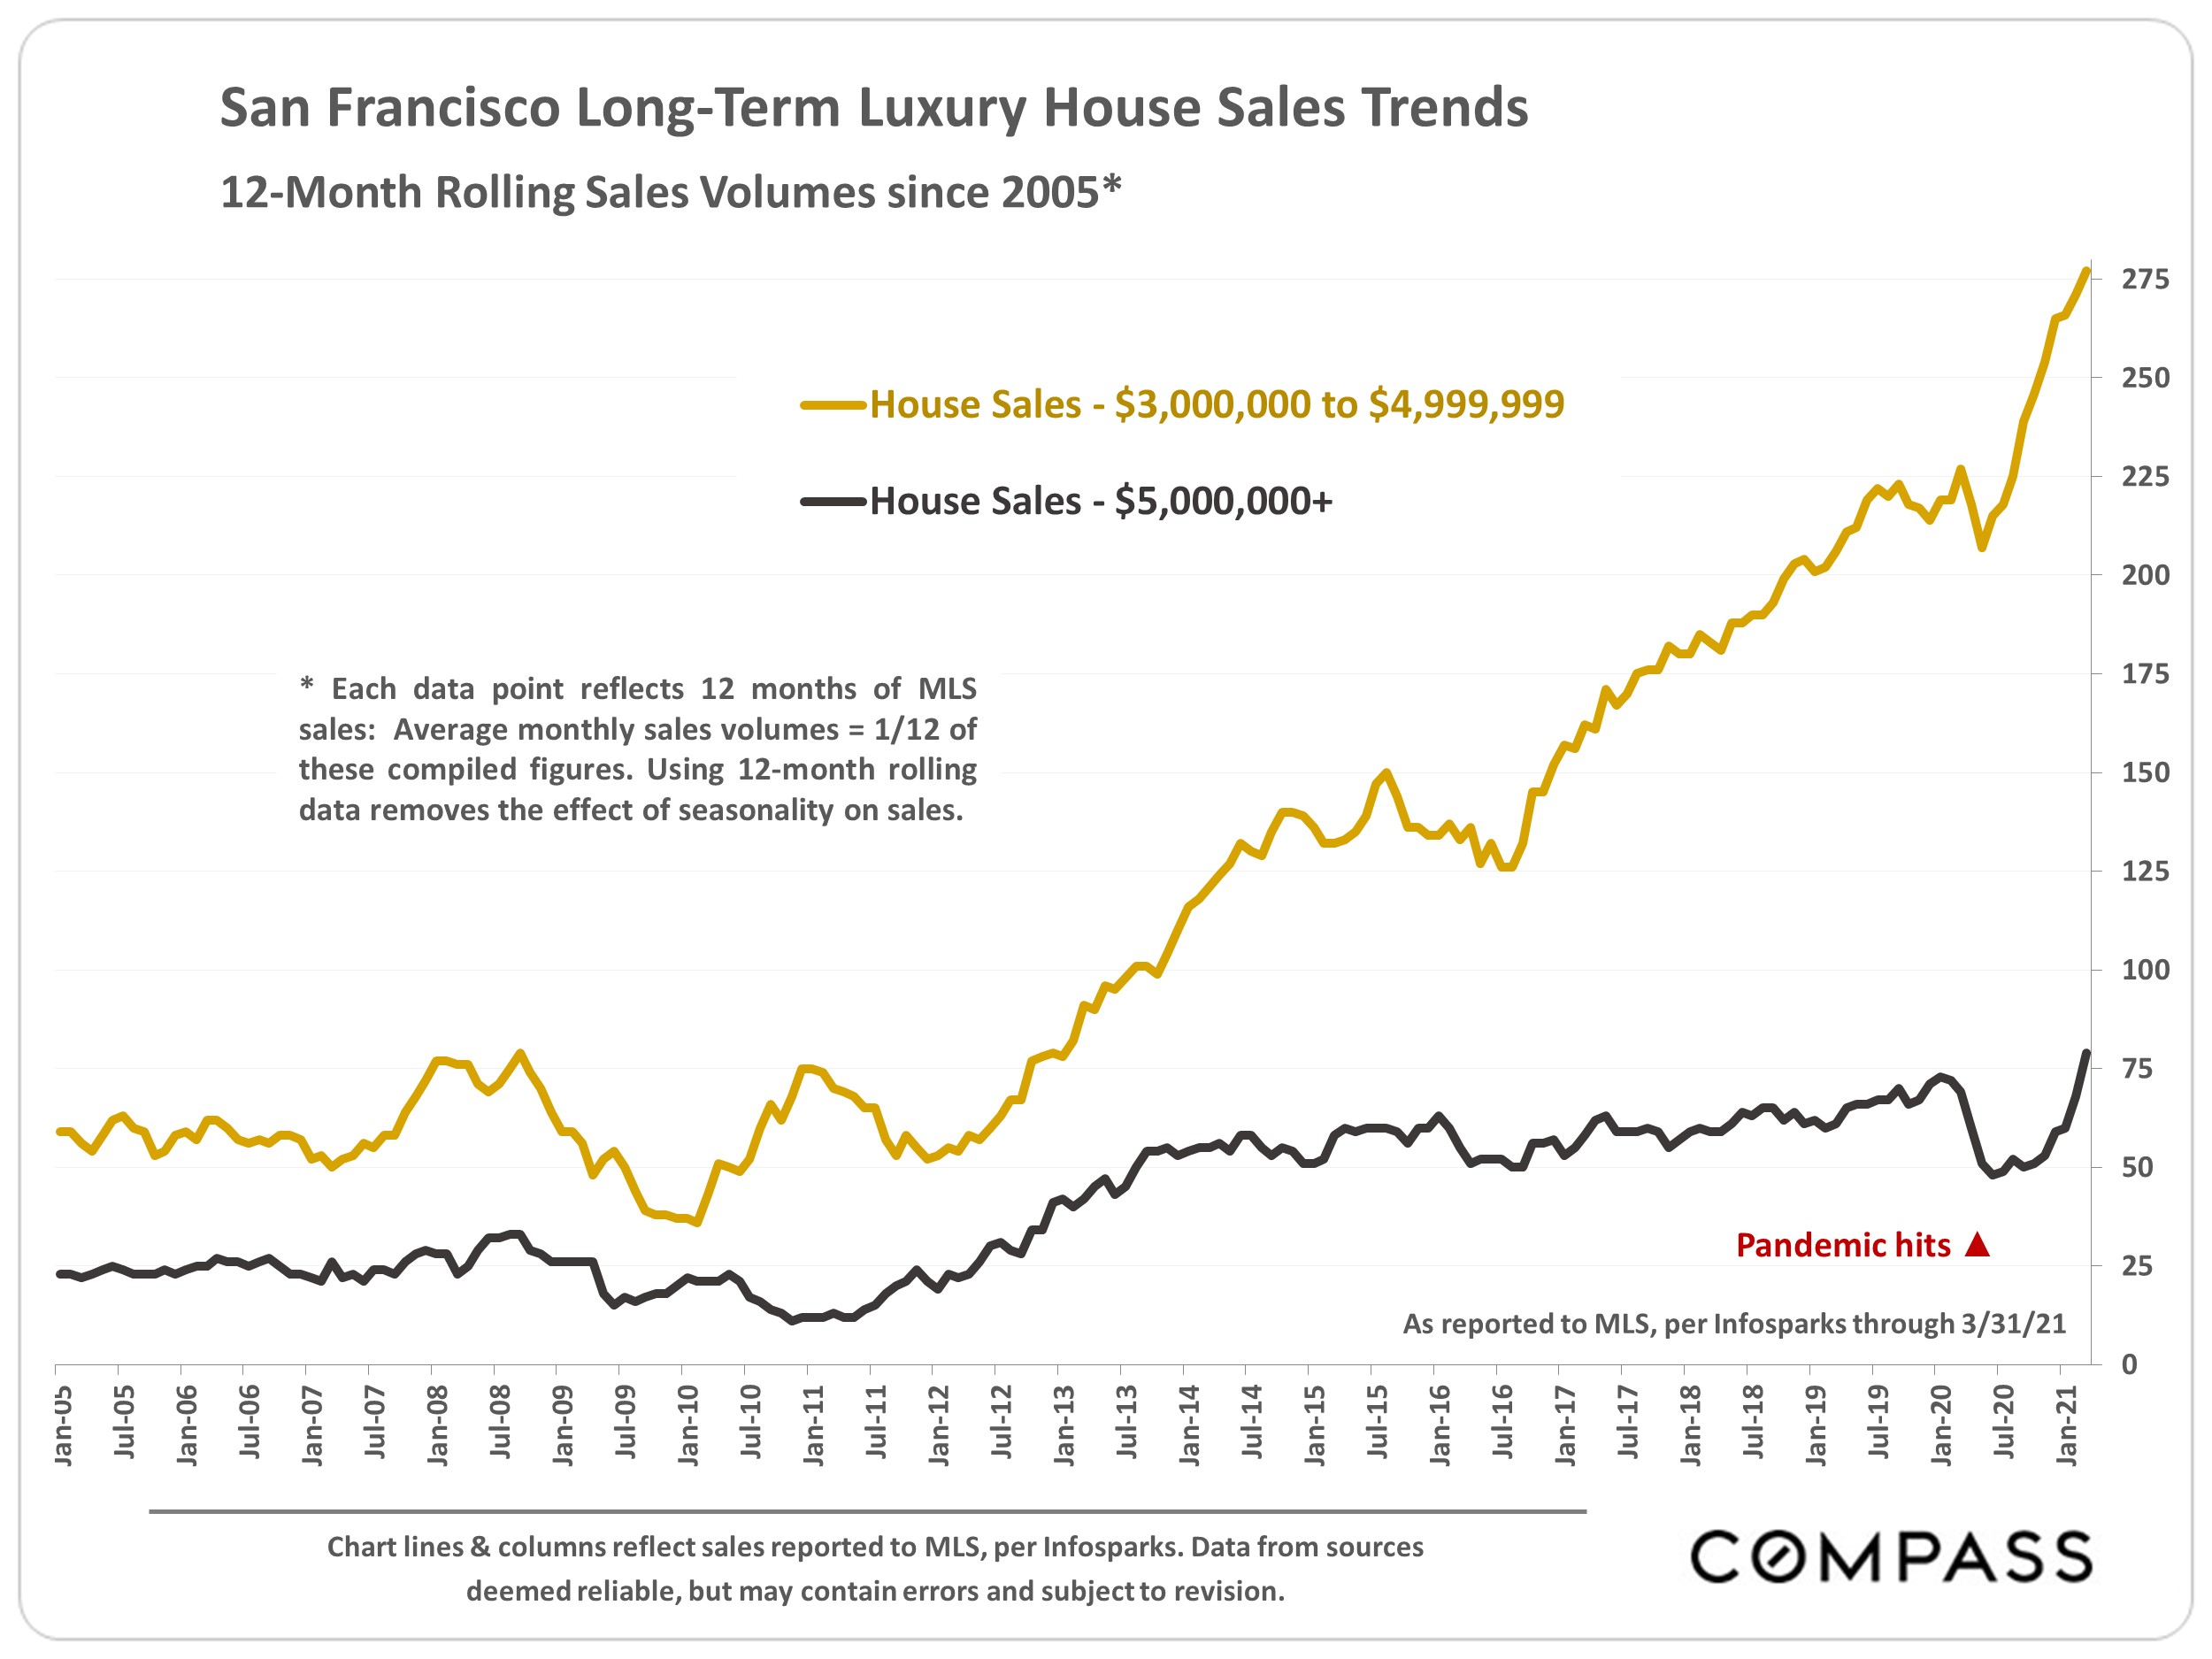
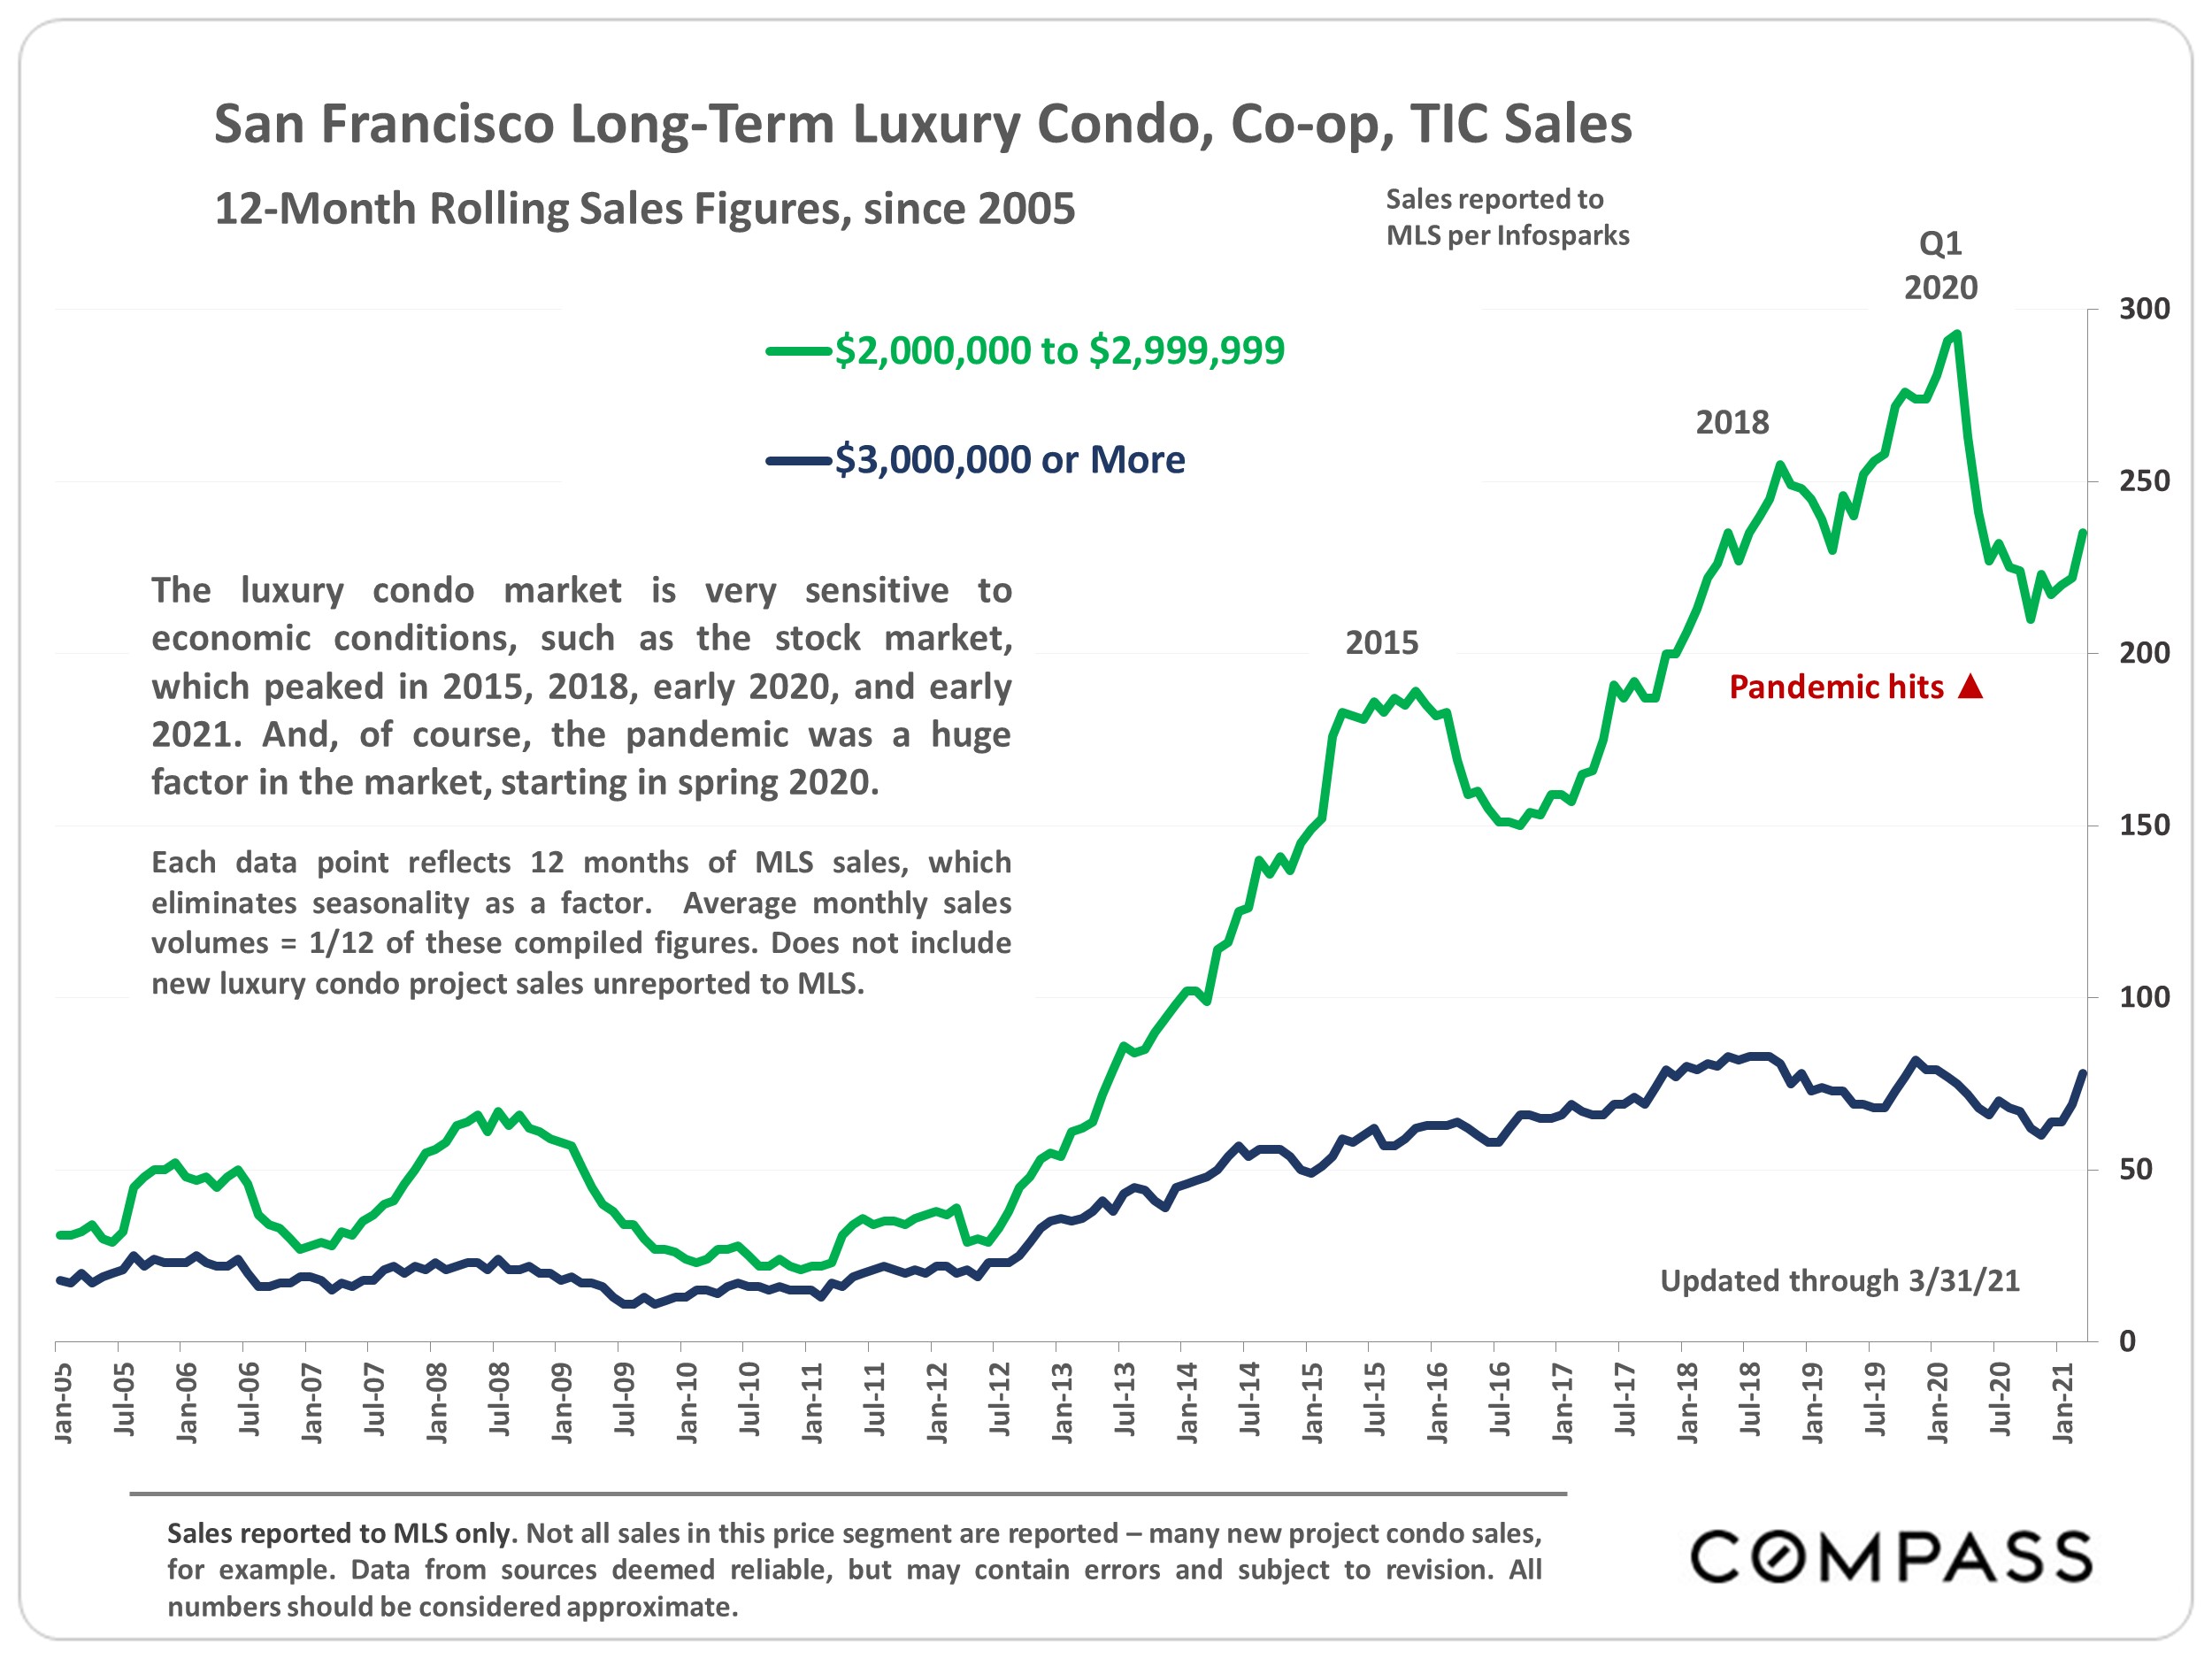
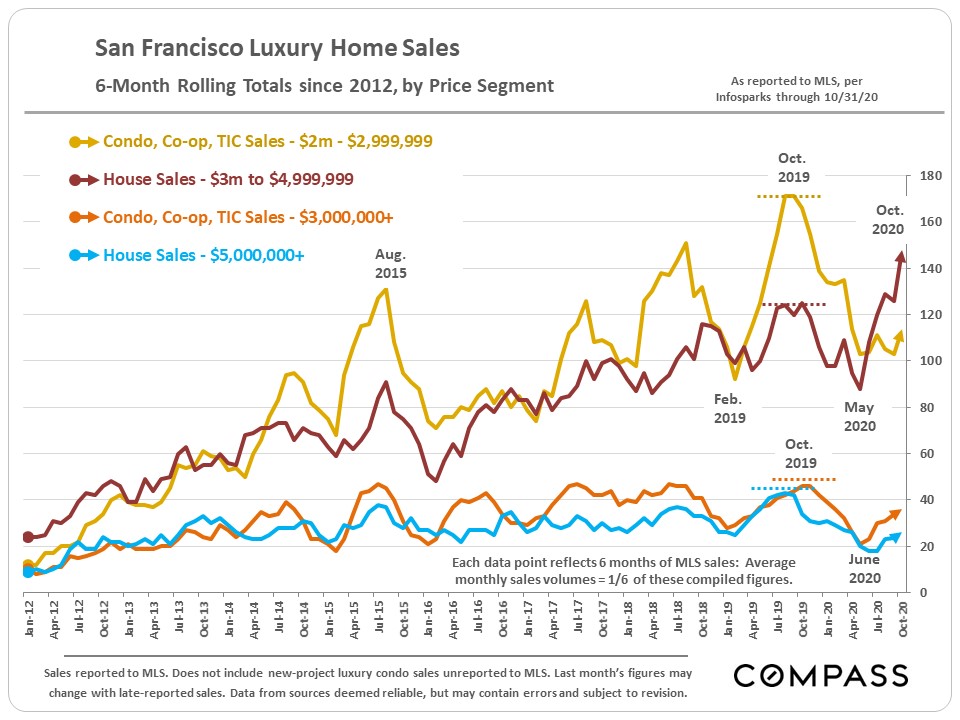
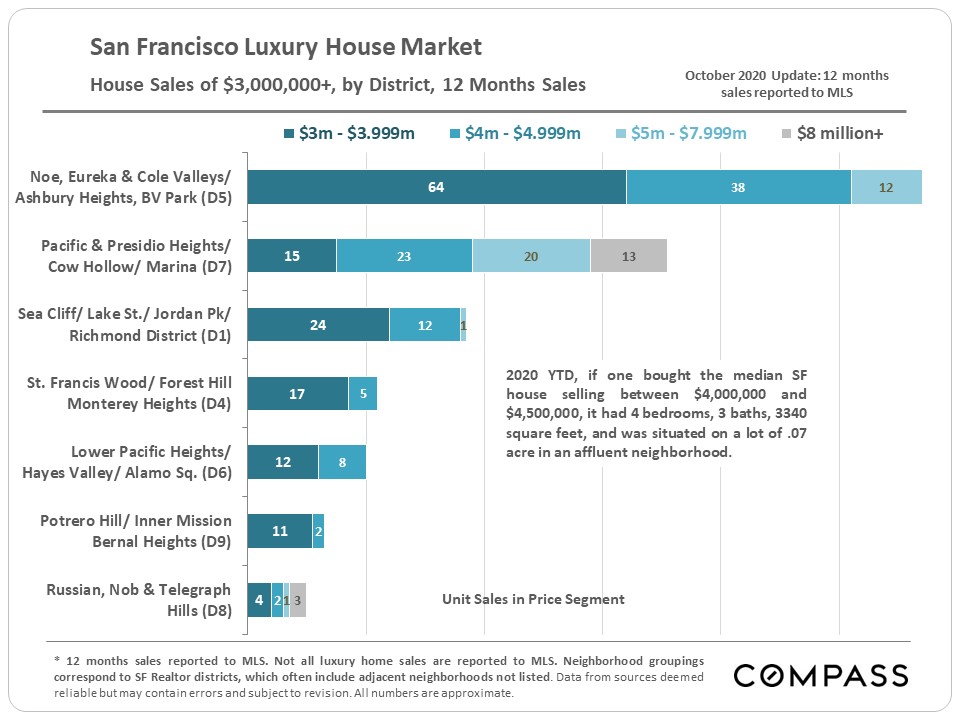
Luxury Home Sales by Property Type & Price Segment
Of the luxury home segments broken out in the chart below, the market for houses selling for $3,000,000 to $4,999,999 (red line) has rebounded very strongly over the past 6 months, hitting a new peak in sales (on a 6-month rolling basis). The other segments – luxury condos and co-ops, and $5m+ houses – have seen much smaller rebounds from shelter-in-place lows, and remain far below previous peaks.
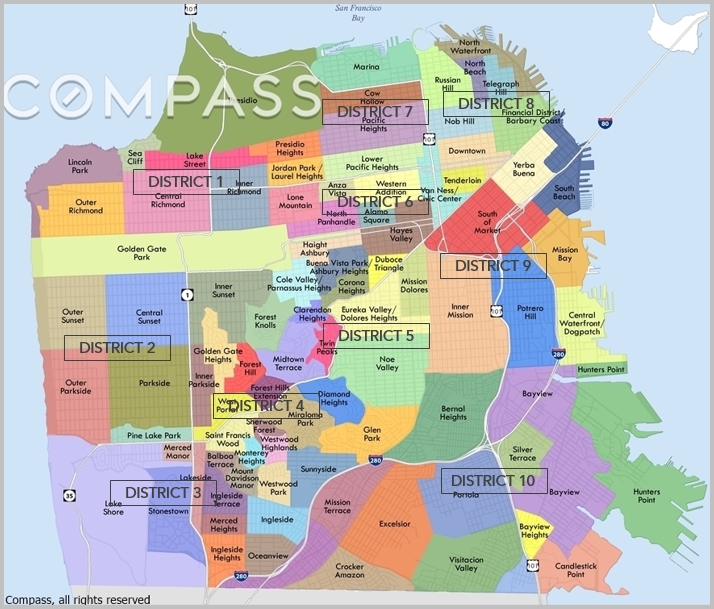
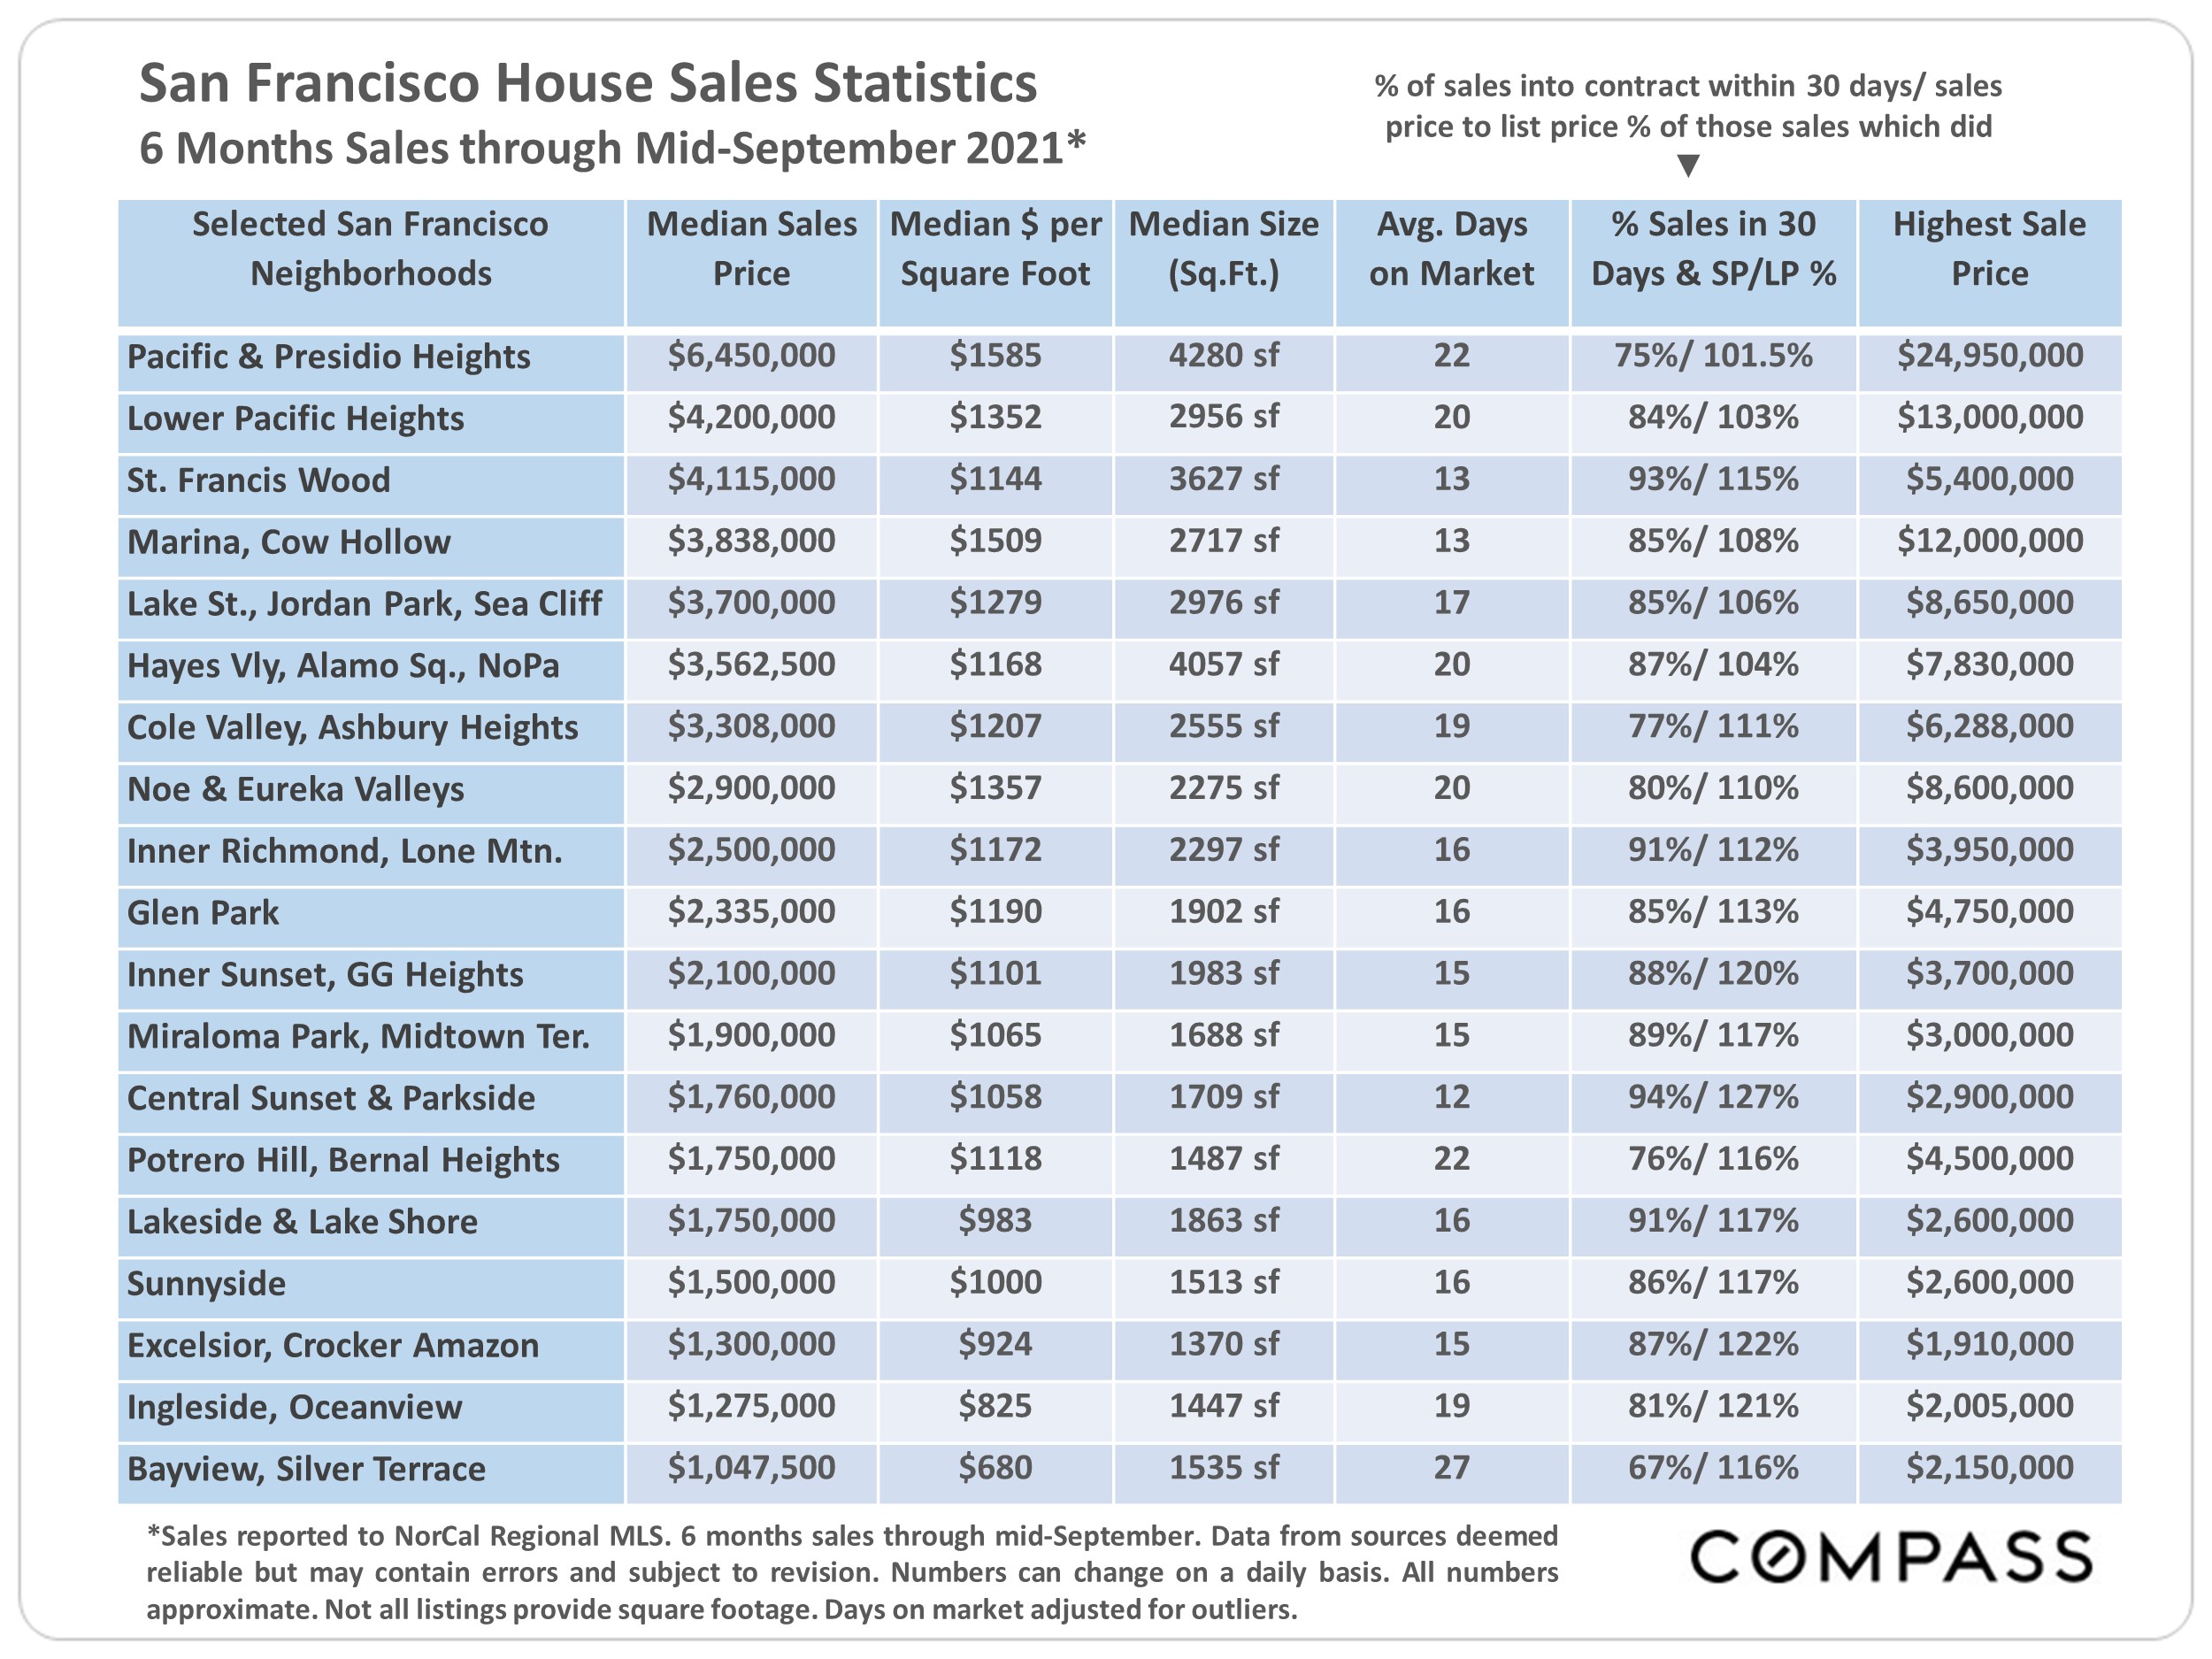
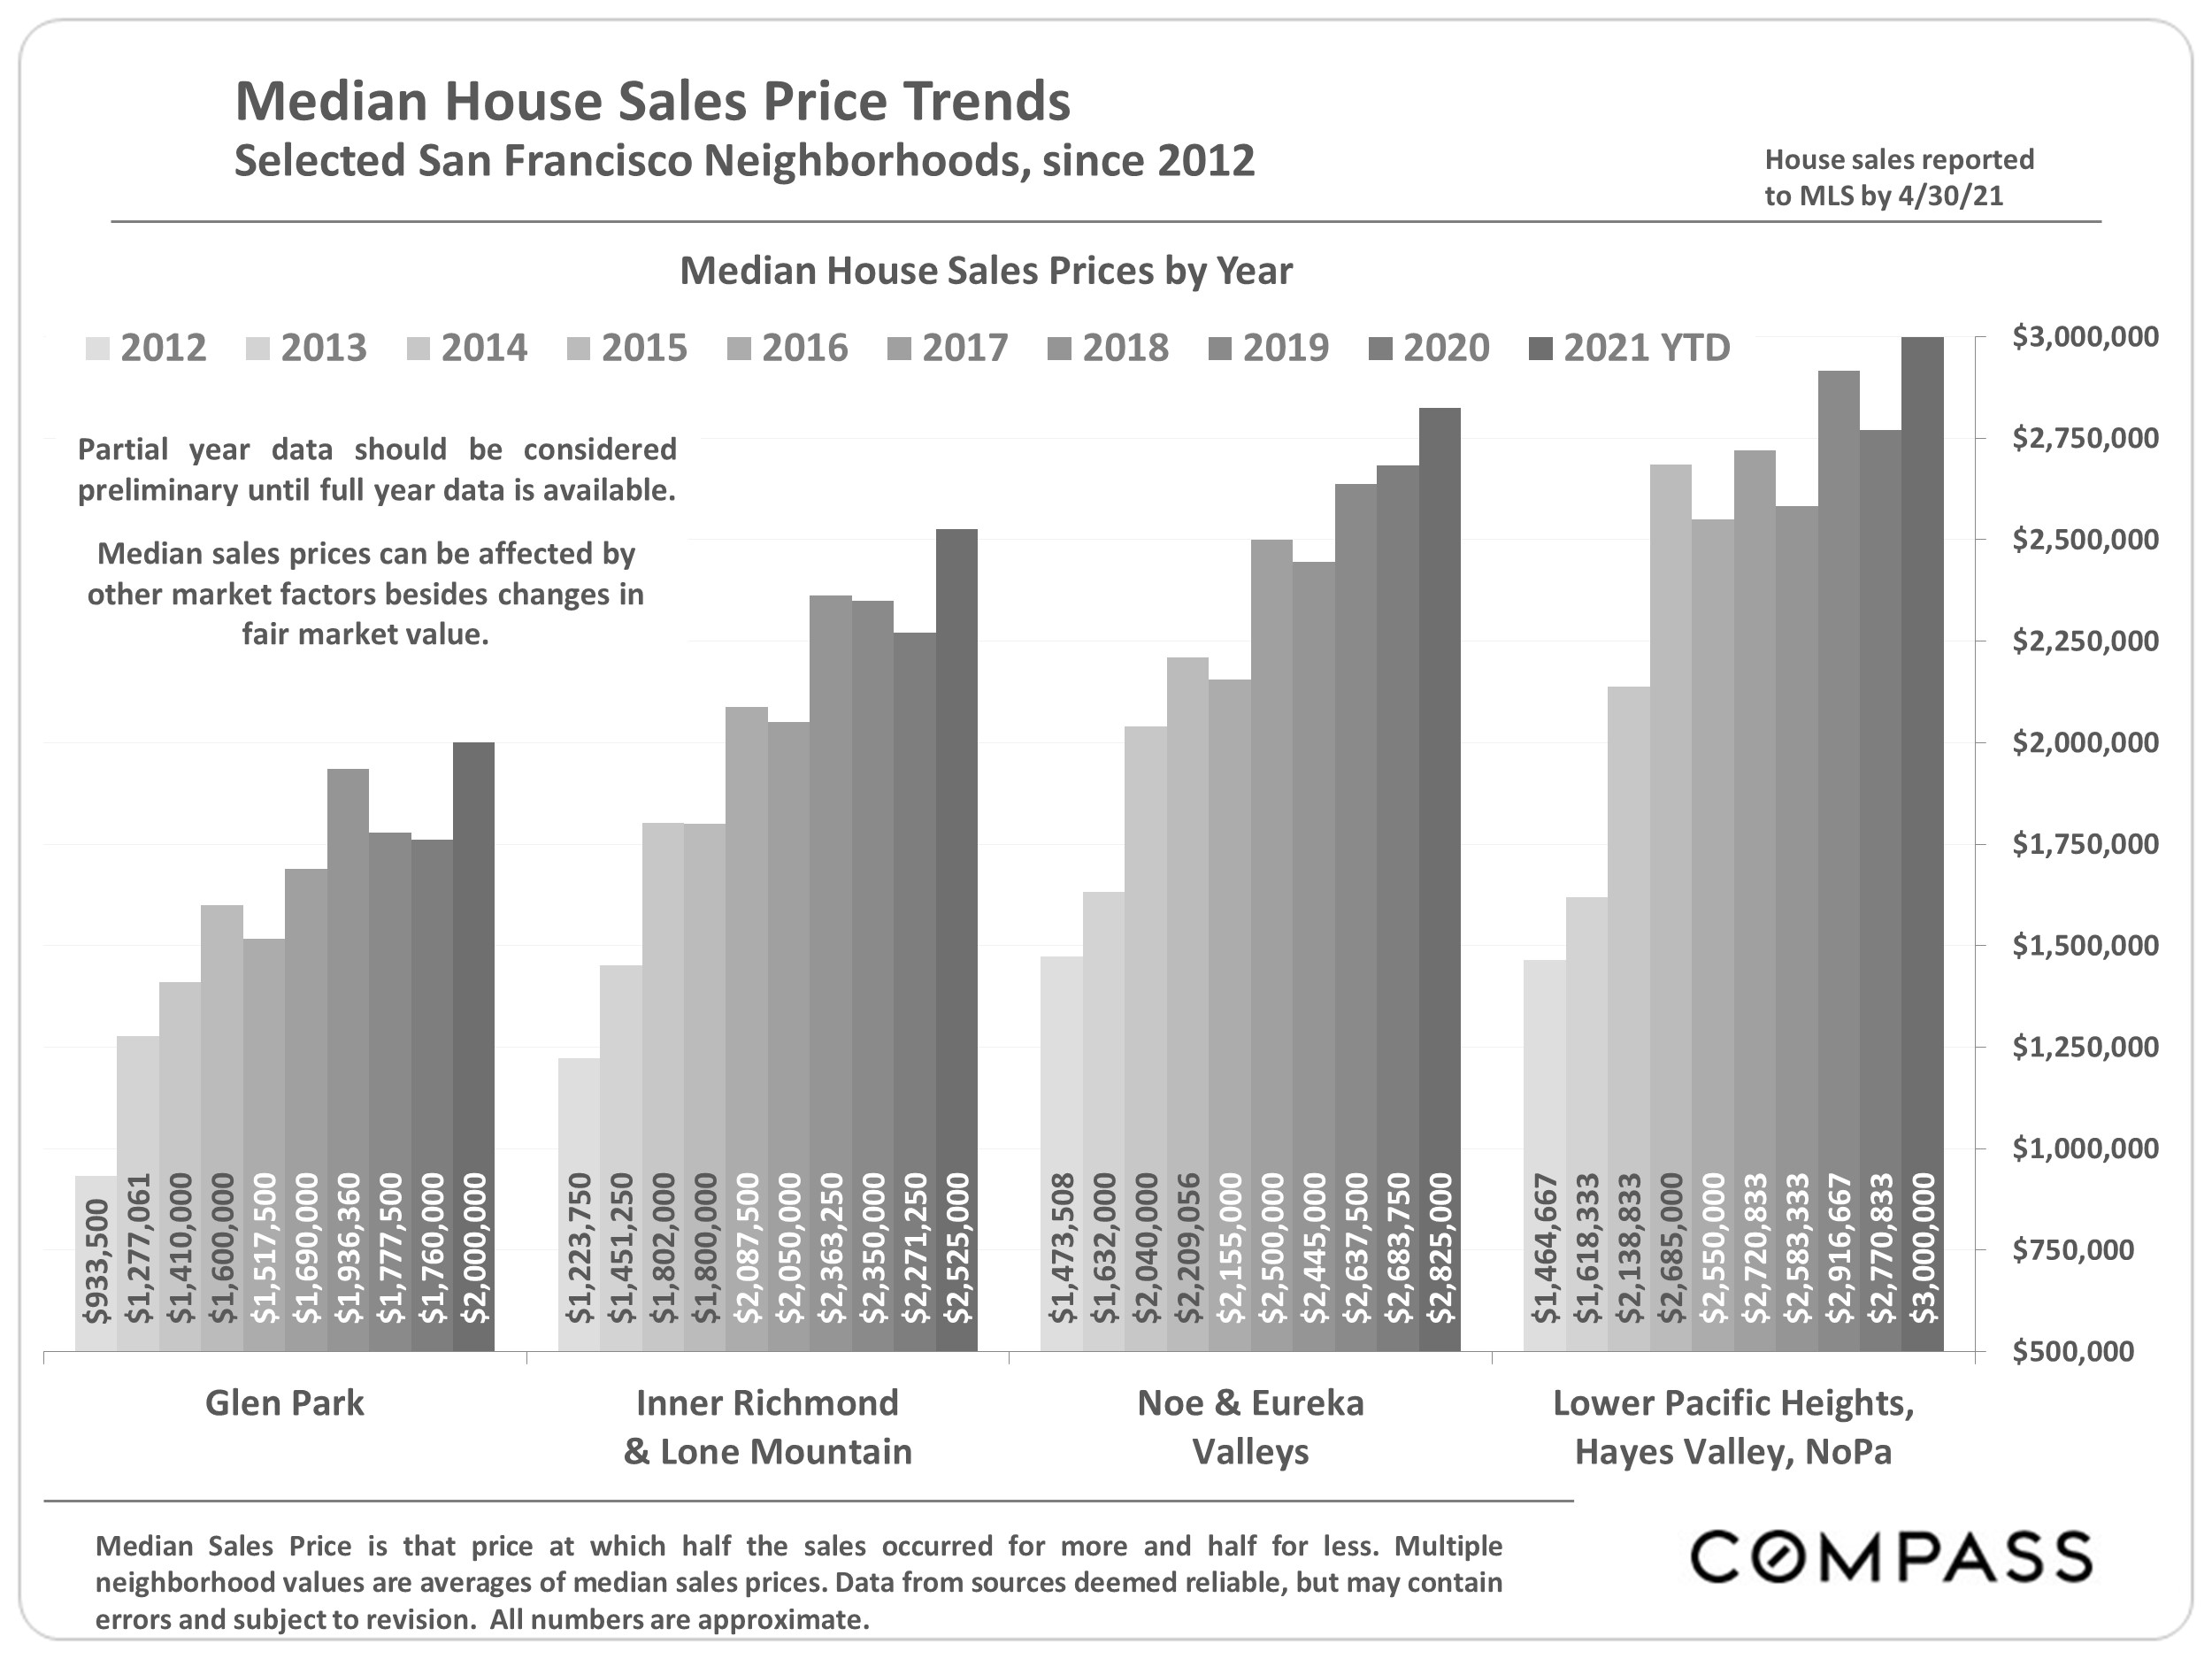
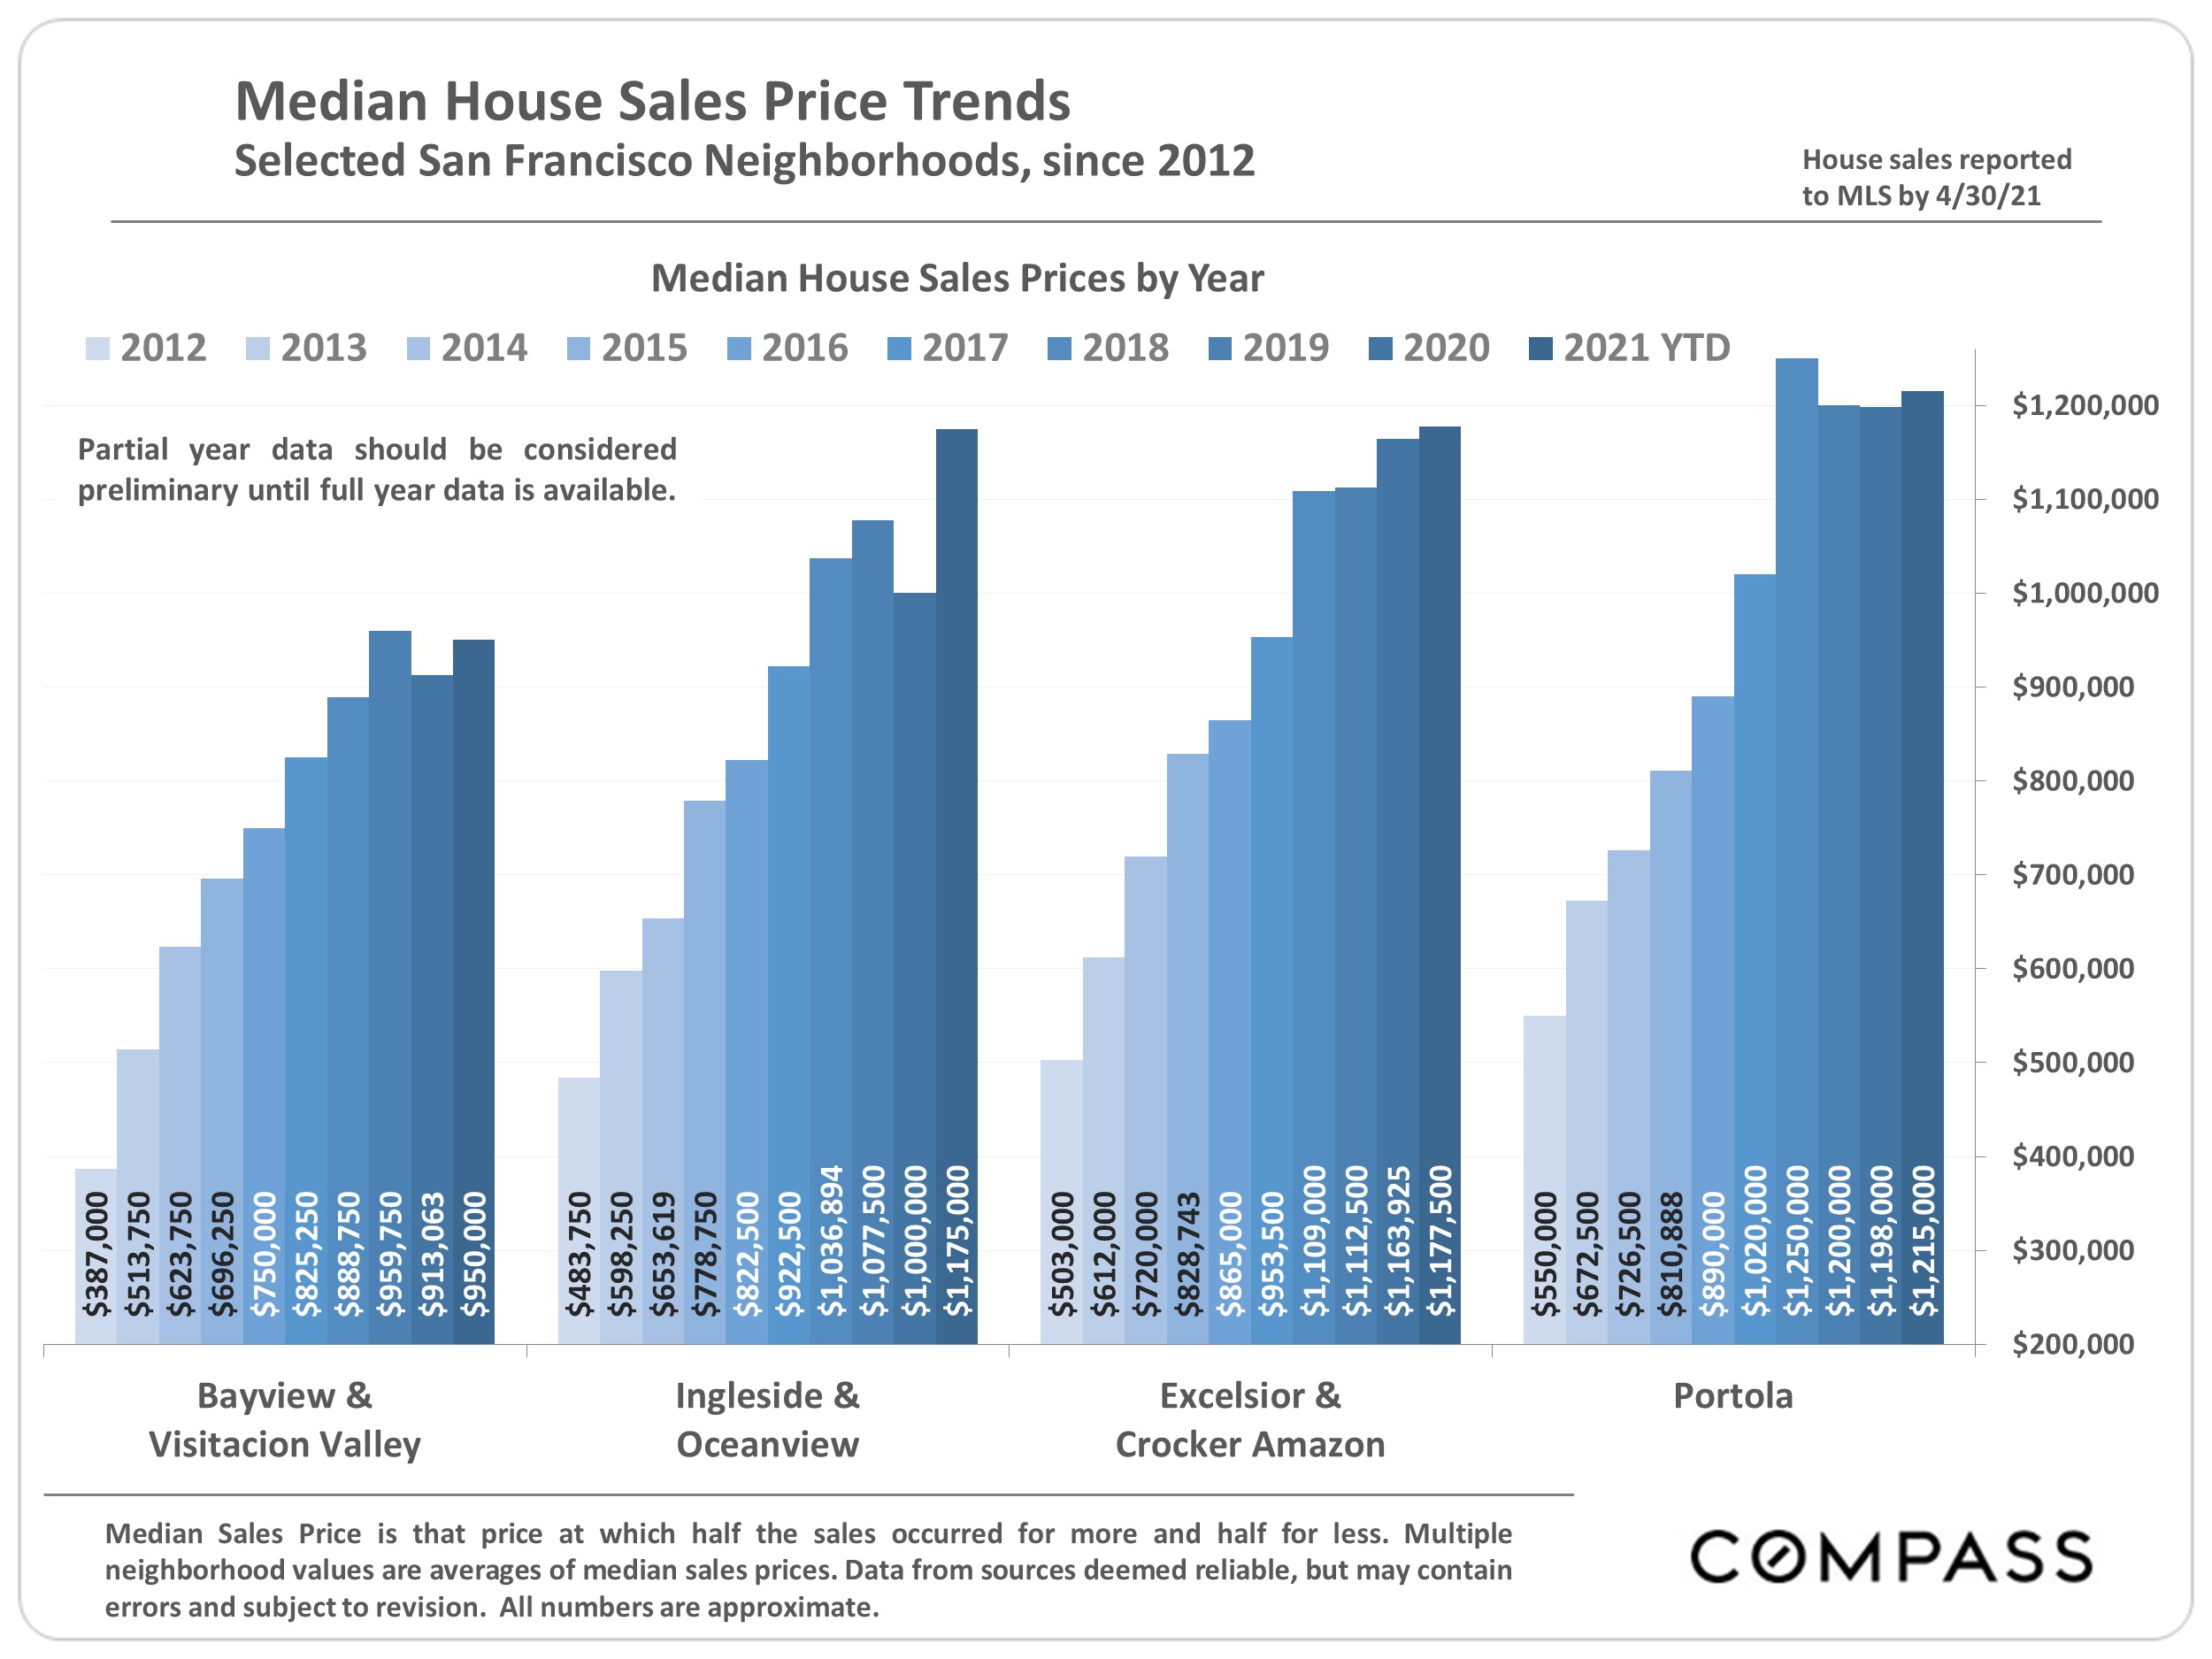
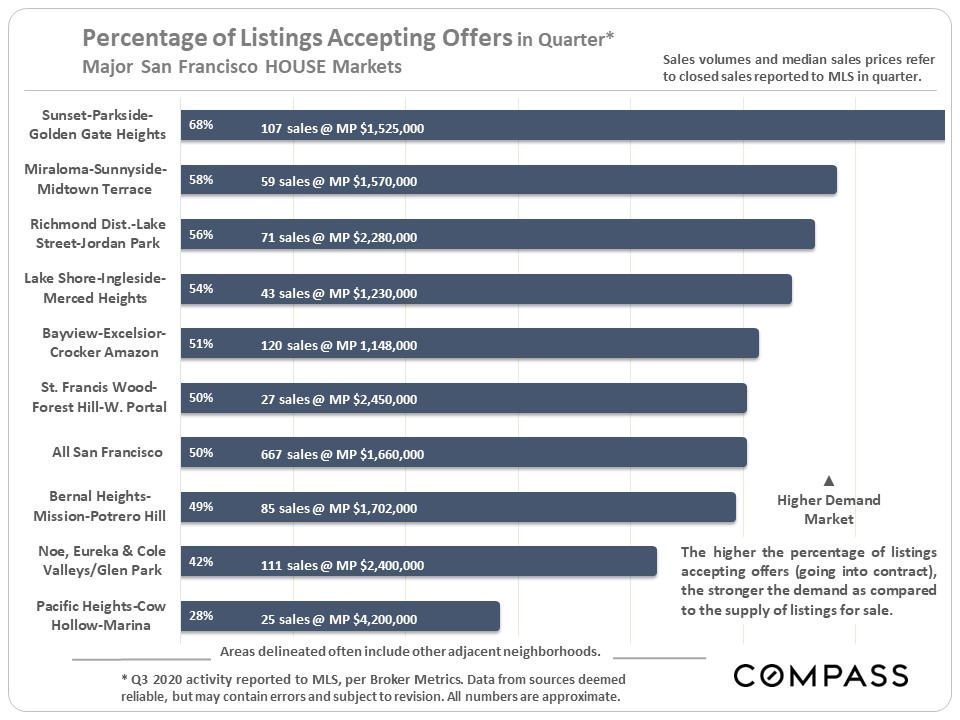
House Markets by District/Neighborhood
Within the city, there are significant differences in market dynamics by location. This report will look first at house markets, followed by a series of analyses on condo markets. How these charts apply to any particular home is unknown without a specific comparative market analysis.
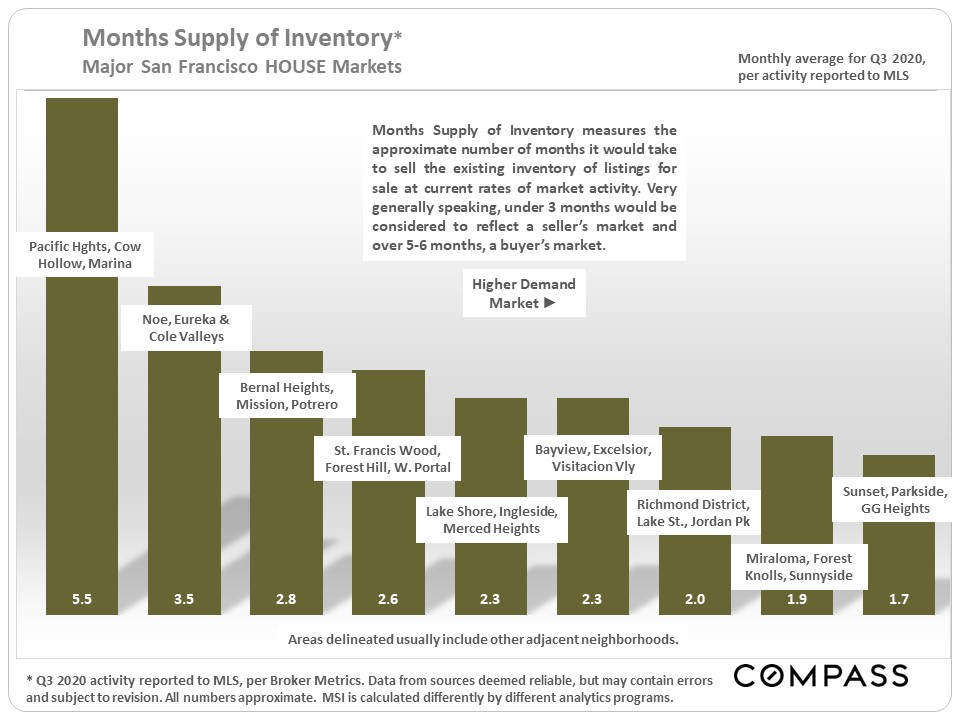
By most standard measurements, the greater Sunset/Parkside district has the strongest house market in the city with house values just below the SF median house price. At the softer end of dynamics are 2 of the city's most expensive districts, which feature the largest luxury house segments.
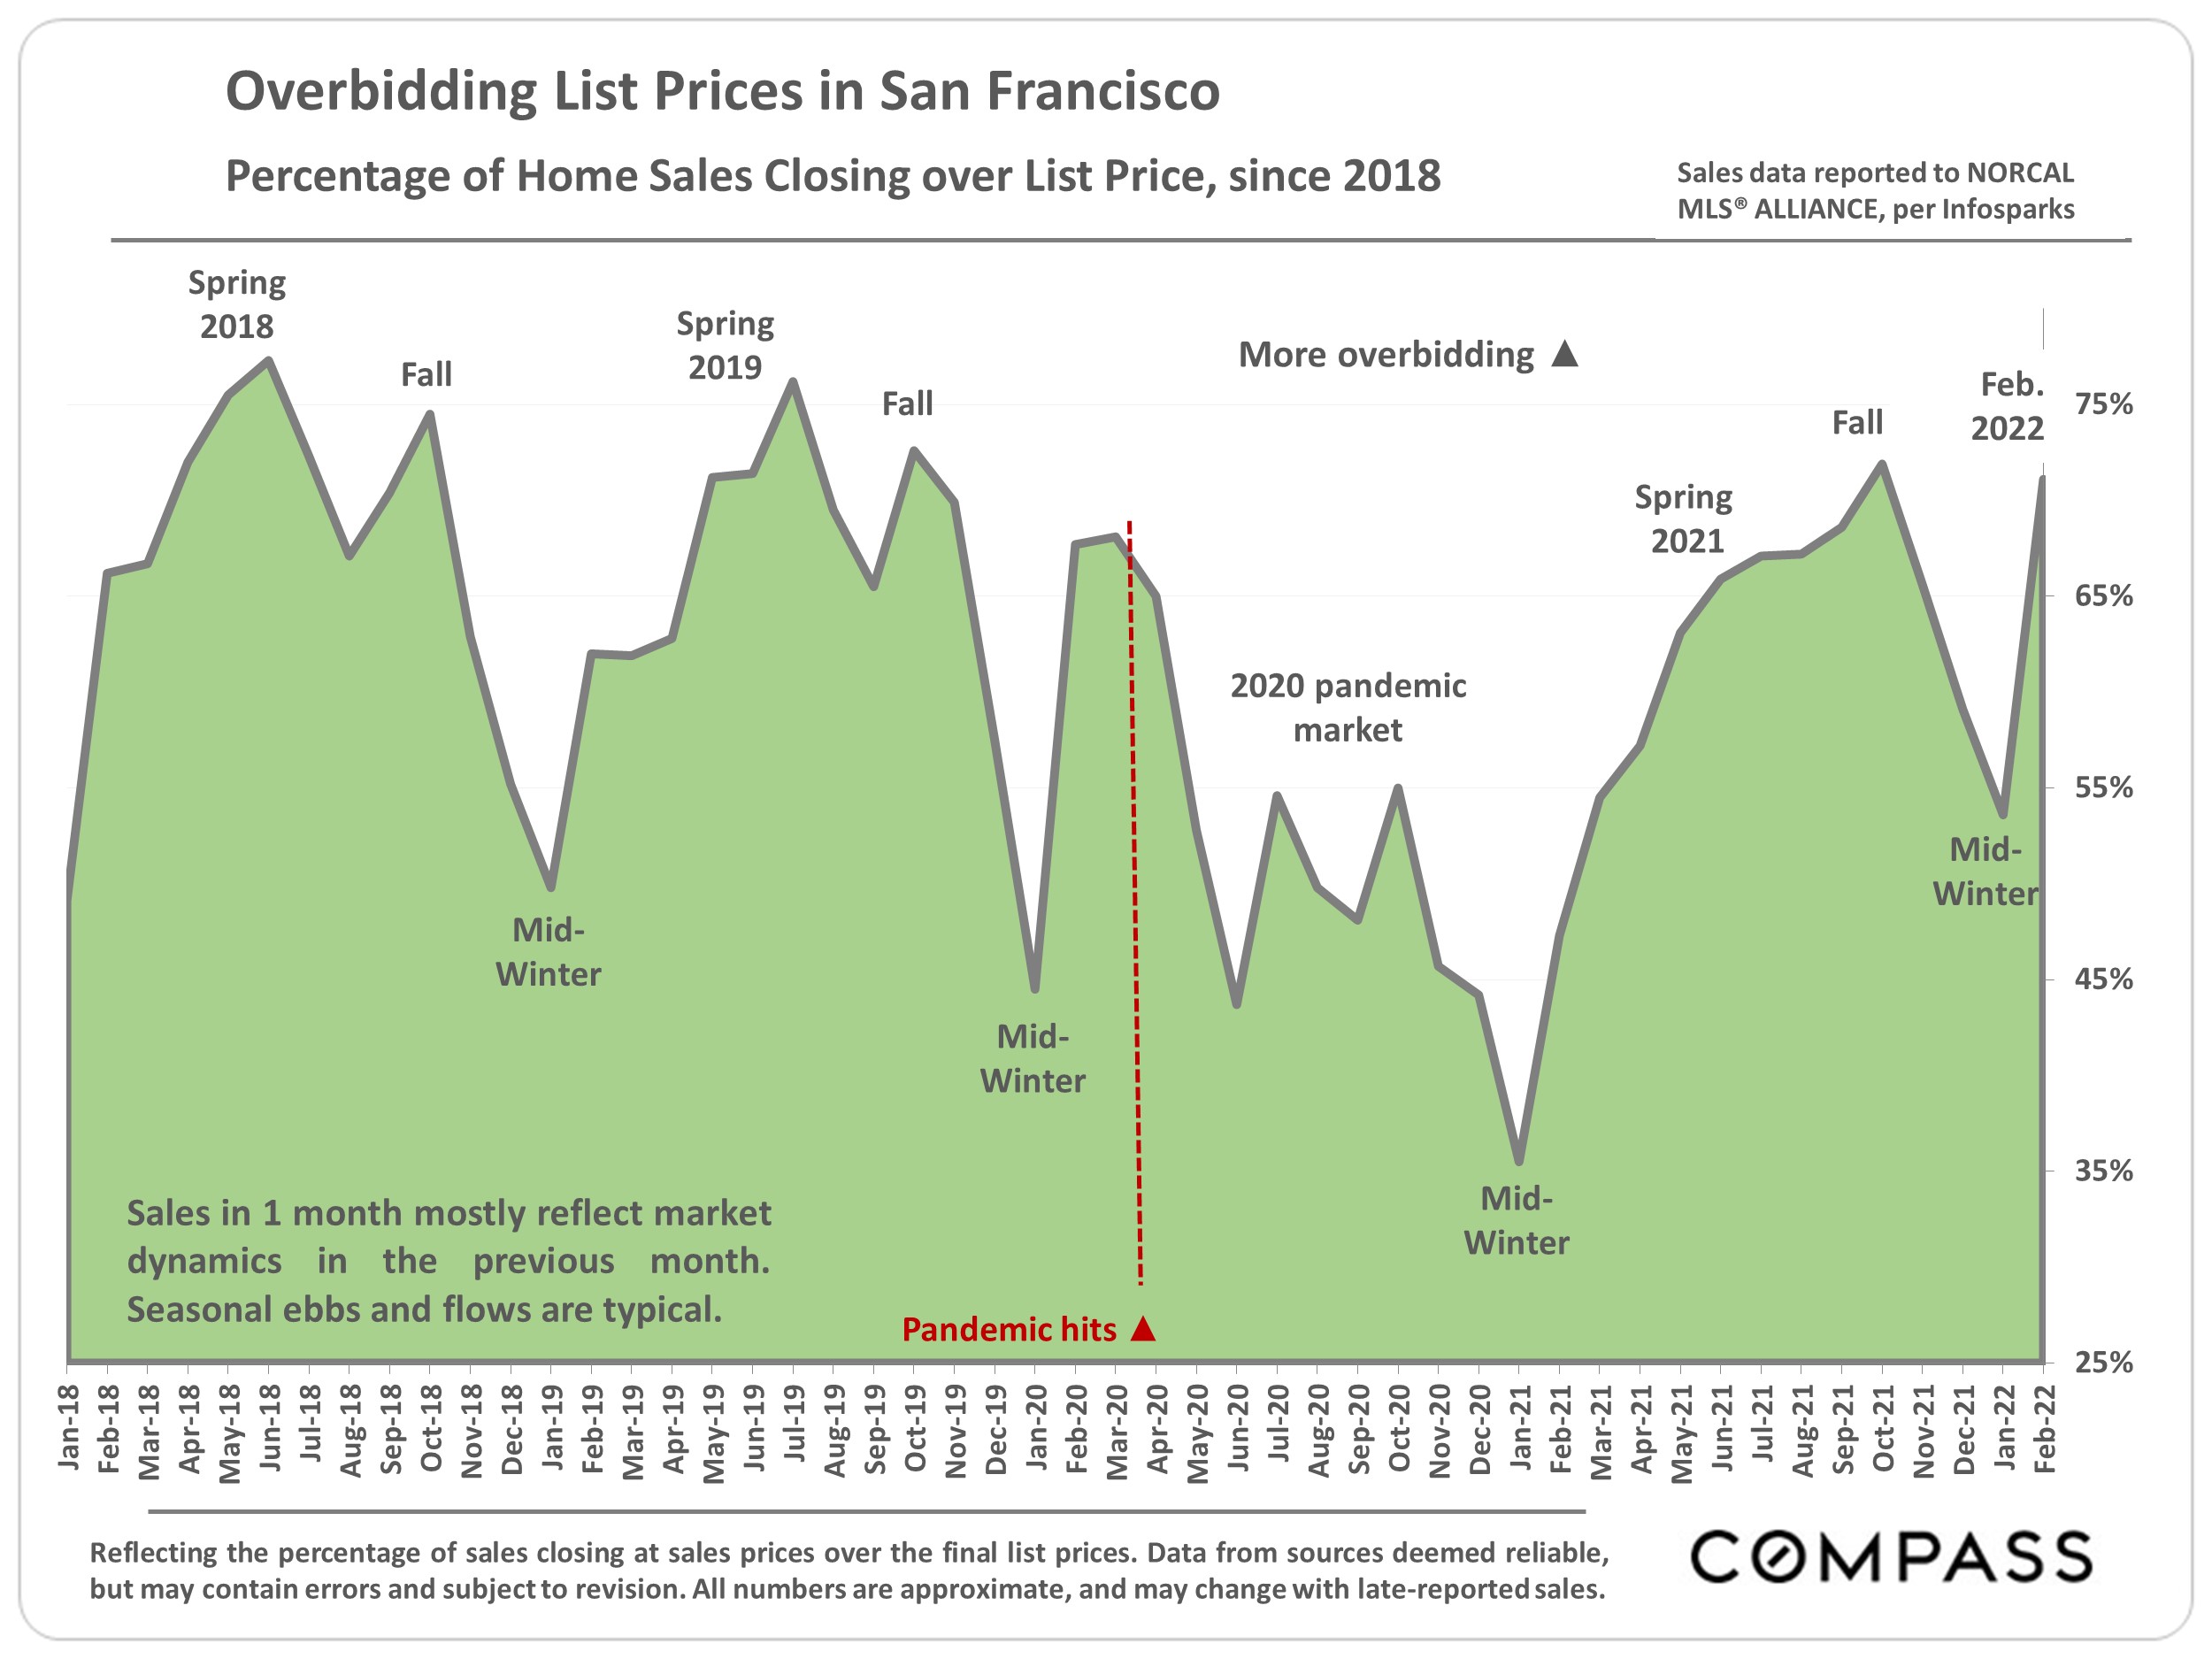
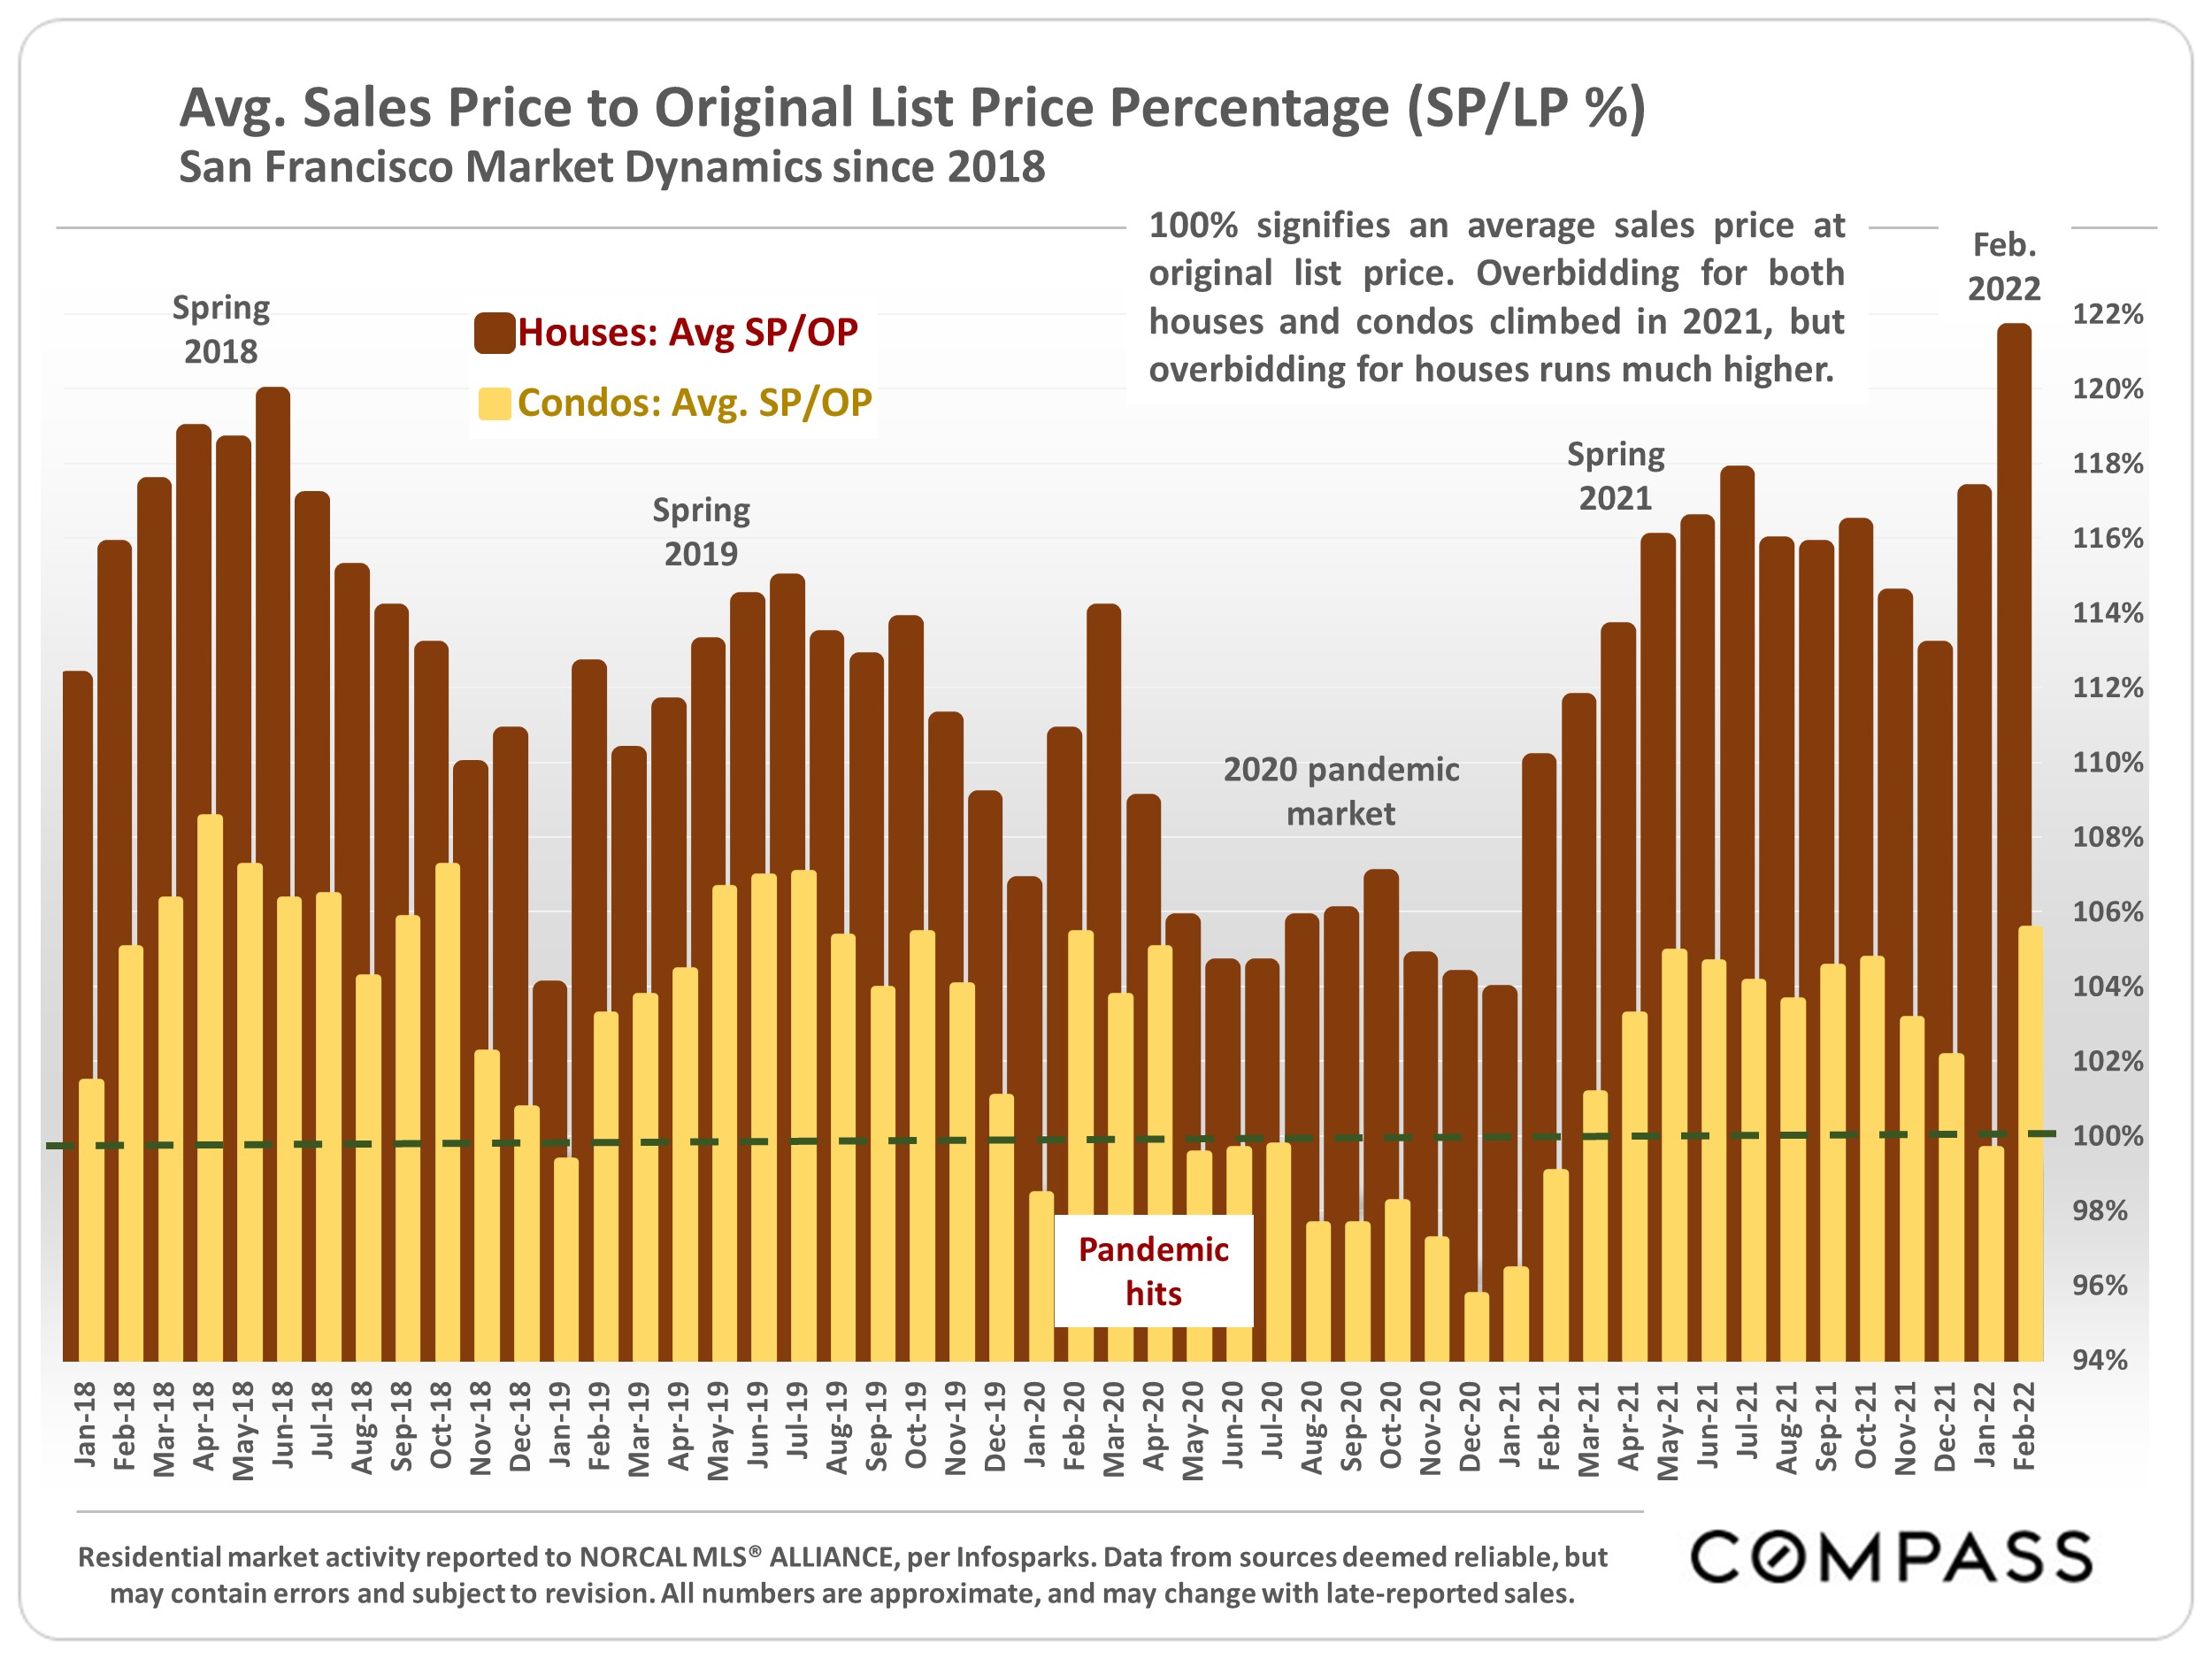
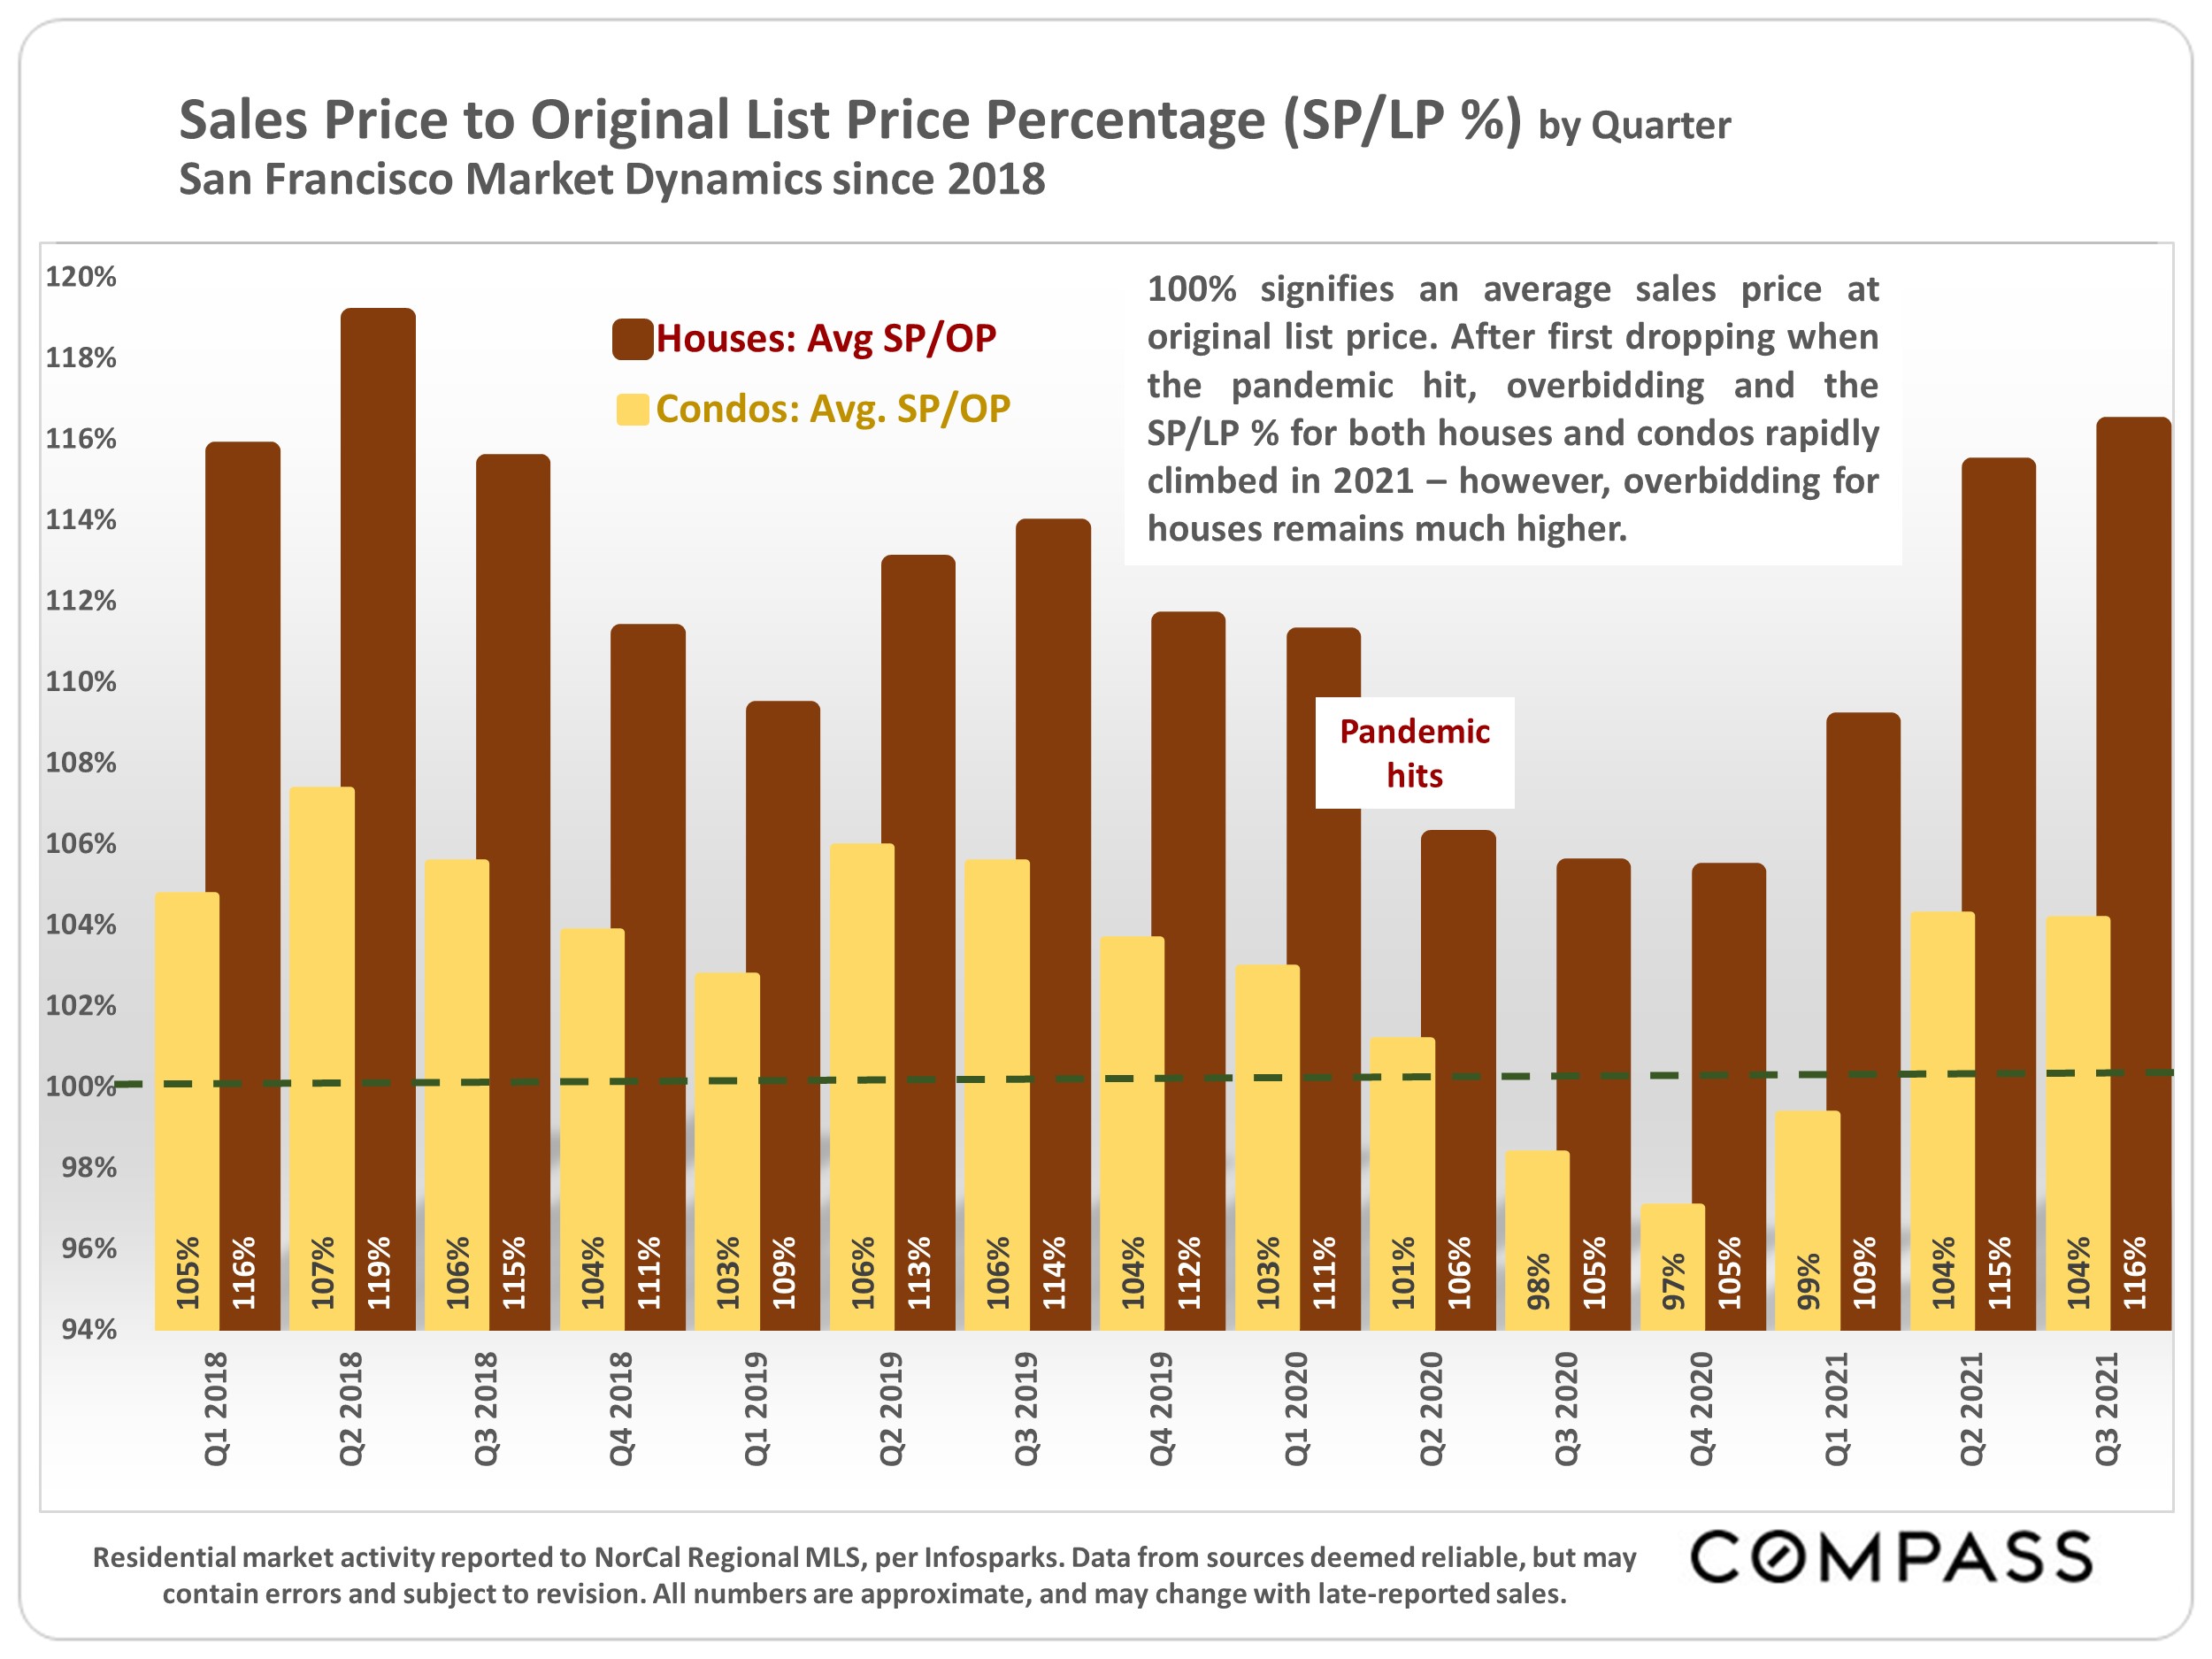
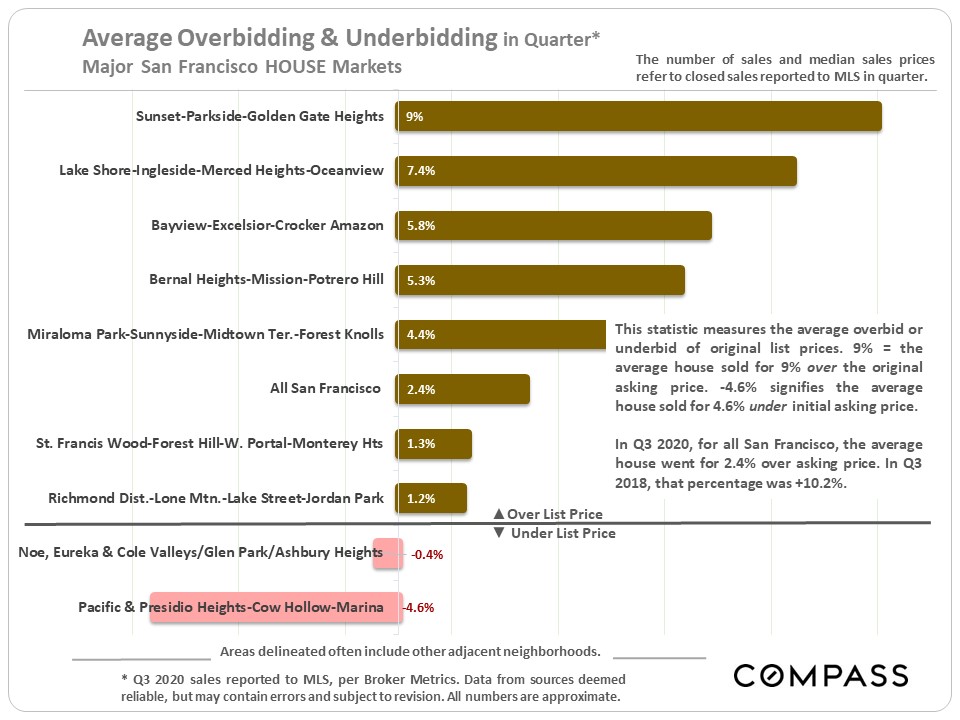
Overbidding on house listings is well down from the crazed levels of recent years, but is still relatively common in more affordable districts. Some part of the overbidding percentages is caused by strategic underpricing of listings (to get buyers excited).
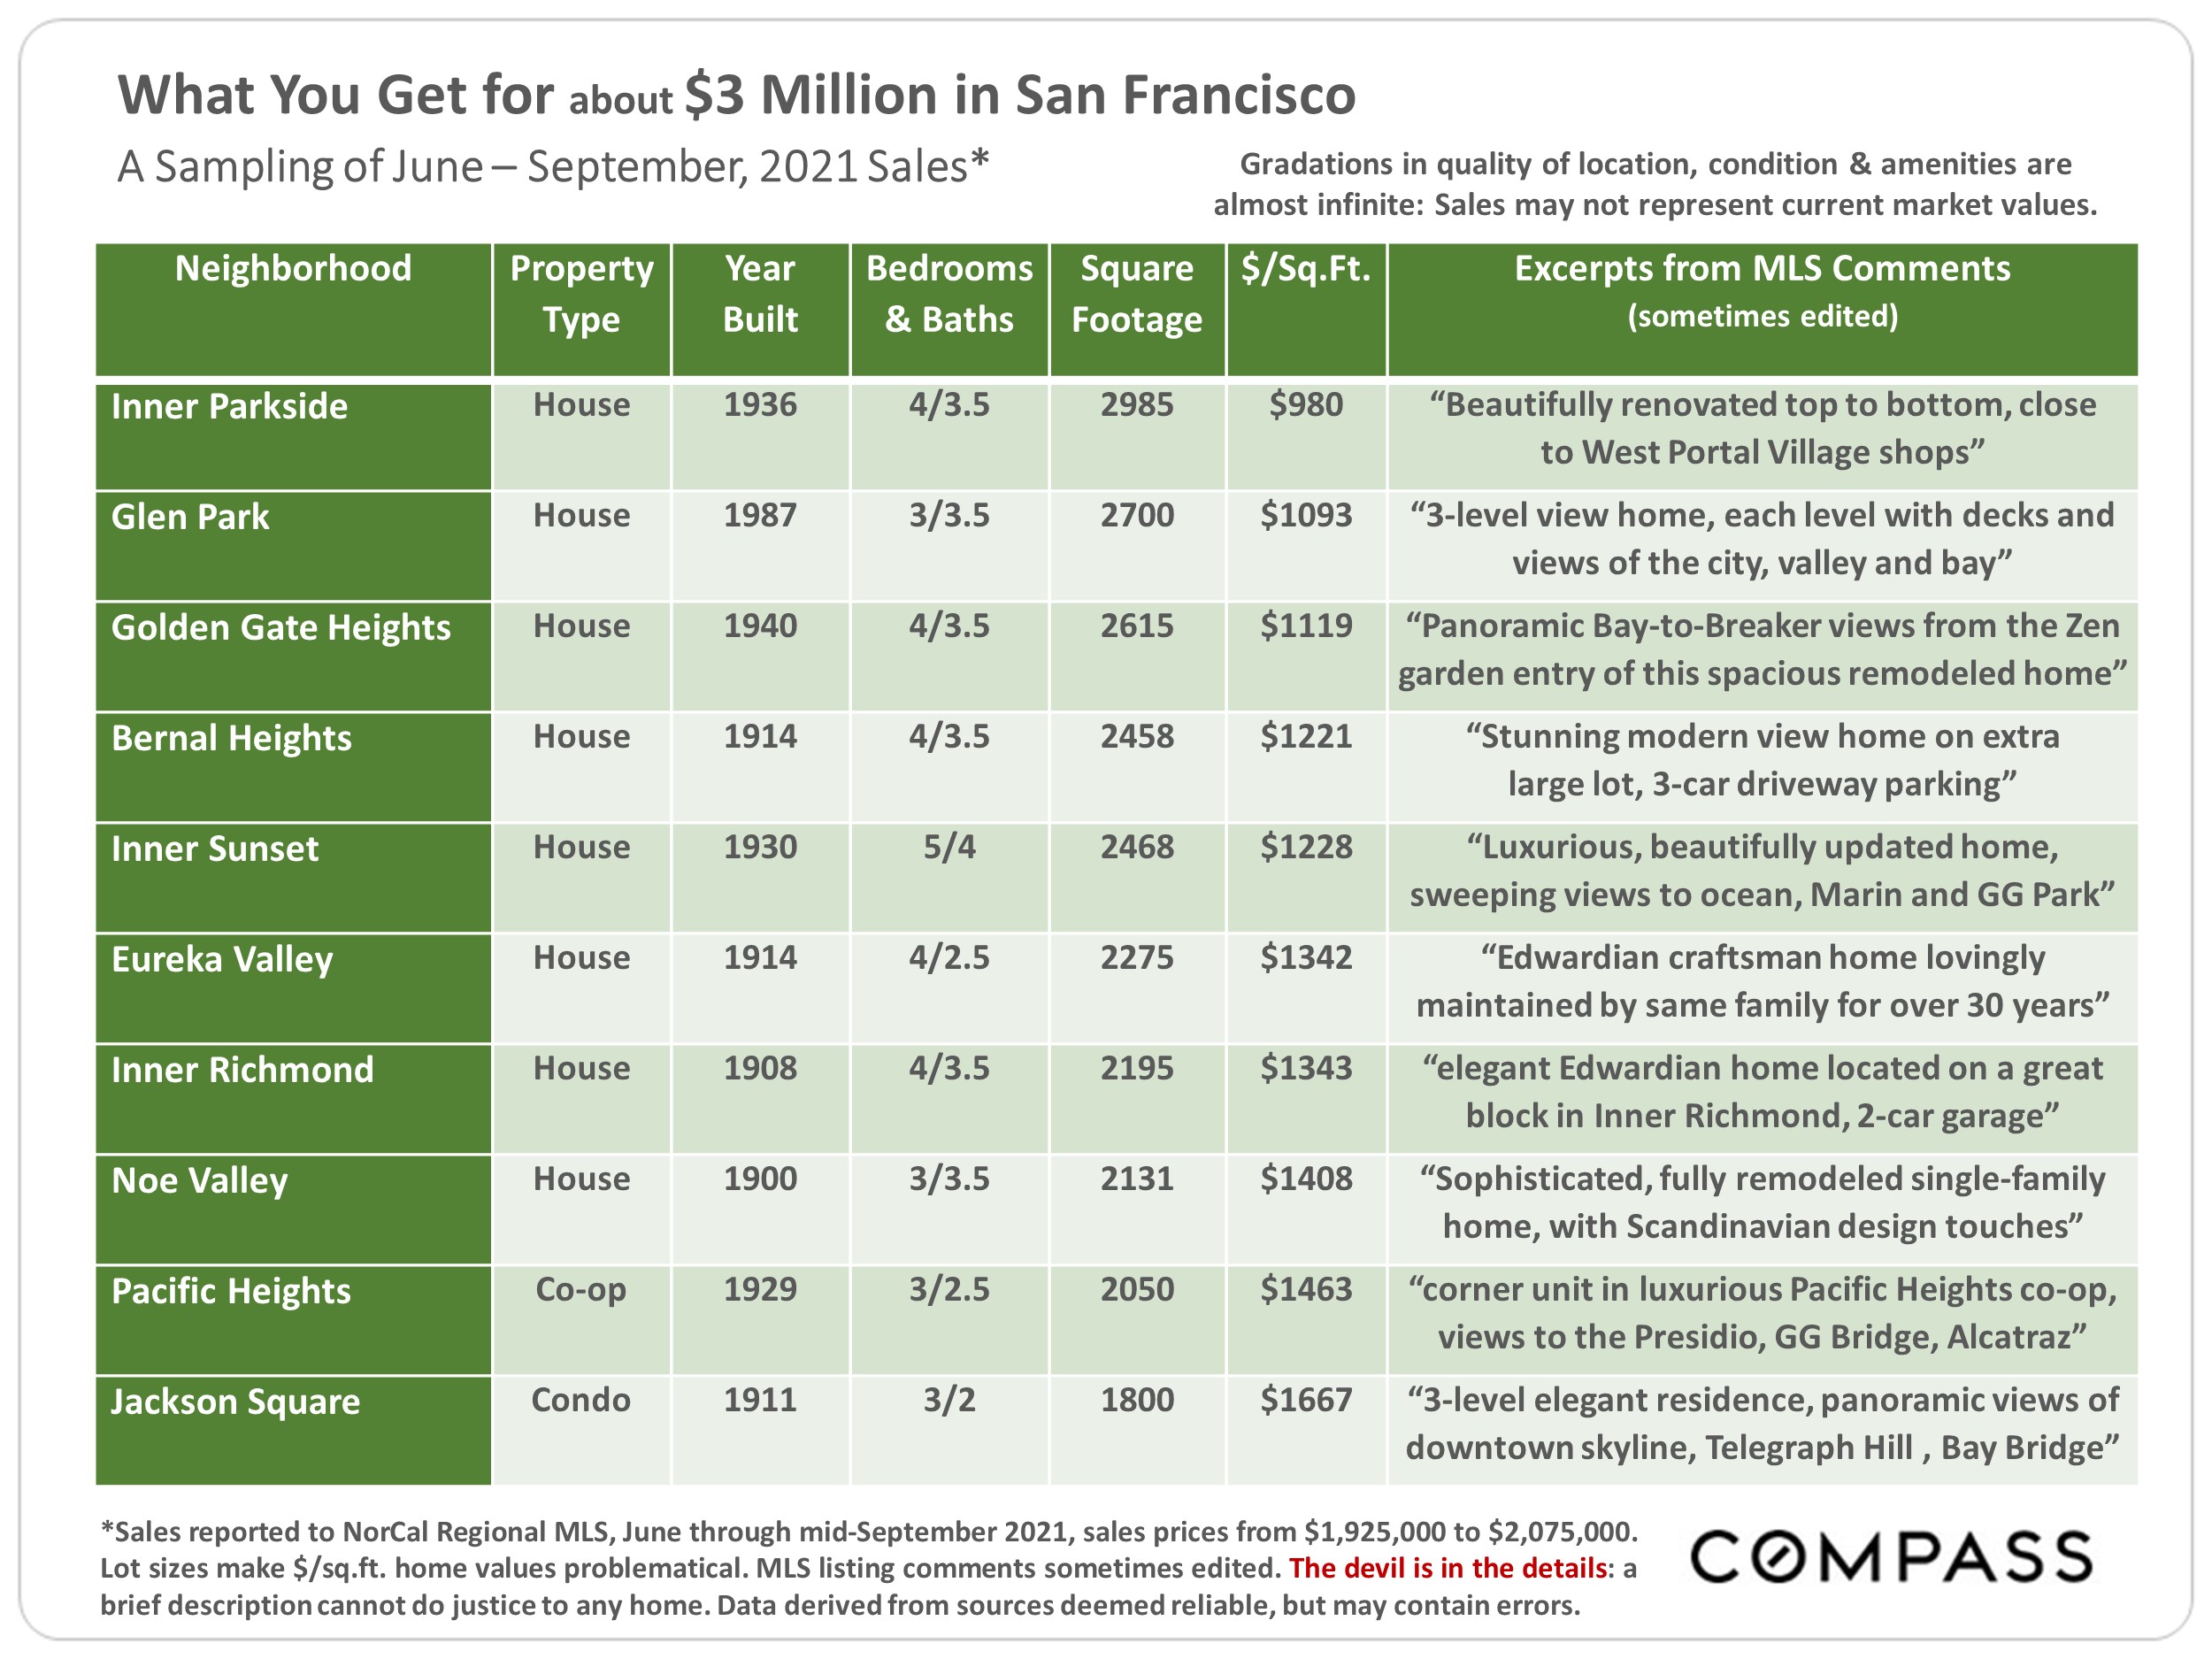
A breakdown of house sales, $3 million and above, by district over the past 12 months.
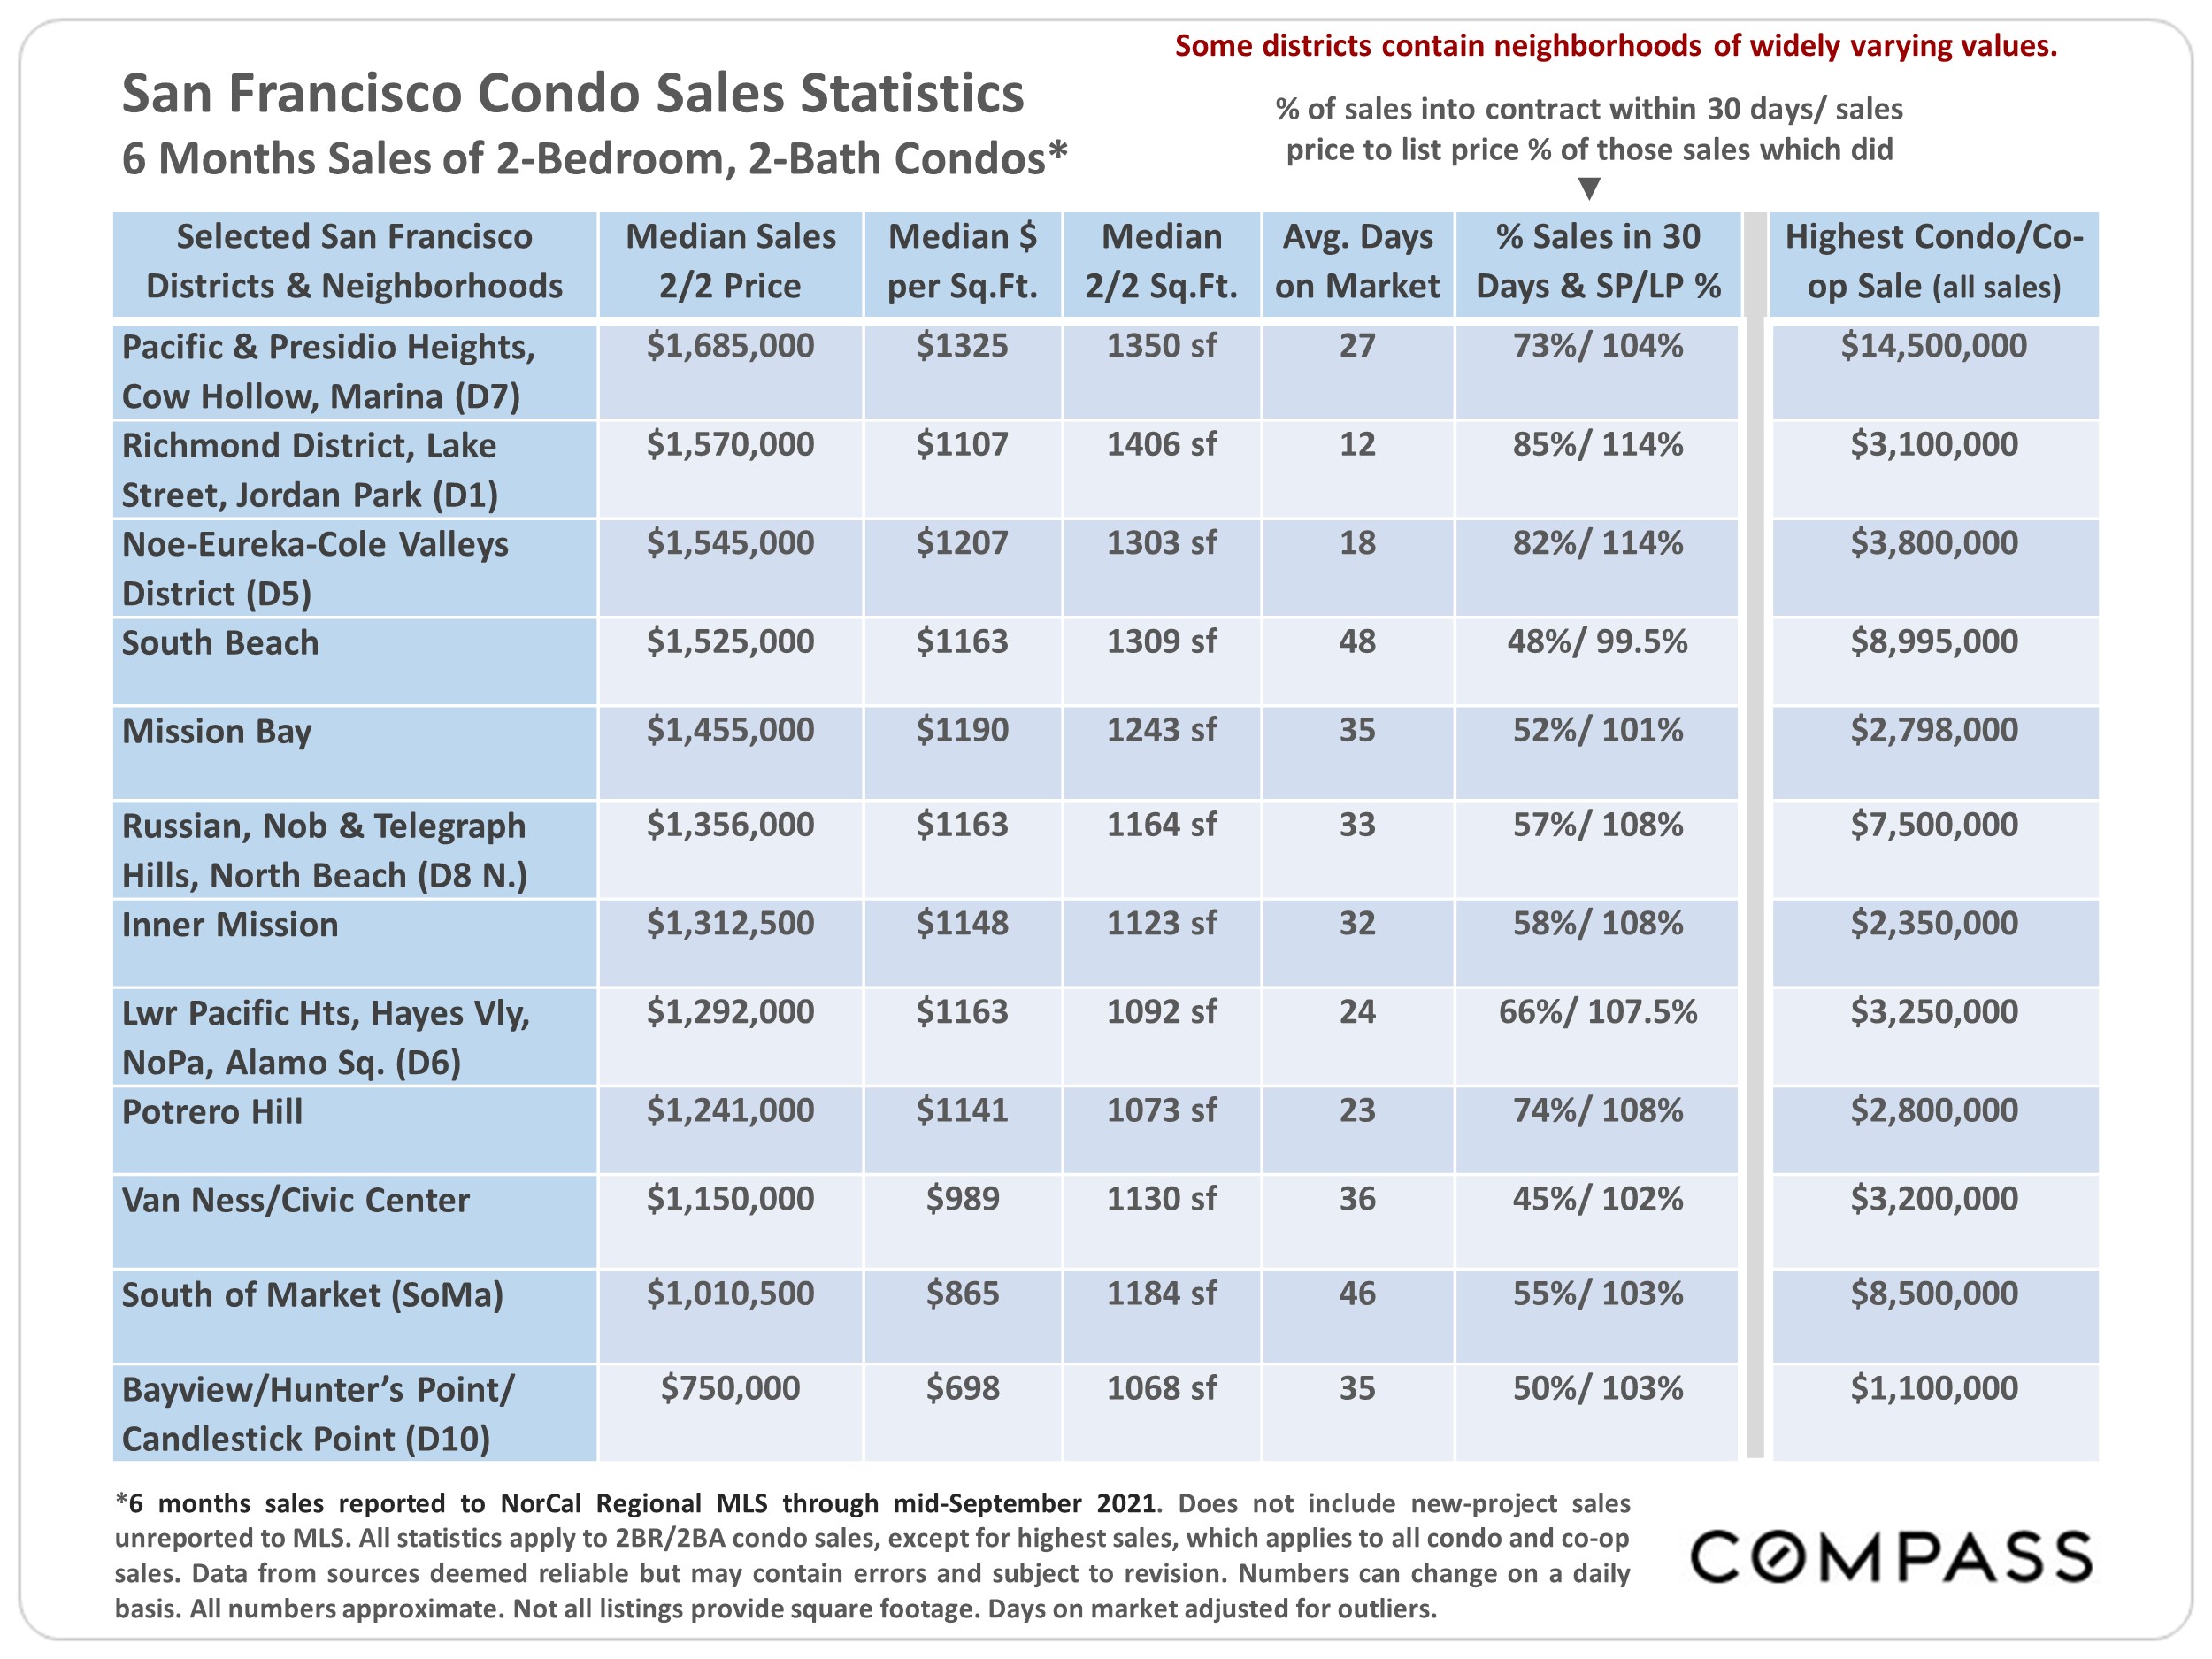
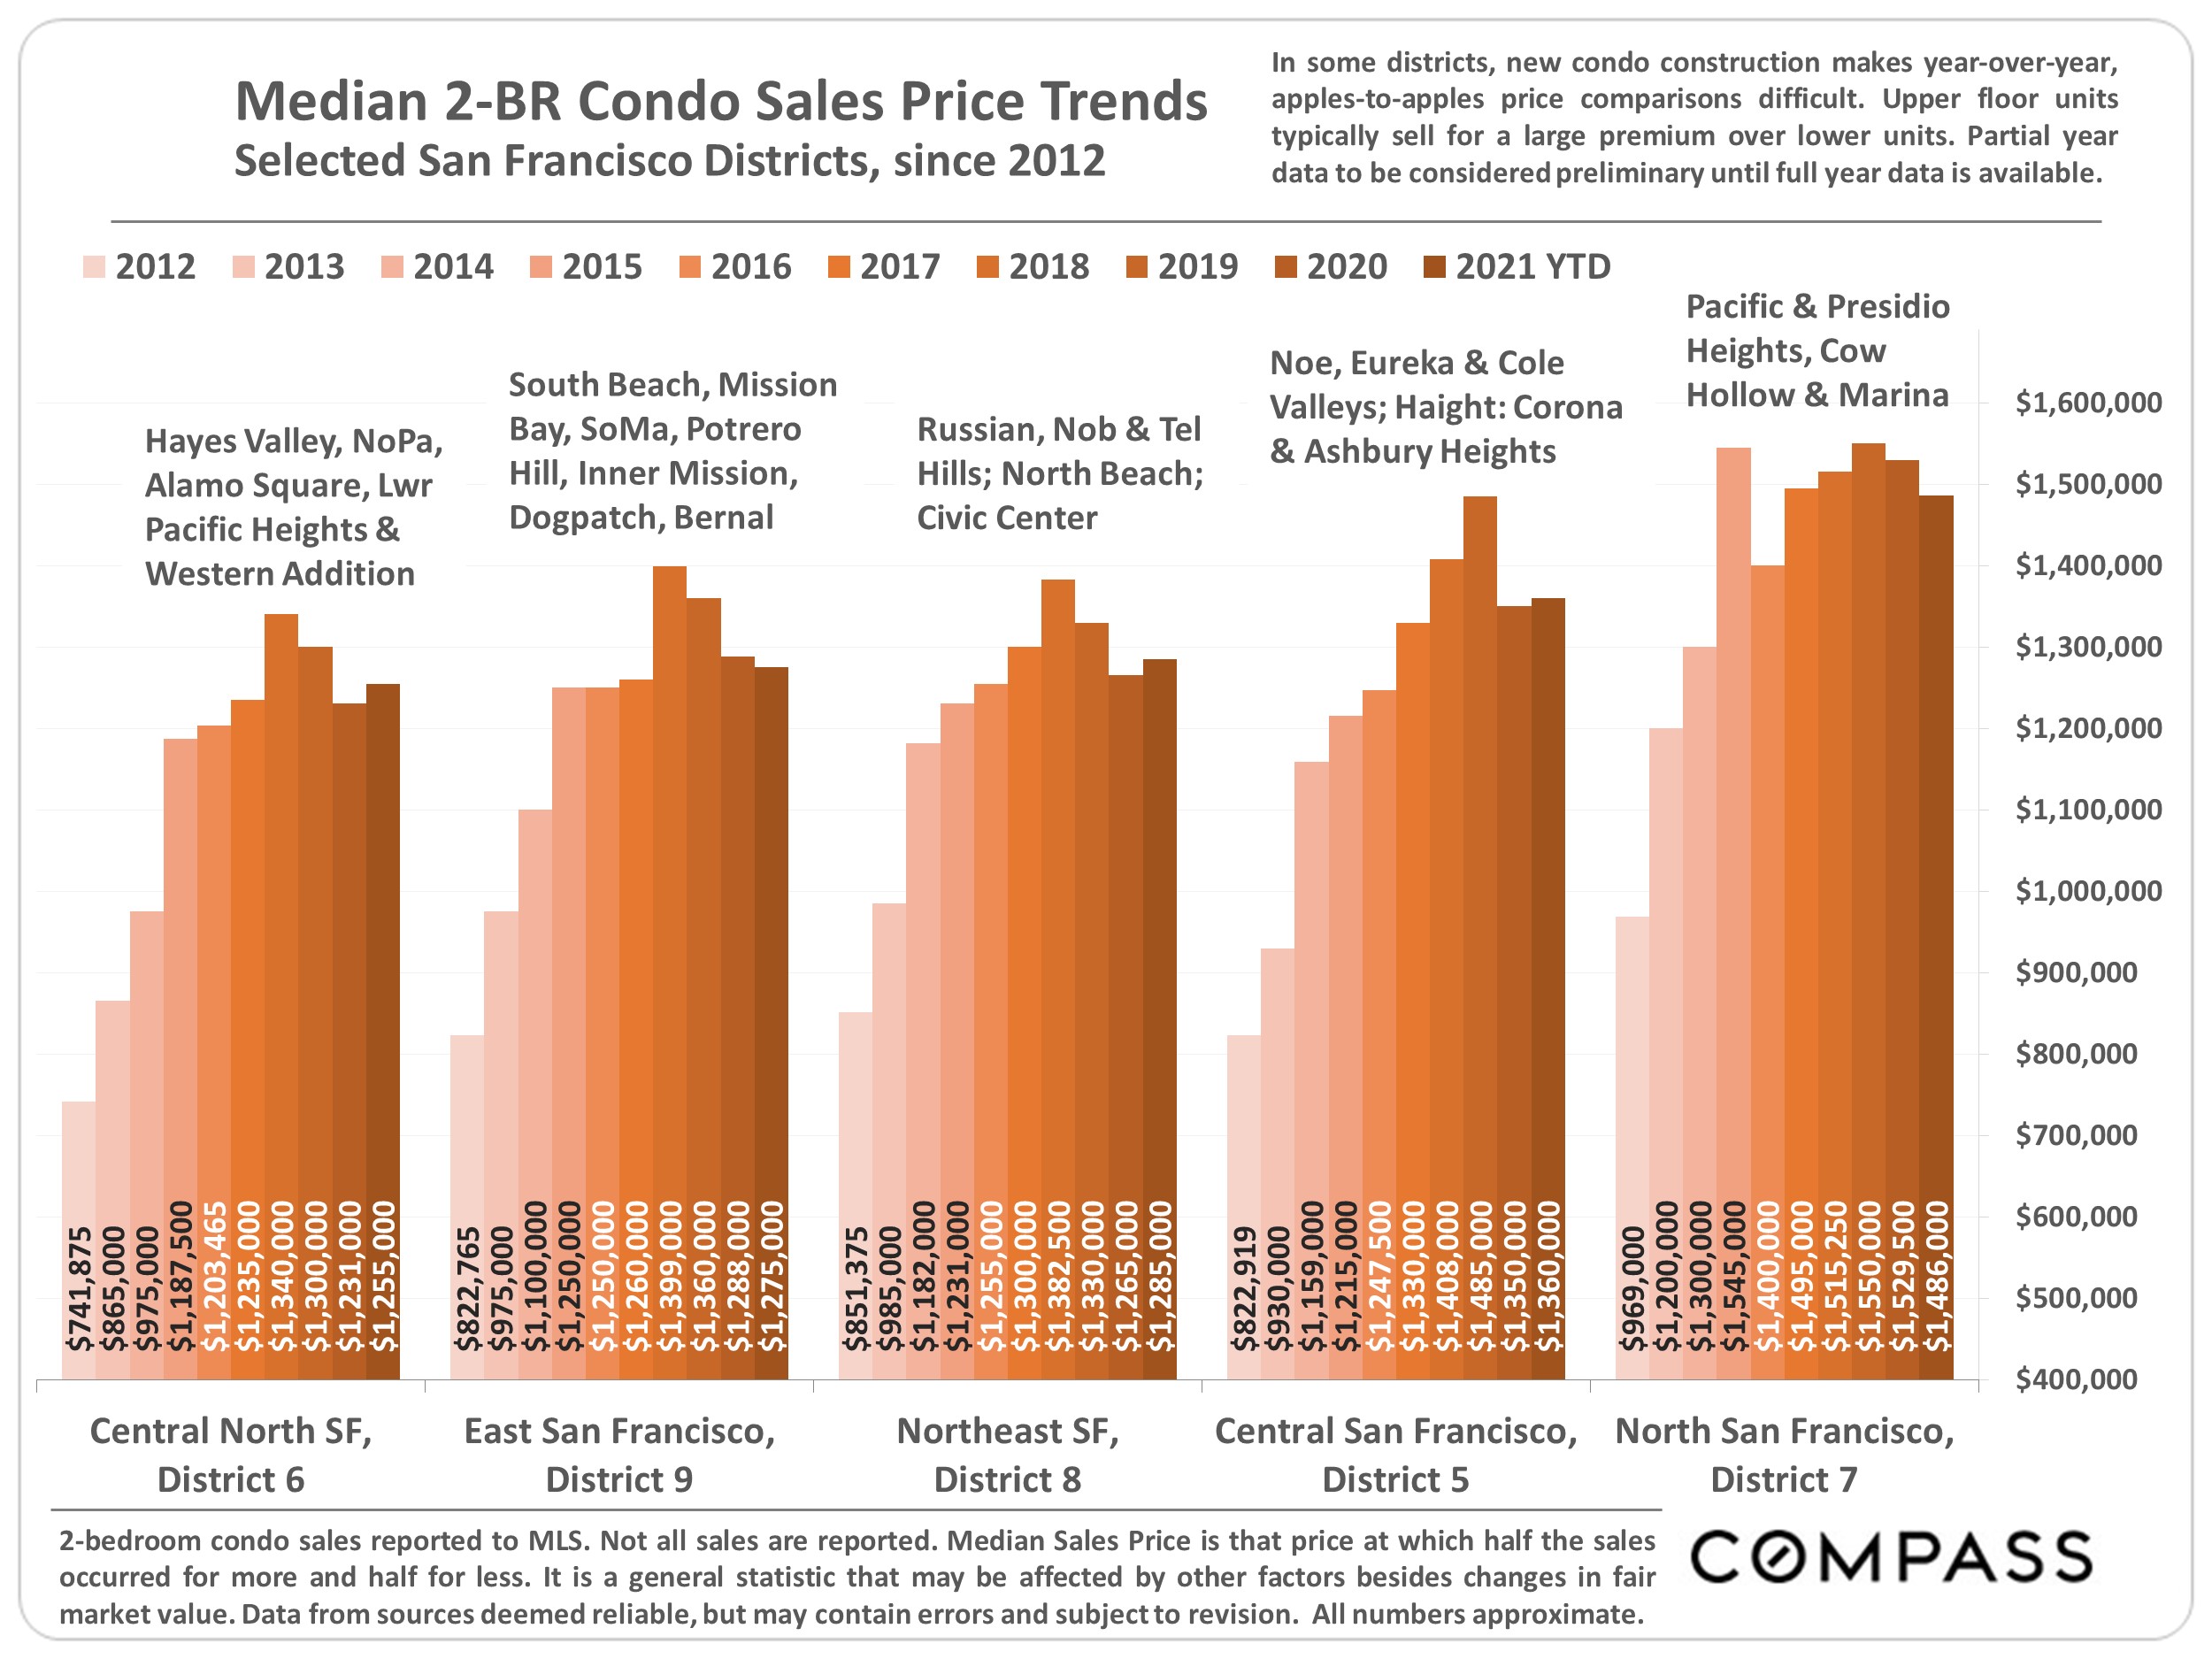
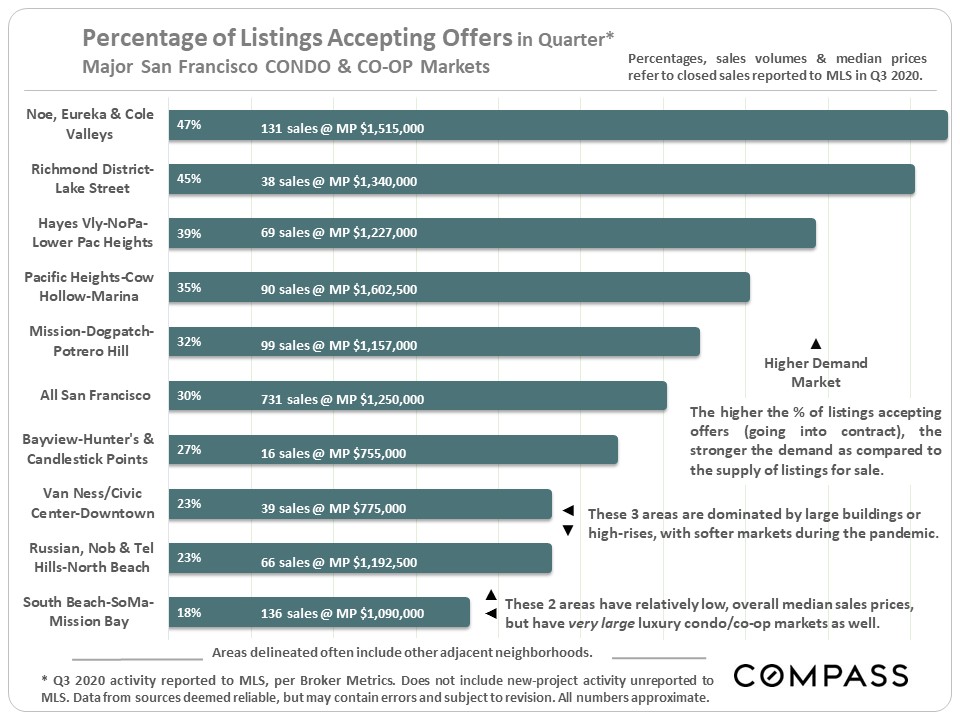
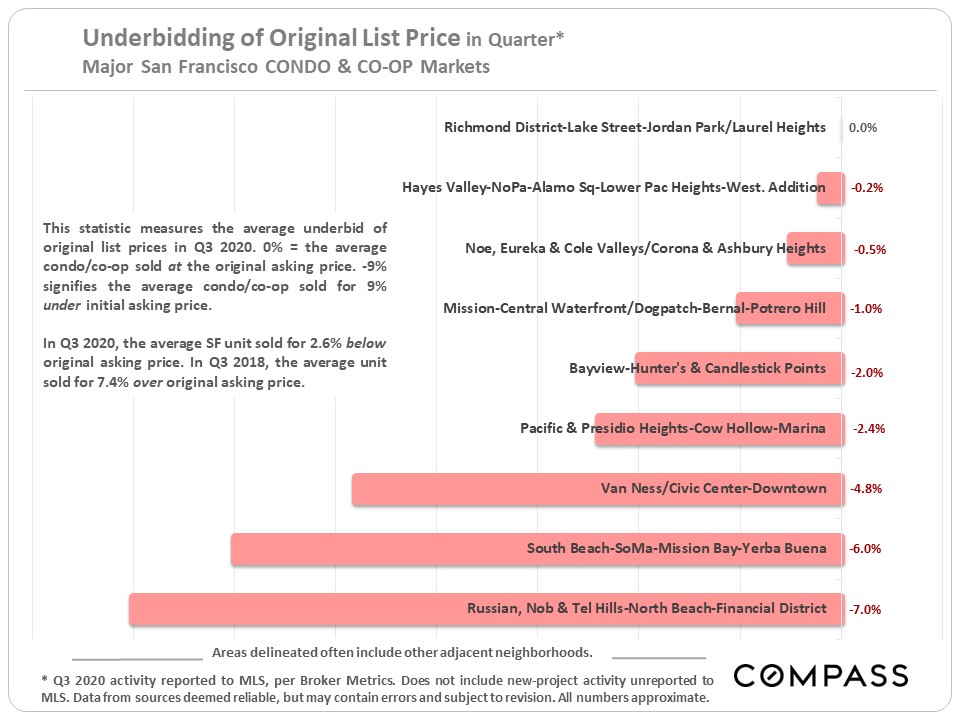
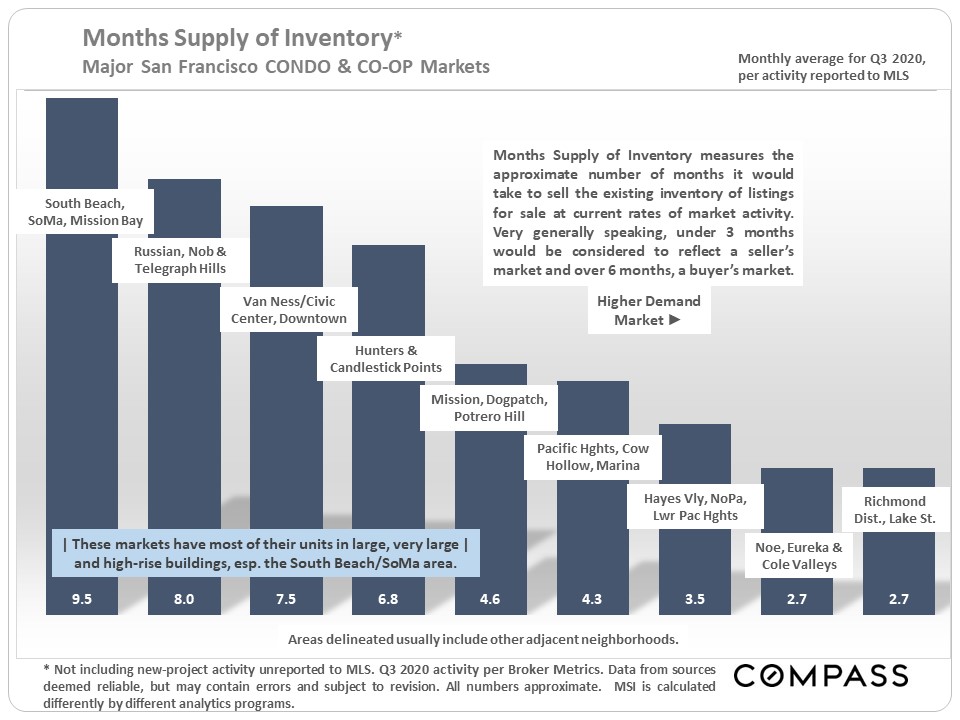
San Francisco Condo Markets by District/Neighborhood
Since the pandemic hit, the softest condo markets have been those dominated by larger complexes and high-rises. The greater South Beach/ SoMa/ Mission Bay area – by far the largest condo market in SF – has the weakest supply and demand dynamic, followed by the greater Russian, Nob and Telegraph Hills area, and the Van Ness/Civic Center area.
Markets dominated by smaller buildings, often with separate unit entrances and dedicated outdoor spaces, have seen stronger buyer demand.
As a statistical average, overbidding above the original list price has disappeared from the condo market. This ties in with the previous chart on price reductions.
Compass is a real estate broker licensed by the State of California operating under
multiple entities. License Numbers 01991628, 1527235, 1527365, 1356742, 1443761, 1997075,
1935359, 1961027, 1842987, 1869607, 1866771, 1527205, 1079009, 1272467. All material presented
herein is intended for informational purposes only and is compiled from sources deemed reliable
but has not been verified. Changes in price, condition, sale or withdrawal may be made without
notice. No statement is made as to accuracy of any description. All measurements and square
footage are approximate. Equal Housing Opportunity.
marketingcenter-sfbayarea-sfcityproper
Pota Perimenis is committed to providing an accessible website. If you have difficulty accessing content, have difficulty viewing a file on the website, or notice any accessibility problems, please contact us at (415) 407-2595 to specify the nature of the accessibility issue and any assistive technology you use. We strive to provide the content you need in the format you require.