San Francisco Real Estate
|
High-Demand Spring Market Slightly Below Last Year's Home Price Peaks
|
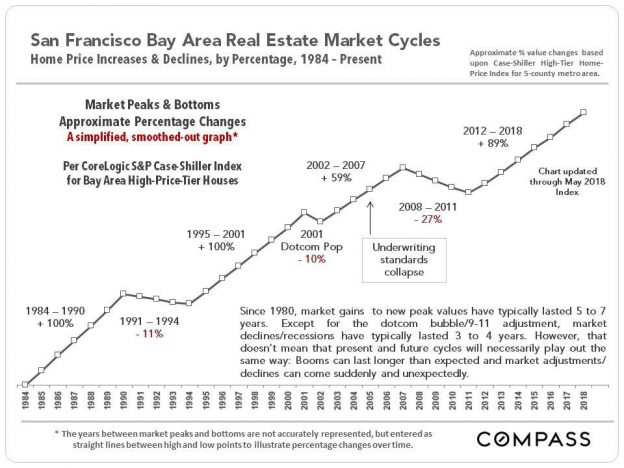
With April’s end, we now have 2 months of spring season data unaffected by the end of 2018, when financial markets plunged. As of early May 2019, stock markets have recovered to hit new highs, interest rates are far lower than last year’s peak, and our local, unicorn IPOs have begun to roll out after a media frenzy of speculation on their potential effects on the market.
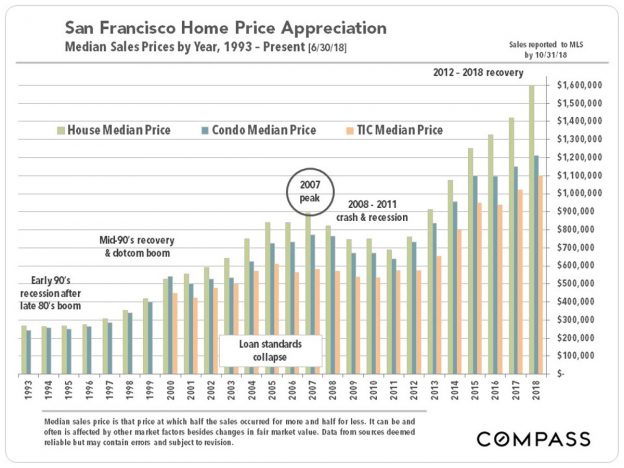
The market has heated up considerably from the slowdown in the second half of 2018, with strong buyer demand for a very limited inventory of listings. Median home sales prices have returned to highs close to those in spring 2018, but, so far, last year’s peaks have not been exceeded. This is a big change from the year-over-year appreciation rates of the past 6-7 years.
However, there are still 2 months of spring sales data to come in (before the typical summer slowdown), and word on the street is that some new listings are again generating feverish bidding wars between buyers.
|
Monthly Median House Sales Prices
|
Monthly median sales prices are often affected by other factors besides changes in fair market value – for example, the extreme seasonality of luxury home sales – but the above chart helps illustrate trends over the past 2 years: Spring 2018 was one of the hottest markets in history, with dramatic year-over-year price appreciation. The market then cooled, stock markets turned scary, and interest rates climbed. 2019 has heated up again, but, so far,
without any y-o-y median price gains.
The most expensive housing market in the country has, for the time being, stopped becoming more expensive.
|
Year-over-Year Comparisons
|
The table below compares the March-April market statistics of 2018 and 2019. Prices were stable, overbidding was down, and luxury home sales were up, but most statistics were remarkably similar to last year's. The SF and Oakland-Berkeley markets are currently the strongest in the Bay Area.
|
Home Sales by Price Range & Bedroom Count
|
Below is an illustration of sales of houses, condos, co-ops and TICs over the past 12 months, by price segment and by number of bedrooms.
Condos now constitute the biggest share of sales in San Francisco, which mostly explains the high columns for 1- and 2-bedroom sales in the $500,000 to $1.5 million range.
|
District Sales & Median Home Prices
|
The next 2 charts break down the last 12 months of sales by Realtor District (delineated on the map above). Some districts were split into 2 for these analyses, but all these areas contain neighborhoods of differing characteristics and home values.
|
House Sales, Median Prices & Median Sizes
|
The two biggest districts by volume of house sales - Bayview/ Excelsior/ Crocker Amazon (D10) and Sunset/ Parkside/ GG Heights (D2) - are also 2 of the 3 most affordable districts for purchasing a house in the city. Many of the older districts with bigger, more expensive houses are relatively small markets.
|
Condo Sales & Median 2-BR/2-BA Condo Prices
|
Condo sales in SF run across a wide range of eras and styles, from Victorian and Edwardian units in small buildings, through brand new, ultra-luxury high-rise penthouses. The breakout of median sales prices pertain to 2-bedroom, 2 bath condos only.
|
San Francisco Luxury Homes Markets by District
|
We typically define the SF luxury house market as houses selling for $3 million+, and the luxury condo, co-op and TIC market as those selling for $2 million+.
|
SF Luxury House Sales by District
|
The central Noe, Eureka and Cole Valleys district (D5) dominates the market for houses selling from $3 to $4.99 million. The northern Pacific Heights-Cow Hollow district (D7) dominates the $5 million+ ultra-luxury segment. But high-end home sales are scattered across the city.
|
Luxury Condo, Co-op & TIC Sales by District
|
Luxury condo sales are concentrated in 3 districts: District 9, where most of the newer, high-rise, luxury projects are found in the South Beach/Yerba Buena area (which 30 years ago was filled with parking lots and auto-stereo shops), and in the old-prestige, northern neighborhoods of Districts 7 & 8, which include Pacific Heights and Russian Hill. (This is also where the city's high-price co-op units are clustered).
|
Q1 2019 "Ultra-Luxury" Homes Markets
|
We start the "ultra-luxury" segments at $5 million for houses, and $3 million for condos and co-ops. There has been a large (and continuing) surge in the construction of very expensive condo projects over the last 15 years, which makes for a greatly increased inventory of high-price condos for sale - and softer market dynamics.
|
House Size & Era of Construction
|
Many factors influence home construction size during any particular period: Affluence, economic conditions, household size, buyer age, land costs, population growth, natural disasters, etc. Generally speaking, the median size of houses was larger during the Victorian-Edwardian era, and declined through the 1940's - when enormous swathes of the city were built out in the south and southwest districts. Home sizes then began increasing again, and are now larger than ever - however, few new houses are currently built in the city.
The sizes of houses built in earlier periods have increased over the years due to renovations: Adding that 2nd bathroom, or a 3rd bedroom behind the garage.
Condos have become the major alternative for people purchasing homes of smaller size.
|
Selected Demographic & Economic Factors
|
SF has seen a dramatic population increase over the past 10 years, and by percentage growth, SF had the 2nd highest rate in the Bay Area after Alameda County. But new census data indicates the rate of growth is rapidly dropping.
Our latest burst of growth - an increase of about 78,000 or 10% - with all its social and economic effects, looks paltry compared to the 1940's, when the city's population soared by 140,000, a jump of 22% that began with WWII.
|
Venture Capital Investment
|
In recent years, the Bay Area has been the biggest destination of venture capital investment dollars in the country - and probably the world. These tens of billions of dollars have constituted a massive factor in the local economy, supercharging the creation of new companies, hiring, and, eventually, IPOs. Venture capital is effectively seed money that has exploded into the creation of stupendous amounts of new wealth.
|
|
© Compass 2019 ¦ All Rights Reserved by Compass ¦ Made in NYC
Compass is a licensed real estate broker (01991628) in the State of California and abides
by Equal Housing Opportunity laws. All material presented herein is intended for informational
purposes only. Information is compiled from sources deemed reliable but is subject to errors,
omissions, changes in price, condition, sale, or withdraw without notice. No statement is made
as to accuracy of any description. All measurements and square footages are approximate. Exact
dimensions can be obtained by retaining the services of an architect or engineer. This is not
intended to solicit property already listed
|
|
|