


San Francisco Neighborhood Affordability
Where a buyer is most likely to find a home in the price segment they’re looking in, whether under $1 million or over $5 million.
for the Money You Want to Spend
February 2016 Report on Neighborhood Home Prices
A city neighborhood map is provided at the bottom of this analysis.
The charts below are based upon San Francisco home sales reported to MLS in the 10 to 12 months through February 15, 2016, breaking out the neighborhoods with the most sales within given price points. Other neighborhoods not listed did have smaller numbers of sales within given price segments.
Where to Buy a HOUSE for under $1 million
The overall median HOUSE price in the city in the 4th quarter of 2015 was $1,250,000, so the under million-dollar house is becoming increasingly less common. The vast majority of house sales in this price segment now occur in a large swath of neighborhoods running across the southern border of the city, which are by far its most affordable house markets: from Bayview through Portola, Excelsior, Visitacion Valley and Crocker Amazon, to Oceanview and Ingleside.
The chart’s horizontal columns reflect the number of sales of houses with at least 2 bedrooms, with parking, for under $1 million, while the median sales prices noted are for all 2BR house sales during the period. Median price provides a good idea of overall neighborhood house prices.

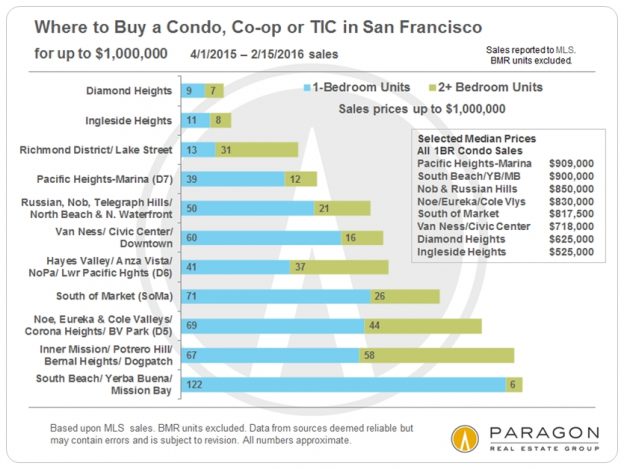
Where to Buy a CONDO, CO-OP OR TIC for under $1 million
The overall SF median condo price in the 4th quarter of 2015 was about $1,100,000, and sales under $1m still occur in almost every area of the city that features these property types – but a studio unit in Russian Hill may cost as much as a 2-bedroom condo in Diamond Heights.
Of these property types, condos make up about 90% of sales, stock co-op apartments 1 to 2%, with TICs making up the balance. TICs typically sell at a significant discount (10% - 20%) to similar condos.
The horizontal columns reflect the number of sales under $1m broken out by 1-bedroom and 2-bedroom units. The box of median sales prices is just for 1BR units, again simply to give an idea of relative values between neighborhoods.

Spending $1 Million to $1.5 Million in San Francisco
In this price point for houses, one starts moving into another layer of neighborhoods in the west and the central-south areas of the city: Central Sunset and Parkside, Miraloma Park, Sunnyside, Mission Terrace, Bernal Heights and others as shown. There has been a lot of upward pressure on these areas in the past 2 years in particular.
The horizontal columns reflect the number of sales, with the average dollar per square foot values for the homes in this price range noted alongside.

Condo and co-op sales in this price range are mostly concentrated in those areas where newer condo developments have surged onto market over the past 10 – 15 years, and continue to arrive in increasing numbers – South Beach, Inner Mission, Hayes Valley, Dogpatch, SoMa – as well as in high-end neighborhoods such as Pacific Heights, Russian Hill and the greater Noe-Eureka Valleys area.

Buying a HOUSE for $1.5 million to $2 million

Buying a HOUSE for $2 million to $2.5 million
When you get to the $2 to 2.5 million dollars range, the house market becomes dominated by the greater Noe-Eureka-Cole Valleys district, the St. Francis Wood-Forest Hill district, the Potrero Hill-Inner Mission area, and the Inner-Central Richmond and Lake Street area.

Buying a LUXURY HOME in San Francisco
For the sake of this report, houses selling for $2.5 million and above, and condos, co-ops and TICs selling for $1.5 million and above are designated (somewhat arbitrarily) as luxury home sales. What you get in different neighborhoods for your millions of dollars will vary widely. Views often play a significant role in SF home values, but particularly in the luxury condo market, where the most expensive units often offer staggering views from very high floors. Over the past 15 years – and accelerating in the current market recovery – there have occurred some very large shifts in the luxury home market, with districts other than the old-prestige, northern neighborhoods becoming major destinations for (very) high-end homebuyers. However the northern neighborhoods like Pacific Heights still dominate the ultra-high end in SF: houses selling for $5 million or more. The greater South Beach-Yerba Buena area, with its many new luxury condo towers now has more luxury condo sales than any other area.
Luxury CONDO, CO-OP & TIC Sales

Luxury HOUSE Sales

San Francisco Neighborhood Map

For prevailing SF median house and condo prices, our interactive
map of neighborhood values can be found here: SF Neighborhood
Home-Price Map
Other updated reports you might find interesting:
Our Most Recent Market Analyses
30+ Years of San Francisco Real Estate Cycles: This is by far the most popular article on our website – for 3 years running.
San Francisco Market Overview Analytics: Interactive, auto-updating charts for all the standard real estate statistics – median sales price, average dollar per square foot, days on market, months supply of inventory, listings for sale, and so on.
San Francisco District Sales Overview: A breakdown of sales by price segment for 14 different sections of the city.
10 Big Factors behind the San Francisco Real Estate Market: A review of the major economic, political and demographic issues underlying the city’s current market.
These analyses were made in good faith with data from sources deemed reliable, but they may contain errors and are subject to revision. Statistics are generalities and how they apply to any specific property is unknown without a tailored comparative market analysis. Sales statistics of one month generally reflect offers negotiated 4 – 6 weeks earlier. Median sales prices often change with even the smallest change in the period of time or parameters of the analysis. All numbers should be considered approximate.
© 2016 Paragon Real Estate Group


