


The San Francisco Luxury Home Market
Homes of $2 Million & Above
Auto-Updating Market Analytics
The bar charts compare year-over-year data, going back 2 years, for the latest month. The line charts track monthly data over a period of 3 to 5 years. Note that it can take 7 to 15 days after a month’s end for agents to enter in transaction data pertinent to the month in question, so statistics for the latest month can sometimes change significantly as this data is added to calculations.

Auto-Updating Market Analytics
Seasonality plays a significant role in luxury real estate statistics as the market ebbs and flows during active and less active sales seasons. Typically, the market is most active in the spring and fall, and much slower in the summer and, especially, the mid-winter holidays.
Moving your cursor over the line charts will reveal monthly data.
New Listings Coming on Market, by Month
September is usually the single biggest month for new high-end home listings.
Spring is typically the most active season for new listings.
New listing activity plunges during the mid-summer and mid-winter holidays.
Total Number of Active Listings for Sale during Month
Number of Listings Accepting Offers, by Month
Number of Sales, by Month
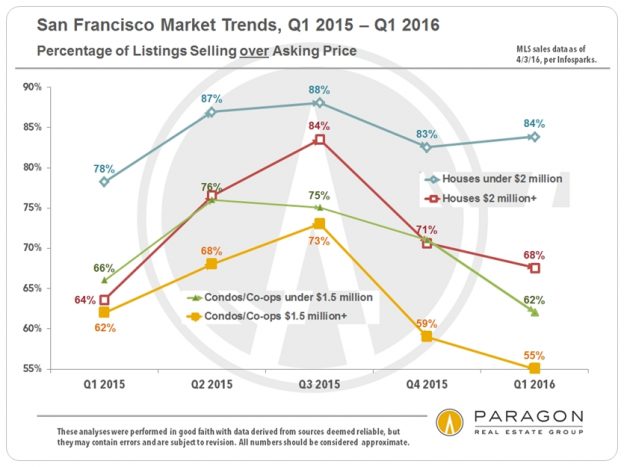
Percentage of Listings Selling for over Asking Price, by Month
Median Percentage of List Price Achieved on Sale
Over 100% usually signifies competitive overbidding;
under 100% signifies more aggressive buyer negotiation.
Median Dollar per Square Foot (upon Sale)
3-Month Rolling Average
Months Supply of Inventory (MSI), by Month
The lower the MSI, the greater the buyer demand as compared
to the inventory of listings available to buy.
Median Days on Market before Acceptance of Offer
3-Month Rolling Average
Expensive Home Sales by San Francisco District & Neighborhood
Note that these charts using differing price points for the “luxury home” designation.


Other reports you might find interesting:
Market Analytics for General SF Market
30+ Years of San Francisco Real Estate Cycles
San Francisco Neighborhood Affordability
10 Big Factors behind the San Francisco Real Estate Market
Bay Area Apartment Building Market
Link to San Francisco Neighborhood Map
It is the relationship between supply and demand that defines the state of the market. Looking at one statistic such as the number of sales, without comparing it to how many listings were available to purchase, may give a distorted view of market conditions. Some statistics, such as months supply of inventory take both supply and demand into account. Last but not least, short-term statistics sometimes fluctuate without great meaningfulness - longer-term trends are always most meaningful.
Sales data usually reflects market activity, i.e. when a new listing comes on market and offers are negotiated, occurring 4 to 8 weeks before the sale date. Thus, for example, sales in June mostly reflect new listings and offers negotiated in late April and May.


