Category Archives: Updates

Preliminary Indications of Market Direction


San Francisco Real Estate in Early 2017


Preliminary Indications of Market Direction


April 2017 Report


———————————————————— 


In recent months, there have been multiple reports in local media about Big Drops in San Francisco Home Prices! But, umm, we are not seeing it, neither on the ground in the hurly burly of buyers and sellers making deals, nor in the year-over-year quarterly statistics of supply and demand. News articles often make a big deal regarding the median sales price in a single month, but monthly data is often gravely deficient as an indicator, fluctuating up and down without much meaningfulness due to a number of factors. January and February are particularly bad months to draw conclusions from: The lowest sales volumes of the year, reflecting deals negotiated during the December-January market doldrums, with weather issues sometimes thrown in besides (for instance, in early 2017). Last but not least, the media often mixes property types to come up with a single median sales price, and that is generally not a good idea either.

This chart above illustrates San Francisco quarterly median sales price movements since 2012, which, as one can see, is also prone to significant fluctuation. In Q1 2017, the median house price basically plateaued year over year, while the median condo price actually increased from Q1 2016. (Historically, it is not unusual for Q1 median prices to drop from Q4 due to seasonal reasons, mainly the characteristic big slowdown of luxury home sales in mid-winter.) Q1 is the quarter of the year with the least number of closed sales, so too much should not be made of its data, but we have summarized annual Q1 dynamics for the past 4 years in the 2 charts below. For context, remember that 2014 and 2015 were particularly feverish markets. A much better assessment of the direction of the 2017 market will be possible after Q2 data is in: March through June is usually the most active selling season of the year.

Year-over-Year Comparisons of Q1 Statistics
Chart 1: San Francisco House Market OverviewChart 2: San Francisco Condo Market Overview————————————————————

Annual Median House Sales Price Trends:
5 Selected San Francisco Neighborhoods, since 2004


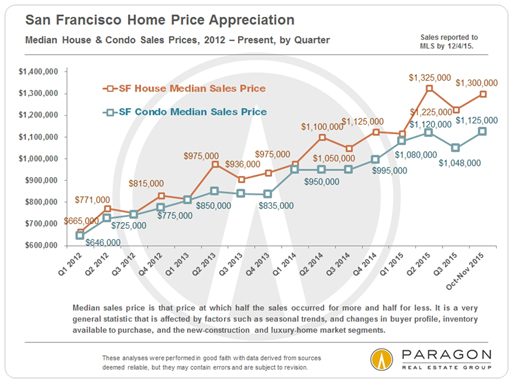
Generally speaking, in higher priced areas, median house prices have been plateauing or dropping a little, while the more affordable neighborhoods have continued to appreciate: This is a relatively common dynamic around the Bay Area.

The only way to assess value or appreciation for a particular home is by performing a comparative market analysis tailored to its specific location, condition and circumstances. Of all the neighborhoods graphed above, the Marina has by far the fewest house sales and the widest range of individual home sales prices, so it is most susceptible to median price fluctuations caused by other factors besides changes in value – for example, a substantial change in the listings available to purchase in a given year. We do not believe that the same Marina house selling in 2015 would have sold for 15% less in 2016: something less, perhaps; 15% less, very unlikely. This is a good illustration of the dangers of making too much of median sales price changes.

If you would like median home price trends for another San Francisco neighborhood, please let us know.

————————————————————

Average Sales Price to Original List Price Percentage

By Month: House, Condo, Co-op, TIC & 2-4 Unit Building Sales
As seen in this chart, overbidding typically heats up as the market moves into spring. So far, this year has been no exception, though the overbidding percentages are somewhat lower than in recent years.


————————————————————

Annual Market Trends
For clarity and meaningfulness, we much prefer annual trend analyses, with their much bigger data sets, and have recently completed a comprehensive review of virtually every statistic we could think of on that basis. Doing so allows us to stand back to see the broader view of what is happening in the market, instead of getting obsessed by what happens to be in front of our shoe. Looking at annual trends, virtually all the market statistics illustrate the same general conclusion: The market became progressively stronger coming out of the 2009-2011 housing recession; the frenzy peaked in 2015; and the market cooled a bit in 2016, condos more so than houses. This is a generalization of the macro-trend: Different market segments have been going in somewhat different directions and speeds in the city and around the Bay Area in the past year or so.

Below are a few of the many analyses. The full review is here: Long-Term Annual Trends in San Francisco Real Estate

First 2 charts: The hotter the market, the greater the percentage of listings that sell quickly, and the more ferocious the competitive bidding on those listings.


Even with some cooling, the overbidding on appealing new listings has remained quite dramatic: Our current percentages over asking would stun anyone from almost any other market in the country. (However, underpricing has also become a more common strategy here than in other markets.)


Annual Trends Chart 3: As a market begins to cool, the number of listings that expire or are withdrawn without selling increases. This is typically due to increasing supply, softening demand, sellers looking for more money than buyers are willing to pay, or all three.


Annual Trends Charts 4 & 5: As new condos and new rental apartments came on the market in greater numbers in the past year, it cooled those two market segments, much more so than the house segment, of which hardly any are built new in the city anymore. (The more affordable house market in the city has remained remarkably hot.) The rental market was affected most as more new rental units came on market than at any time since WWII: Though SF still has the highest rents in the country, they have dropped from their peak in 2015.


Chart 6: To a large degree due to big changes in tenant eviction and condo conversion laws, the TIC market has gone through a large decline in sales volume. It is also true that after decades of turning multi-unit buildings into condos and TICs, the supply of such properties available to do so has declined. Generally speaking, TIC median sales prices plateaued from 2015 to 2016 at about 14% below the median condo price.


————————————————————

San Francisco Luxury Home Market
Three sample charts from our big report on the high-priced home segment. Generally speaking, the luxury market has cooled more than the more affordable segments, and the luxury condo market has cooled more than the luxury house market. This is mostly due to the recent surge of new-construction luxury condos onto the market in the city.

The first two charts below are snapshots of either the house or condo segment of the luxury market in two of our major districts.


This next chart illustrates one of the bigger changes in SF high-end home markets. Many more listings, resale luxury condos in particular, are expiring or being withdrawn from the market without selling.


Our full report is here: Luxury Home Market of San Francisco

————————————————————

Interest Rates
Constantly shifting economic and political factors continue to affect rates: Mortgage interest rates are significantly up since the election, fluctuating up and down since the year began, but still far below historical norms. This is a factor everyone is watching carefully because of its potential impact on affordability, already a big issue in the Bay Area.

Apartment Building (Multi-Unit Residential) Sales
We have also released our quarterly report on the multi-unit residential property markets of San Francisco, Marin and Alameda Counties: Bay Area Apartment Building Market. Below is one of its many analyses.


————————————————————
All our reports can be found on our redesigned website: Paragon Market Reports

Using, Understanding and Evaluating Real Estate Statistics

If you will forgive a little celebrating on our part: In the last two quarters, Paragon sold more San Francisco residential and multi-unit residential real estate than any other brokerage (as reported to MLS, per Broker Metrics), even though we have far fewer agents than many of our competitors.

If you have any questions or comments regarding this report, or if assistance can be provided in any other way, please call or email.


————————————————————


It is impossible to know how median and average value statistics apply to any particular home without a specific comparative market analysis, which we are happy to provide upon request.

These analyses were made in good faith with data from sources deemed reliable, but may contain errors and are subject to revision. It is not our intent to convince you of a particular position, but to attempt to provide straightforward data and analysis, so you can make your own informed decisions. Median and average statistics are enormous generalities: There are hundreds of different markets in San Francisco and the Bay Area, each with its own unique dynamics. Median prices and average dollar per square foot values can be and often are affected by other factors besides changes in fair market value. Longer term trends are much more meaningful than short-term.


© 2017 Paragon Real Estate Group

No one knows San Francisco real estate better than Paragon.

Paragon Real Estate Group
www.paragon-re.com/

Pota Perimenis
Lic# 01117624
1400 Van Ness Avenue
San Francisco, CA 94109
Direct 415-738-7075
Cell 415-407-2595
pperimenis@paragon-re.com
www.sfcityhomes.com


Gold, Google and SF Real Estate


Paragon Real Estate Group

Paragon Real Estate Group
 

Gold, Google, Facebook & San Francisco Homes
Return on Investment Rates since 2011Penthouses, Probates, Fixer-Uppers & Panoramic Views
A Survey of the SF Real Estate Market in 2016


January 2017 Report
including over 20 custom charts


————————————————————


This first chart is a somewhat lighthearted, but we believe accurate look at how various 2011 investments would have played out through 2016. (FB is dated from its 2012 IPO.) When calculating appreciation, purchase and sale dates are critical factors, and changing those can alter the results significantly: Using 2011, the last bottom of the real estate market, as the purchase date certainly plays to the advantage of home price increases. If you bought gold or soybeans in 2011, you really should have sold them a couple years ago at the height of the commodity price boom.Besides the appreciation percentage noted, buying a home in 2011 with all cash would have generated large, additional financial returns in the form of extremely low monthly housing costs. Buying it with 20% down supercharges the return on cash investment, and that is before adding in other advantages: Even with an 80% loan, by 2016 your monthly housing costs, with recent low interest rates and tax advantages, would be well below market rents. Then there is the huge capital gains exclusion on the sale of a primary residence, which would not apply to other investments.

————————————————————

Sales of Probates, Penthouses, Fixer-Uppers, Lofts;
Homes with Views, Elevators & Wine Cellars

————————————————————

Long-term San Francisco
Median Home Price Appreciation


San Francisco median house prices continued to appreciate in 2016, albeit, at 6%, at a considerably slower rate than the previous 4 years, while condo prices basically plateaued (and indeed dipped in some neighborhoods). As with almost everything to do with real estate values, it boils down mostly to supply and demand, as discussed below.


In 2016, the supply (and sales) of house listings in the city continued to dwindle, while a surge of new-construction condo projects hitting the market appreciably increased the inventory of condos available to purchase. In 2003, house sales in San Francisco were over 50% higher than in 2016. According to a study by the National Association of Realtors, the median time house owners are staying in their homes has jumped from an average of 6 years in 1987-2008 to 9 years since: Owners are getting older, not changing jobs as often, and baby boomers are aging in place as NAR put it. House owners sell their homes much less frequently than condo owners, who tend to be younger. In SF, there is also the factor of a reluctance to sell when that means facing a very challenging market for buyers. And with very low interest rates, and very high rents, some owners are renting out their houses instead of selling.

It all boils down to a continuing strong demand for houses meeting a steadily declining supply: Even with a market that cooled somewhat in 2016, competition between buyers continues to push house prices up, especially in more affordable neighborhoods. The equation is different for condos, which has become the dominant property-sales type in the city: A cooling market is meeting increased supply. There has been no crash in condo prices, but areas with the greatest quantity of new condo construction have seen small declines.


————————————————————
What Costs How Much Where in San Francisco
Below are a few of our many updated analyses on home sales and prices by neighborhood, property type and bedroom count.

House Sales & Values


As can be seen above, two of the most affordable districts for houses, Districts 10 and 2, also provide 37% of all the house sales in the city. Generally speaking, they have continued to experience very strong buyer demand in 2016.

Condo Sales & Values


District 9, a large district that stretches from SoMa, South Beach and Mission Bay to Potrero Hill, Dogpatch and Inner Mission, is increasingly dominating condo sales in the city. The great majority of new condo construction, especially of the largest projects, has been occurring in this district.

All our breakdowns by neighborhood and home size are here: SF Home Price Tables


————————————————————
Home Sales by Price Segment by District
Behind the overall median prices often quoted is a wide range of individual sales across a spectrum of prices. Here are a few of our updated analyses for every district of the city.


Our complete collection of district analyses: SF District & Neighborhood Sales Breakdowns

————————————————————

San Francisco Overview Market Statistics
The following classic measures of market heat all tell the same story: Coming out of the recession in 2011, the San Francisco market became increasingly frenzied through the spring of 2015. In late 2015, as housing affordability became a critical issue, and the local high-tech economy saw some cooling, and financial markets worldwide experienced increasing volatility, the SF real estate market began to cool and normalize. Buyer competition for new listings softened, overbidding declined, days-on-market increased, appreciation declined or plateaued, and so on. And the condo market cooled more than the house market due to issues discussed above.

2016 saw a reasonable adjustment to a desperately overheated market, but nothing that suggests, so far, an imminent, dramatic downturn. Indeed, by national standards, most of our current statistics still define a relatively robust market. In a recent interview, Ted Egan, chief economist of the City of San Francisco, put the odds of a new recession at 10% or less.

————————————————————

Real Estate Market Seasonality
Listing and sales activity builds from early January, the nadir of the market, into spring, typically the most active season. Accepted-offer activity provides an excellent illustration of the heat of the market during different times of the year.


————————————————————

3 Important Economic Indicators

San Francisco & Bay Area Employment Trends
After dropping a little in the first half of 2016, SF and Bay Area employment numbers jumped back up in the second half, an encouraging sign for the local economy.


Mortgage Interest Rates in 2016
Interest rates popped 22% higher since the election, though they still remain very low by any historical measure. Where they will go now is a subject of intense speculation since they are a critical component of housing affordability.


The S&P 500 Stock Index since 1994
To the surprise of many, U.S. stock markets also popped after the election to their highest points ever.


————————————————————

And now on to 2017, certain to be another interesting year.

Wishing you and yours a safe, healthy, happy and prosperous New Year.

————————————————————


It is impossible to know how median and average value statistics apply to any particular home without a specific comparative market analysis, which we are happy to provide upon request. Please call or email if you have any questions or need assistance in any way.

These analyses were made in good faith with data from sources deemed reliable, but may contain errors and are subject to revision. It is not our intent to convince you of a particular position, but to attempt to provide straightforward data and analysis, so you can make your own informed decisions. Median and average statistics are enormous generalities: There are hundreds of different markets in the Bay Area, each with its own unique dynamics. Median prices and average dollar per square foot values can be and often are affected by other factors besides changes in fair market value. Longer term trends are much more meaningful than short-term.


© 2017 Paragon Real Estate Group
No one knows San Francisco real estate better than Paragon.
Paragon Real Estate Group
www.paragon-re.com/

Pota Perimenis
Lic# 01117624
1400 Van Ness Avenue
San Francisco, CA 94109
Direct 415-738-7075
Cell 415-407-2595
pperimenis@paragon-re.com
www.sfcityhomes.com


148 Cole Street-Just Sold-NOPA Condo

This month I sold 148 Cole Street, a lovely full floor condominium near Hayes Street for $907,000. We received multiple offers.

Typically, a property is vacant and staged for sale. This is fine if it’s possible. But not every seller is willing/able to move out of their home and stage before going on the market. This is fine too. Sellers living in their homes while they are marketed can still maximize their value–with the right marketing strategy and the right Realtor.

I have sold hundreds of homes in all markets and circumstances. I have never had a dissatisfied client. I put 100% of my energy, resources and 25 years of committed experience into every transaction. I limit the number of clients I work with to maintain the quality of my service. And no one knows the NOPA market and neighborhood better than I do. If you are thinking of selling I would love to help you too.

Give me a call and we can talk. 415-407-2595. There is no cost or obligation. Thank you!

Pota Perimenis
Local NOPA expert. Live. Love. NOPA.

“Pota has great insight, is a specialist in the NOPA area, and has great customer service skills. Her research and strategy skills resulted in a maximum return for our property.” B. Yokoyama, Satisfied NOPA seller.

San Francisco Short Term Rental Ordinance goes into effect


 San Francisco Short Term Rental Ordinance goes into effect

Effective February 1, 2014, property owners and tenants who plan to rent their unit (or portion of their unit) on sites like Airbnb will need to have their property added to SF’s Short-Term Rental Registry.

For more information on the ordinance, including access to the application and how to schedule an appointment, click here. 

From the city’s website:

What is the SF Short-Term Residential Rental Ordinance?
On October 27th, 2014 Mayor Lee signed San Francisco Ordinance No. 218-14, amending the Administrative and Planning Codes to allow some residential properties to conduct short-term residential rentals without violating the requirements of the City’s Residential Unit Conversion and Demolition Ordinance (Administrative Code Chapter 41A) or the Planning Code. A short-term residential rental is a rental of all or a portion of your residential unit for periods of less than 30 nights. This law will become effective on February 1st, 2015. At that time, eligible Permanent Residents (owners and tenants) will be able to apply to place their residential unit on the Planning Department’s Short-Term Residential Rental Registry.

What can I do with a Short-Term Residential Rental Registration?
With a valid Short-Term Residential Rental Registration you may rent your primary residential unit for periods of less than 30 nights without violating the requirements of the City’s Residential Unit Conversion and Demolition Ordinance (Administrative Code Chapter 41A) or the Planning Code. This includes renting a portion or your entire unit while you are also present for an unlimited number of nights per year and renting a portion or your entire unit while you are not present for a maximum of 90 nights per year.

How can I apply to be on the Registry?
Short-Term Residential Rental Applications will be made available online and at the Planning Information Center (PIC) located at the ground floor of 1660 Mission Street. To register your unit, you will need to make an appointment with the San Francisco Planning Department to meet with staff and submit your application. Applications must be filed in person by the permanent resident whose name will appear on the registry. Applications may not be filed by representatives or agents. Drop-ins or dropped off applications will not be accepted. The Planning Department will begin conducting intake appointments on Monday, February 2nd. To schedule an intake appointment, please call 415-575-9179 after Monday, January 26th.

You may not rent your unit (in all or a portion) as a short-term residential rental until you have received a Short-Term Residential Rental Registration number from the Planning Department.

Who is eligible to register?
In order to conduct a short-term residential rental you must meet all of the following conditions:

  • You must be the Permanent Resident (owner or tenant) of the residential unit that you wish to rent short-term. This means you must live in that specific residential unit for at least 275 nights of any given calendar year. If you are a new resident you must have occupied this specific unit for at least 60 consecutive days prior to your application. If you own a multi-unit building, you may only register the specific residential unit in which you reside.
  • You must obtain liability insurance in the amount of no less than $500,000 or provide proof that liability coverage in an equal or higher amount is being provided by any and all hosting platforms through which you will rent your unit.
  • Your residential unit must not have any outstanding Planning, Building, Housing, Fire, Health, Police, or other applicable City code violations.
  • You may only register one residential unit.
  • Please note that residential units that are subject to the Inclusionary Affordable Housing Program and residential units designated as below market rate (BMR) or income-restricted under City, state, or federal law are not eligible to register.
  • Important note for tenants:  The Planning Department strongly recommends that you review your lease before submitting an application. The registration of your residential  unit on the Short-Term Residential Rental Registry does not override any lease agreements, homeowner’s association bylaws, Covenants, Conditions & Restrictions (CC&Rs), or any other agreement, law, or regulations that prohibit subletting or use of your unit as a short-term residential rental.

Is there an application fee?
Yes. The fee for the initial application is $50.00. Your registration will remain valid for two years (pending the registered unit remains in good standing)

At your appointment you will need to provide all of the following items:

  • A completed Short-Term Residential Rental Application (download application packet here)
  • A Business Registration Certificate issued by the San Francisco Treasurer and Tax Collector’s Office
  • Driver’s License or State Issued ID Card issued at least 60 days prior to the short-term residential rental application date and valid for at least the next 6 months, with address of the registered unit
  • Proof of  liability insurance in the amount of no less than $500,000
  • A signed affidavit agreeing to abide by all conditions of the short-term residential rental ordinance included within the application (download application packet here).
  • A check made out to the San Francisco Planning Department for $50.00
  • At least two of the following listed documents to confirm your primary residency at your residential unit:
  • Proof of a Homeowner’s Tax Exemption. Accepted as a form of residency confirmation only if the proof of a Homeowner’s Tax Exemption is for a property that is either a single-family dwelling or condominium; 
  • Voter Registration Card or Certificate with the address on the application, issued at least 60 days prior to the short-term residential rental application date. You may obtain a copy through the San Francisco Department of Elections;
  • Proof of Vehicle Registration with the address on the application, issued at least 60 days prior to the short-term residential rental application date;
  • Proof of car insurance, showing address of registration, issued at least 60 days prior;
  • Original utility bill, issued by a public utility or PG&E, at least 60 days prior to the short-term residential application date. Copies and printouts will not be accepted. You may only use utility bills as one form of residency confirmation. Cable, cell phone, and internet bills do not qualify.

If you are a tenant of your residential unit you will also need to provide a copy of your lease or rental agreement. Please note that upon receipt of your completed application, the Planning Department will send a notice to the owner(s) of your unit, informing the owner(s) that your application has been received.

What will happen at my intake appointment?
Staff will review your application and related materials for completeness and intake. Only applications deemed complete at the time of submittal will be accepted for intake and further review. Additionally, staff will go over conditions and limitations of renting your unit as a short-term rental.

What happens after I’ve submitted my application?
It is expected that the Planning Department will review a completed application within fifteen (15) business days. If the Planning Department determines that your application meets the criteria then your unit will be added to the Short-Term Residential Rental Registry. You will you receive a “Short-Term Residential Rental” certificate by mail, which contains your assigned Registration Number. This registration number must be included at the top of all short-term rental listings’ descriptions (online or otherwise). We recommend that you place this certificate in plain view within your unit.

What can I do and not do once I have obtained a Short-Term Residential Rental Registration Number?
Once you have obtained a Short-Term Residential Rental Registration Number, you may use your residential unit as a short-term residential rental without violating Administrative Code Chapter 41A or the Planning Code  under the following conditions:

  • You may rent the residential unit (in all or a portion) while you are not present for a maximum of 90 nights per calendar year.
  • You may rent a portion of the residential unit while you are present for an unlimited number of nights per year.
  • You may advertise your residential unit on any and all hosting platforms under the condition that you list your registration number at the top of all listings’ descriptions.

What you may not do with your Primary Residence registered as a Short-Term Residential Rental:

  • You may not rent your residential unit or a portion thereof for more than 90 nights per calendar year while you are not also present during the time of the guests’ stay.
  • You may not rent illegal residential units or unpermitted spaces associated with your property.
  • If you are a tenant, you may not make more than your monthly rent from your short-term rental fees charged to guests.


715 and 715 1/2 A and B Lyon

Welcome to 715 and 715 ½ A and B Lyon Street, a rare NOPA property which includes two buildings on one lot! The front single family home is a well-preserved, up-to-date Victorian lady. In the gold leaf-accented, gingerbread facade, you see Stick & Queen Anne styles. As you enter, the foyer opens to an elegant living room featuring a large bay window accented by cherub brackets, built-in bookshelves & a wood burning fireplace. There are two bedrooms, two remodeled bathrooms, and a spacious, eat-in kitchen. Downstairs is a wonderful bonus space currently used as an office, additional storage, washer/dryer and parking. The yard offers an enclosed grassy area with a lemon tree and pleasant outlooks towards other gardens. The back house is now divided into two one bedroom units (the second unit is unwarranted). 715 ½ B is rented for $1003/month. The front house and lower back unit will be delivered vacant! Click here for property website and more photos.

            • Offered at $1,595,000
            • Front building:
            • A well-preserved, up-to-date Victorian lady with Stick and Queen Anne styles.Gold leaf-accented, gingerbread façade.
            • Two bedrooms, 2 remodeled baths.
            • Elegant living room w/ decorative fireplace
            • Large remodeled eat-in kitchen
            • Delivered vacant
            • Garage additional storage and ​ ​laundry
            • Bonus room behind garage, currently used as office
            • Rear building:
            • Two 1-bedroom units
            • Legality of one of the units is unwarranted.
            • One unit rents for $1003 as of May 1.The other is vacant as a result of a landlord/tenant agreement.
            • Grassy yard and lemon tree
            • Perfect for the owner occupier who wants rental income without having tenants above or below, or for TIC buyers and possible condominium conversion.
            • Easy access to public transportation.

The property’s configuration is perfect for the owner who wishes to own a single family home and to have rental income as well, yet without having neighbors above or below. It may also appeal to TIC buyers with potential for future condominium conversion.

Disclosures available upon request.
http://www.715Lyon.com

Click here for more information.

“Share Your Comments”
Your email address will not be published.

    Your Name (required)

    Your Email (required)

    Subject

    Your Message

    Please copy the verification code below:

    captcha