Here we are in the last quarter of the year! It's definitely feeling a lot like Fall!
Market is still strong, albeit pockets of inactivity. It is exhibiting the typical characteristics of Q3. A surge of inventory after the summer doldrums leads to more choices for buyers and a bit of a slowdown compared to the past six months, especially the superheated spring season.
I’m always available for real estate questions, Realtor referrals outside SF, vendor referrals, or anything else real estate/non-real estate related.
I hope you enjoy this fall season!
Best regards,
Pota
Pota's real estate corner
Reflecting this typically busy time of year, I currently have listings across the city –Excelsior, Potrero Hill, NOPA, Marina. Preparation is key. All our listings are presented so they look their best.
May's newsletter looks at pricing and inventory trends in this "overheated" (my term, but I'm sure some of my clients would agree) market.
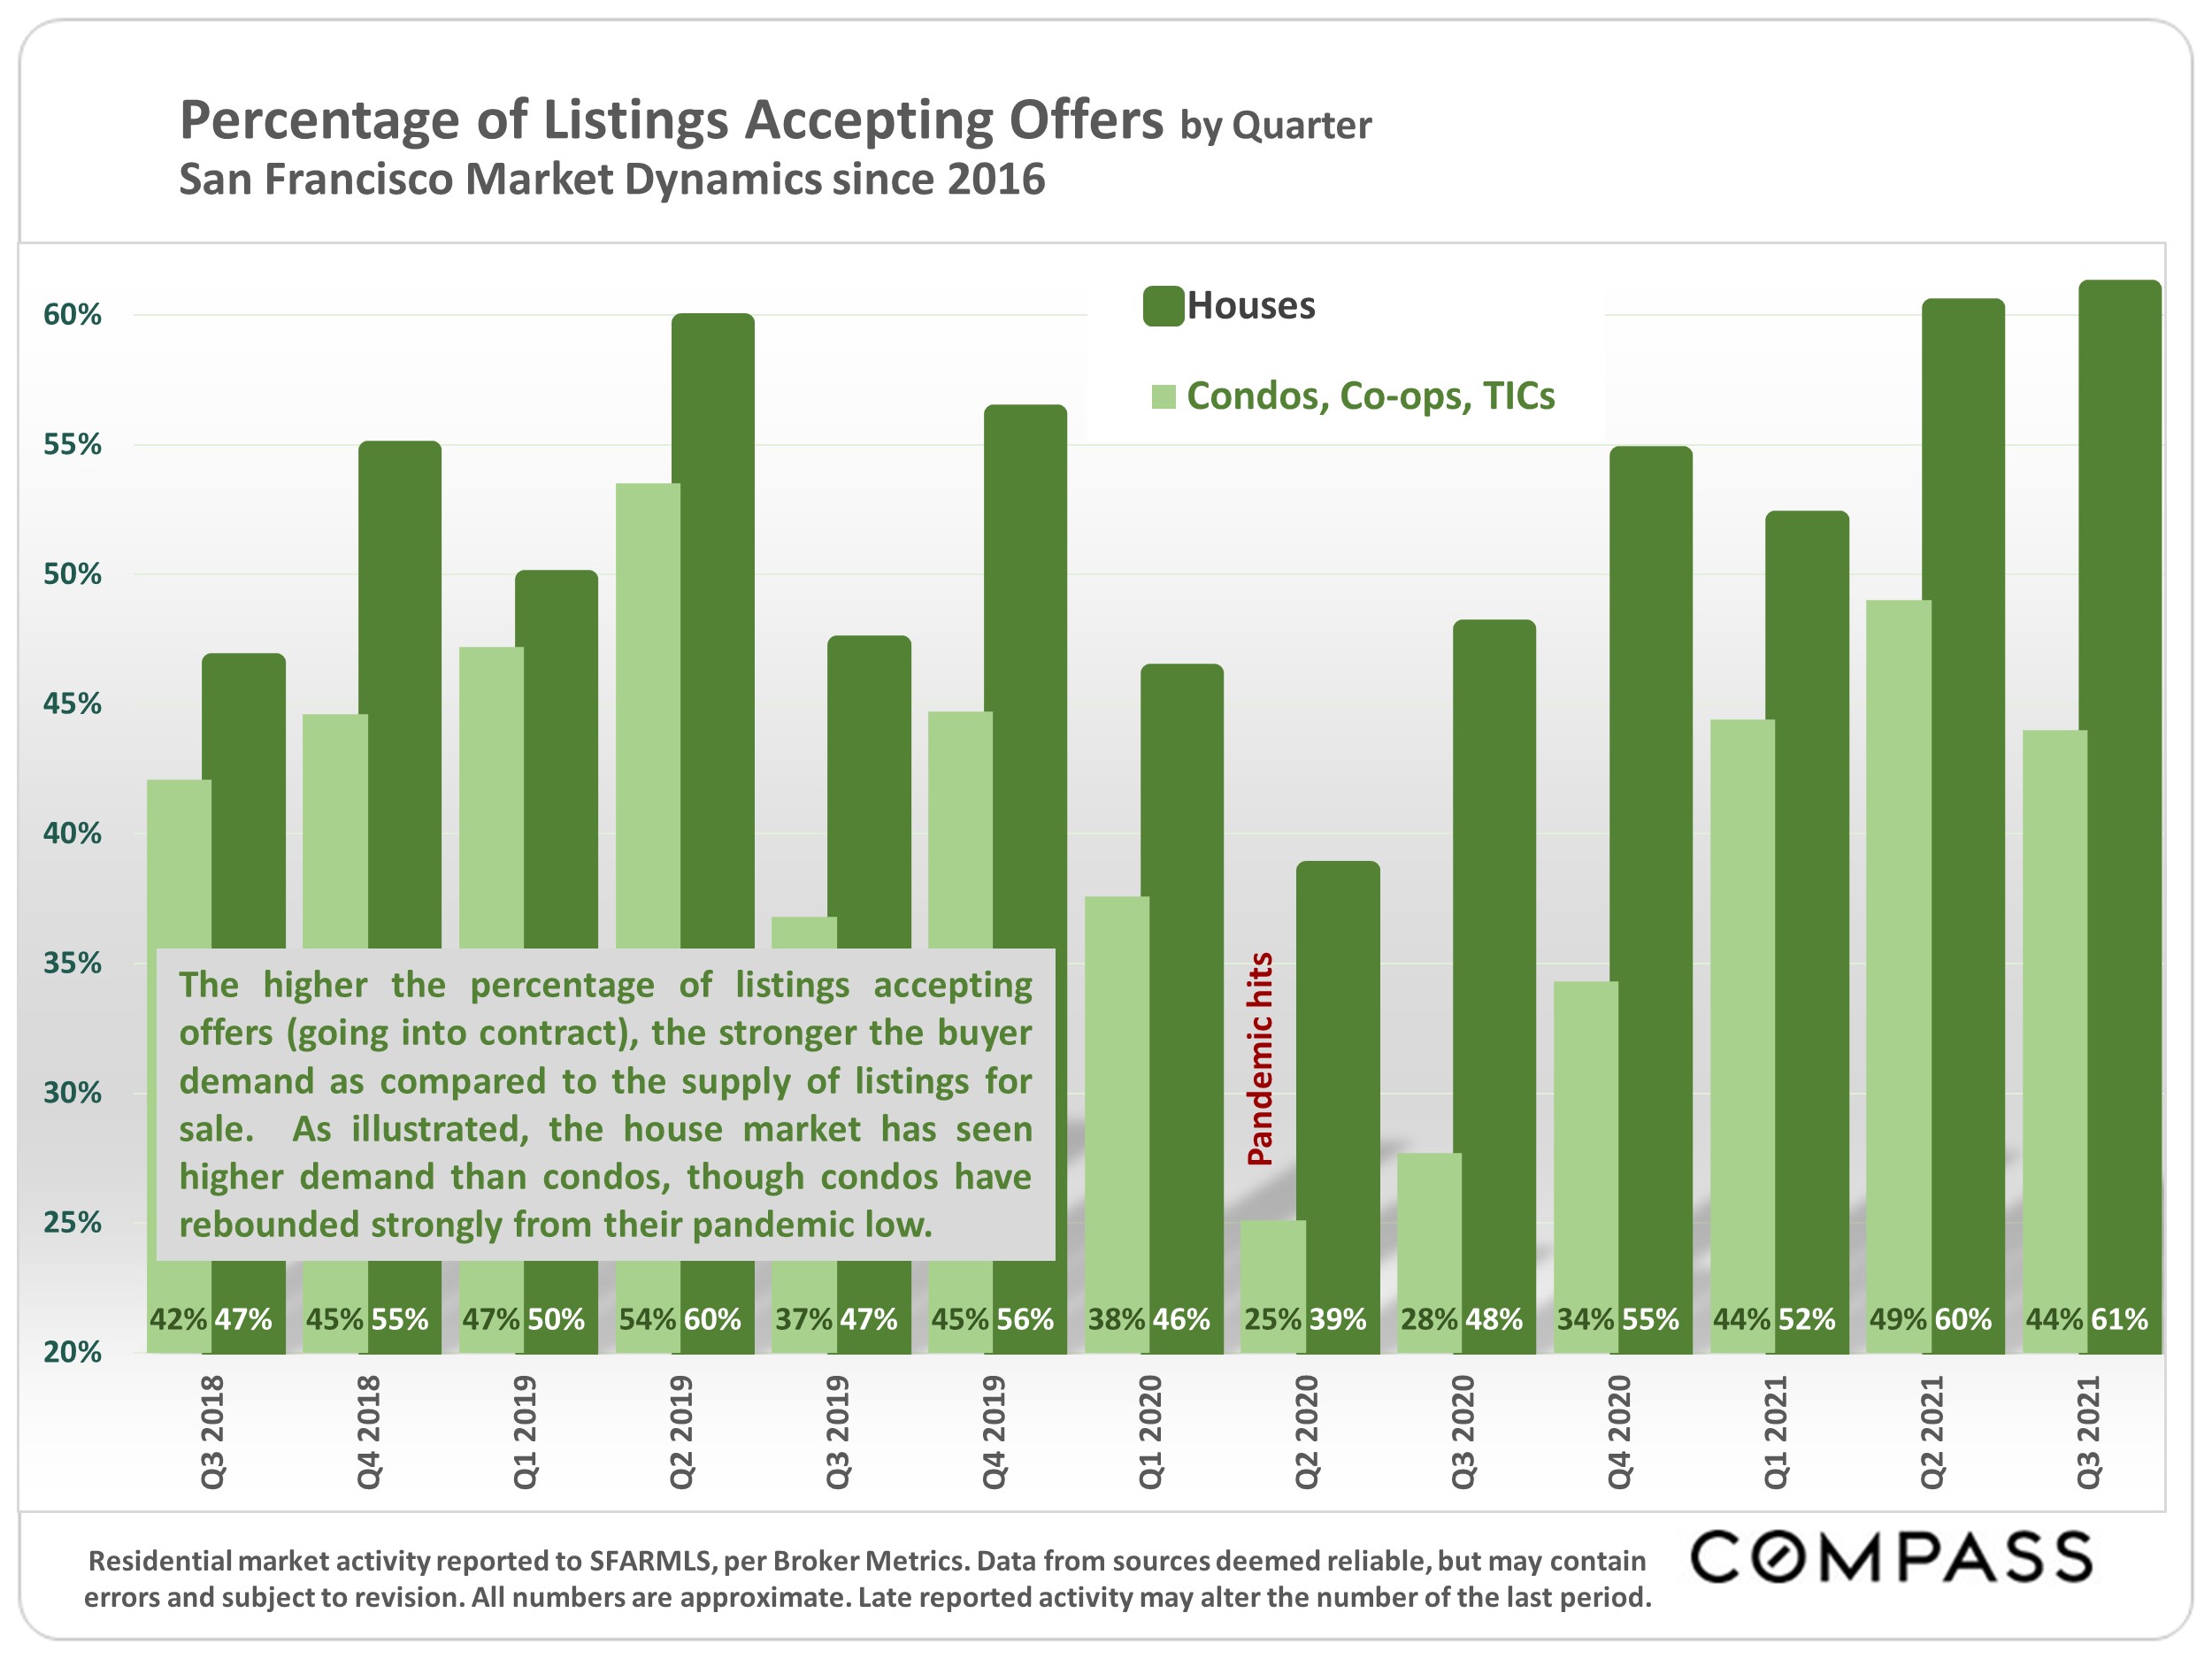
As an example, I just got a buyer into contract after 4 tries. She competed against 19 others to win. She was starting to worry that the door to SF home ownership was closing for her due to rising prices. She is exhausted but ecstatic.
Not enough supply and too much demand is turning real estate into what one expert calls a "luxury commodity."
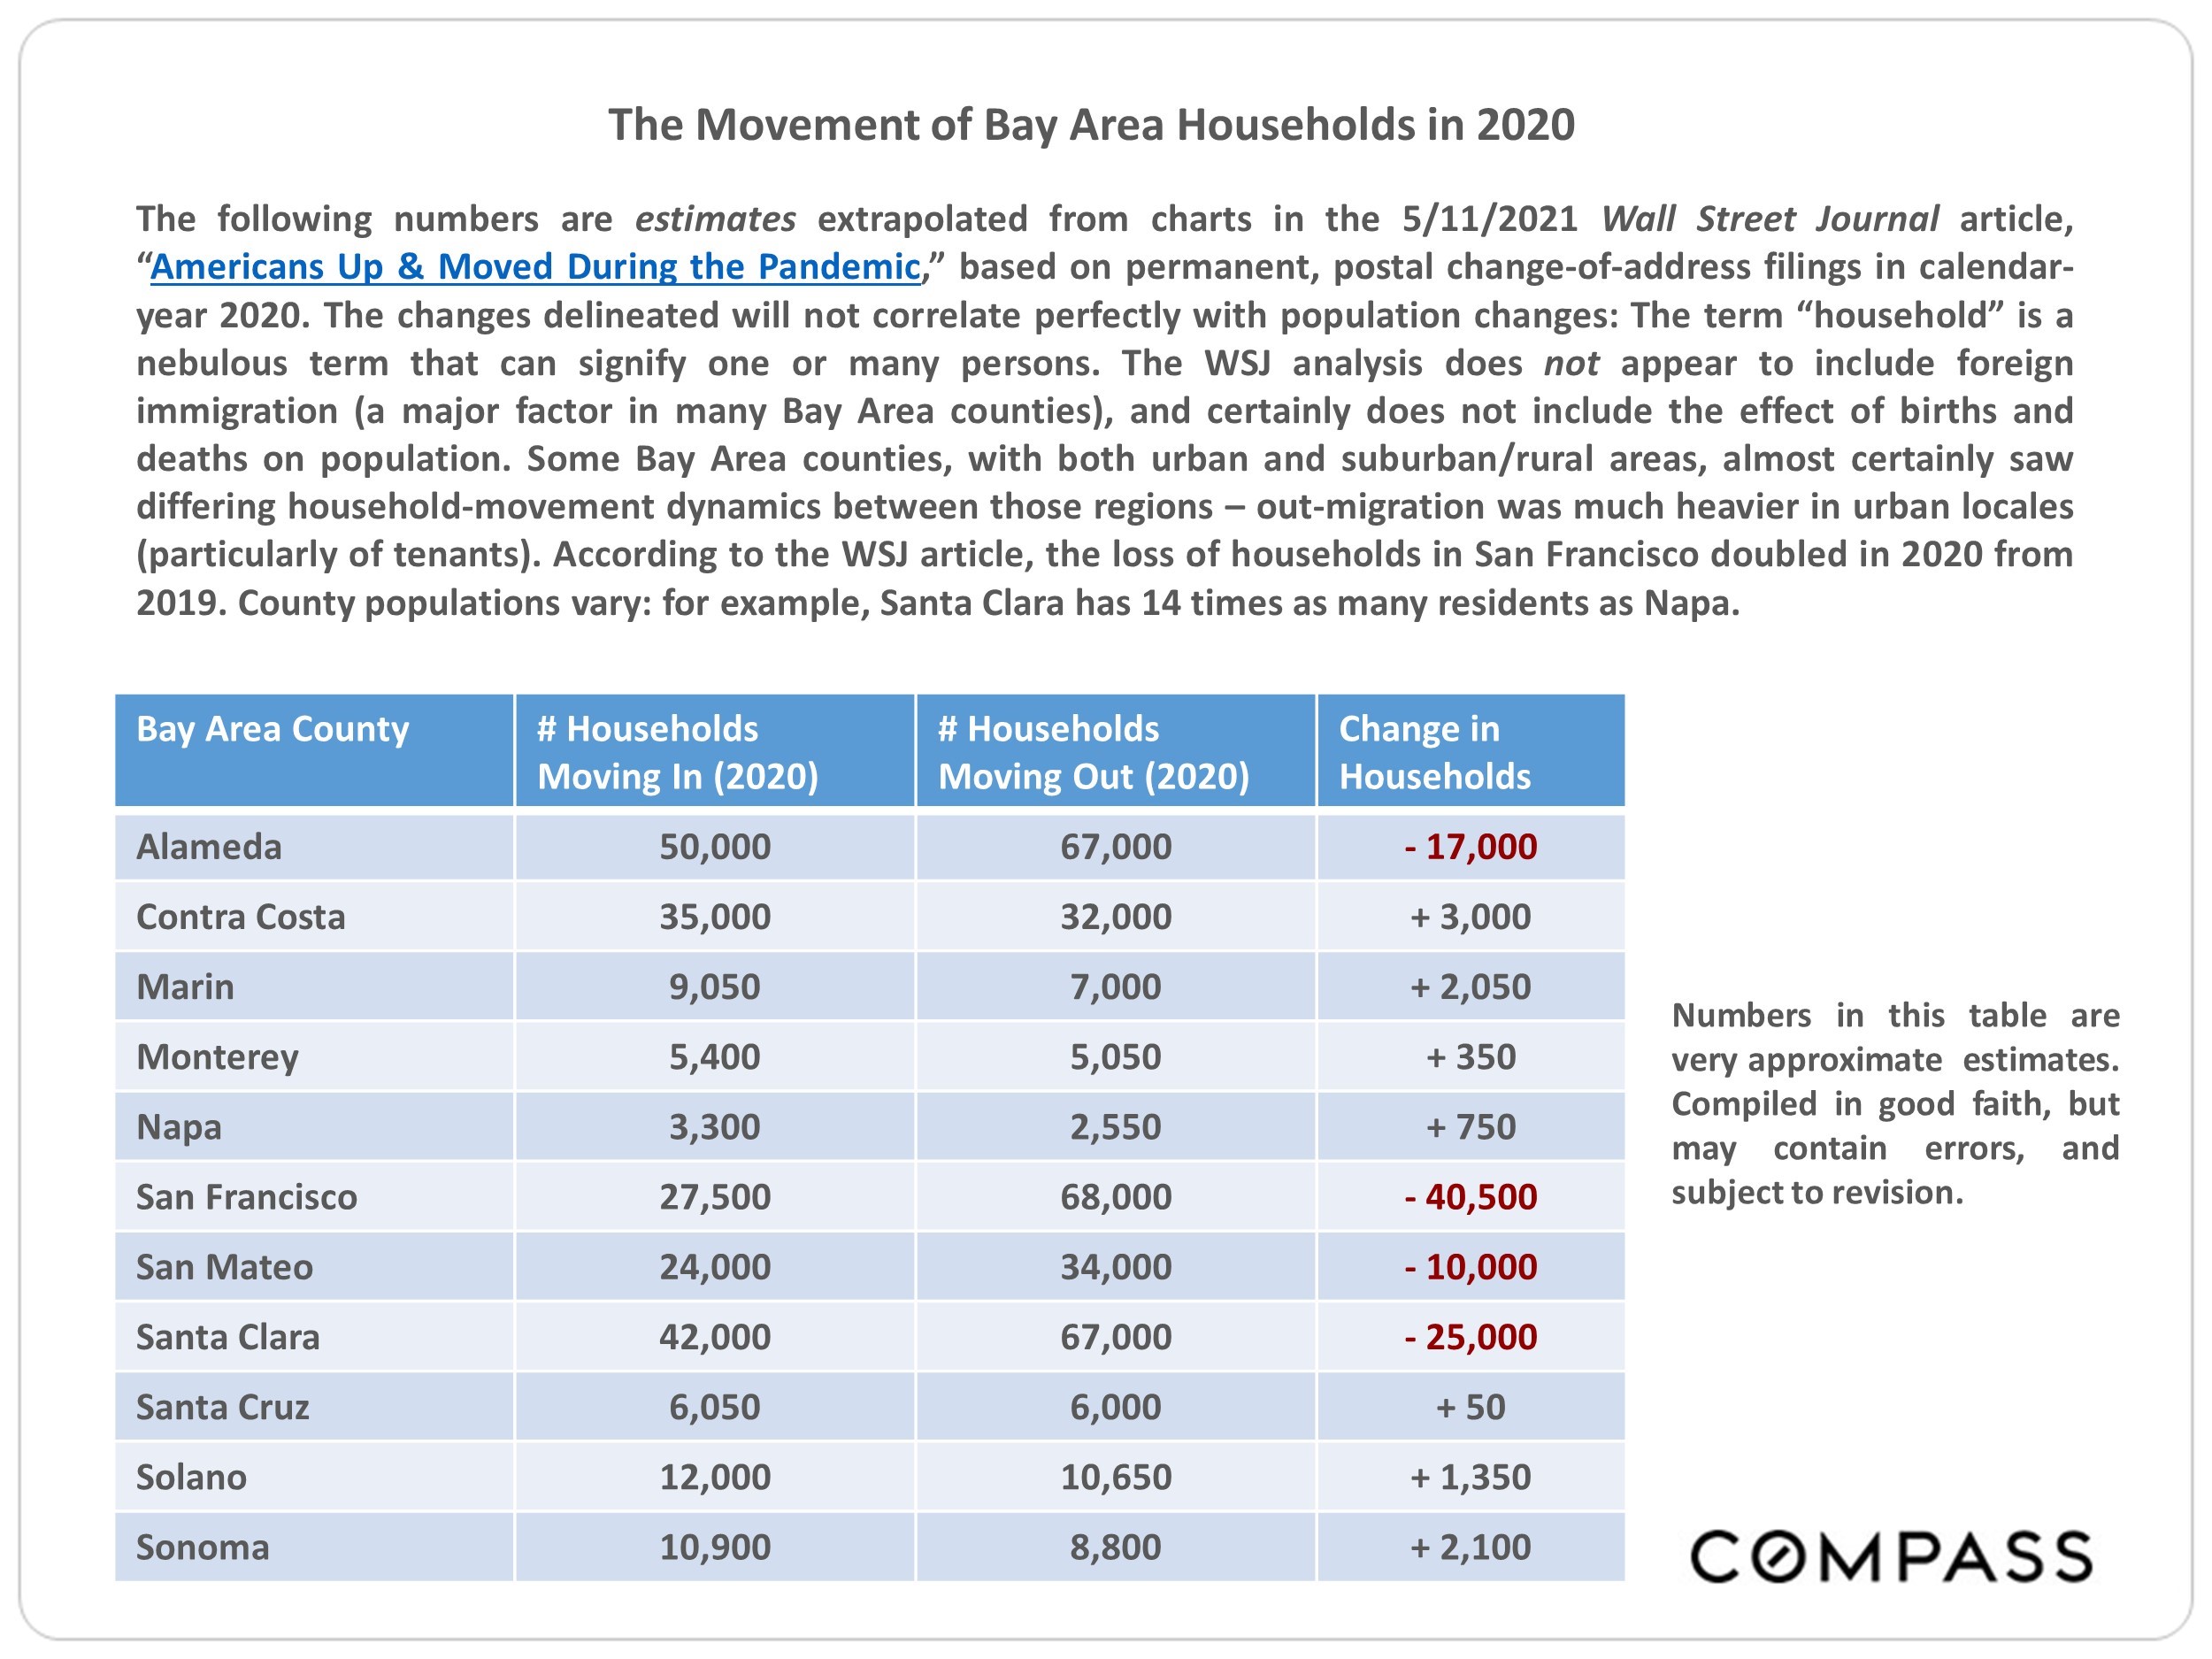
Also included is a look at migration into and out of the bay area. Please click on the link below for the full report.
Please do not hesitate to reach out for vendor or out-of-area Realtor referrals, or just to say hello!
May you all be well. Happy Spring!
Best regards,
Pota
For the full report on Bay area population change and migration, please click the image.
Compass is a real estate broker licensed by the State of California operating under
multiple entities. License Numbers 01991628, 1527235, 1527365, 1356742, 1443761, 1997075,
1935359, 1961027, 1842987, 1869607, 1866771, 1527205, 1079009, 1272467. All material presented
herein is intended for informational purposes only and is compiled from sources deemed reliable
but has not been verified. Changes in price, condition, sale or withdrawal may be made without
notice. No statement is made as to accuracy of any description. All measurements and square
footage are approximate. Equal Housing Opportunity.
The collection will automatically update with any new listings that come on the market.
I will send you an invitation to the collection, so that you can take a look if you wish. Within the collection, you can also create your own searches for other areas as well. I hope you find this feature useful!
Stay healthy,
Pota
San Francisco Real Estate
House & Condo Market Dynamics
Dramatically Diverge
November 2020 Report
SF house and condo markets have been affected differently by the pandemic. This report attempts a deeper dive into the data across the city and within different city districts.
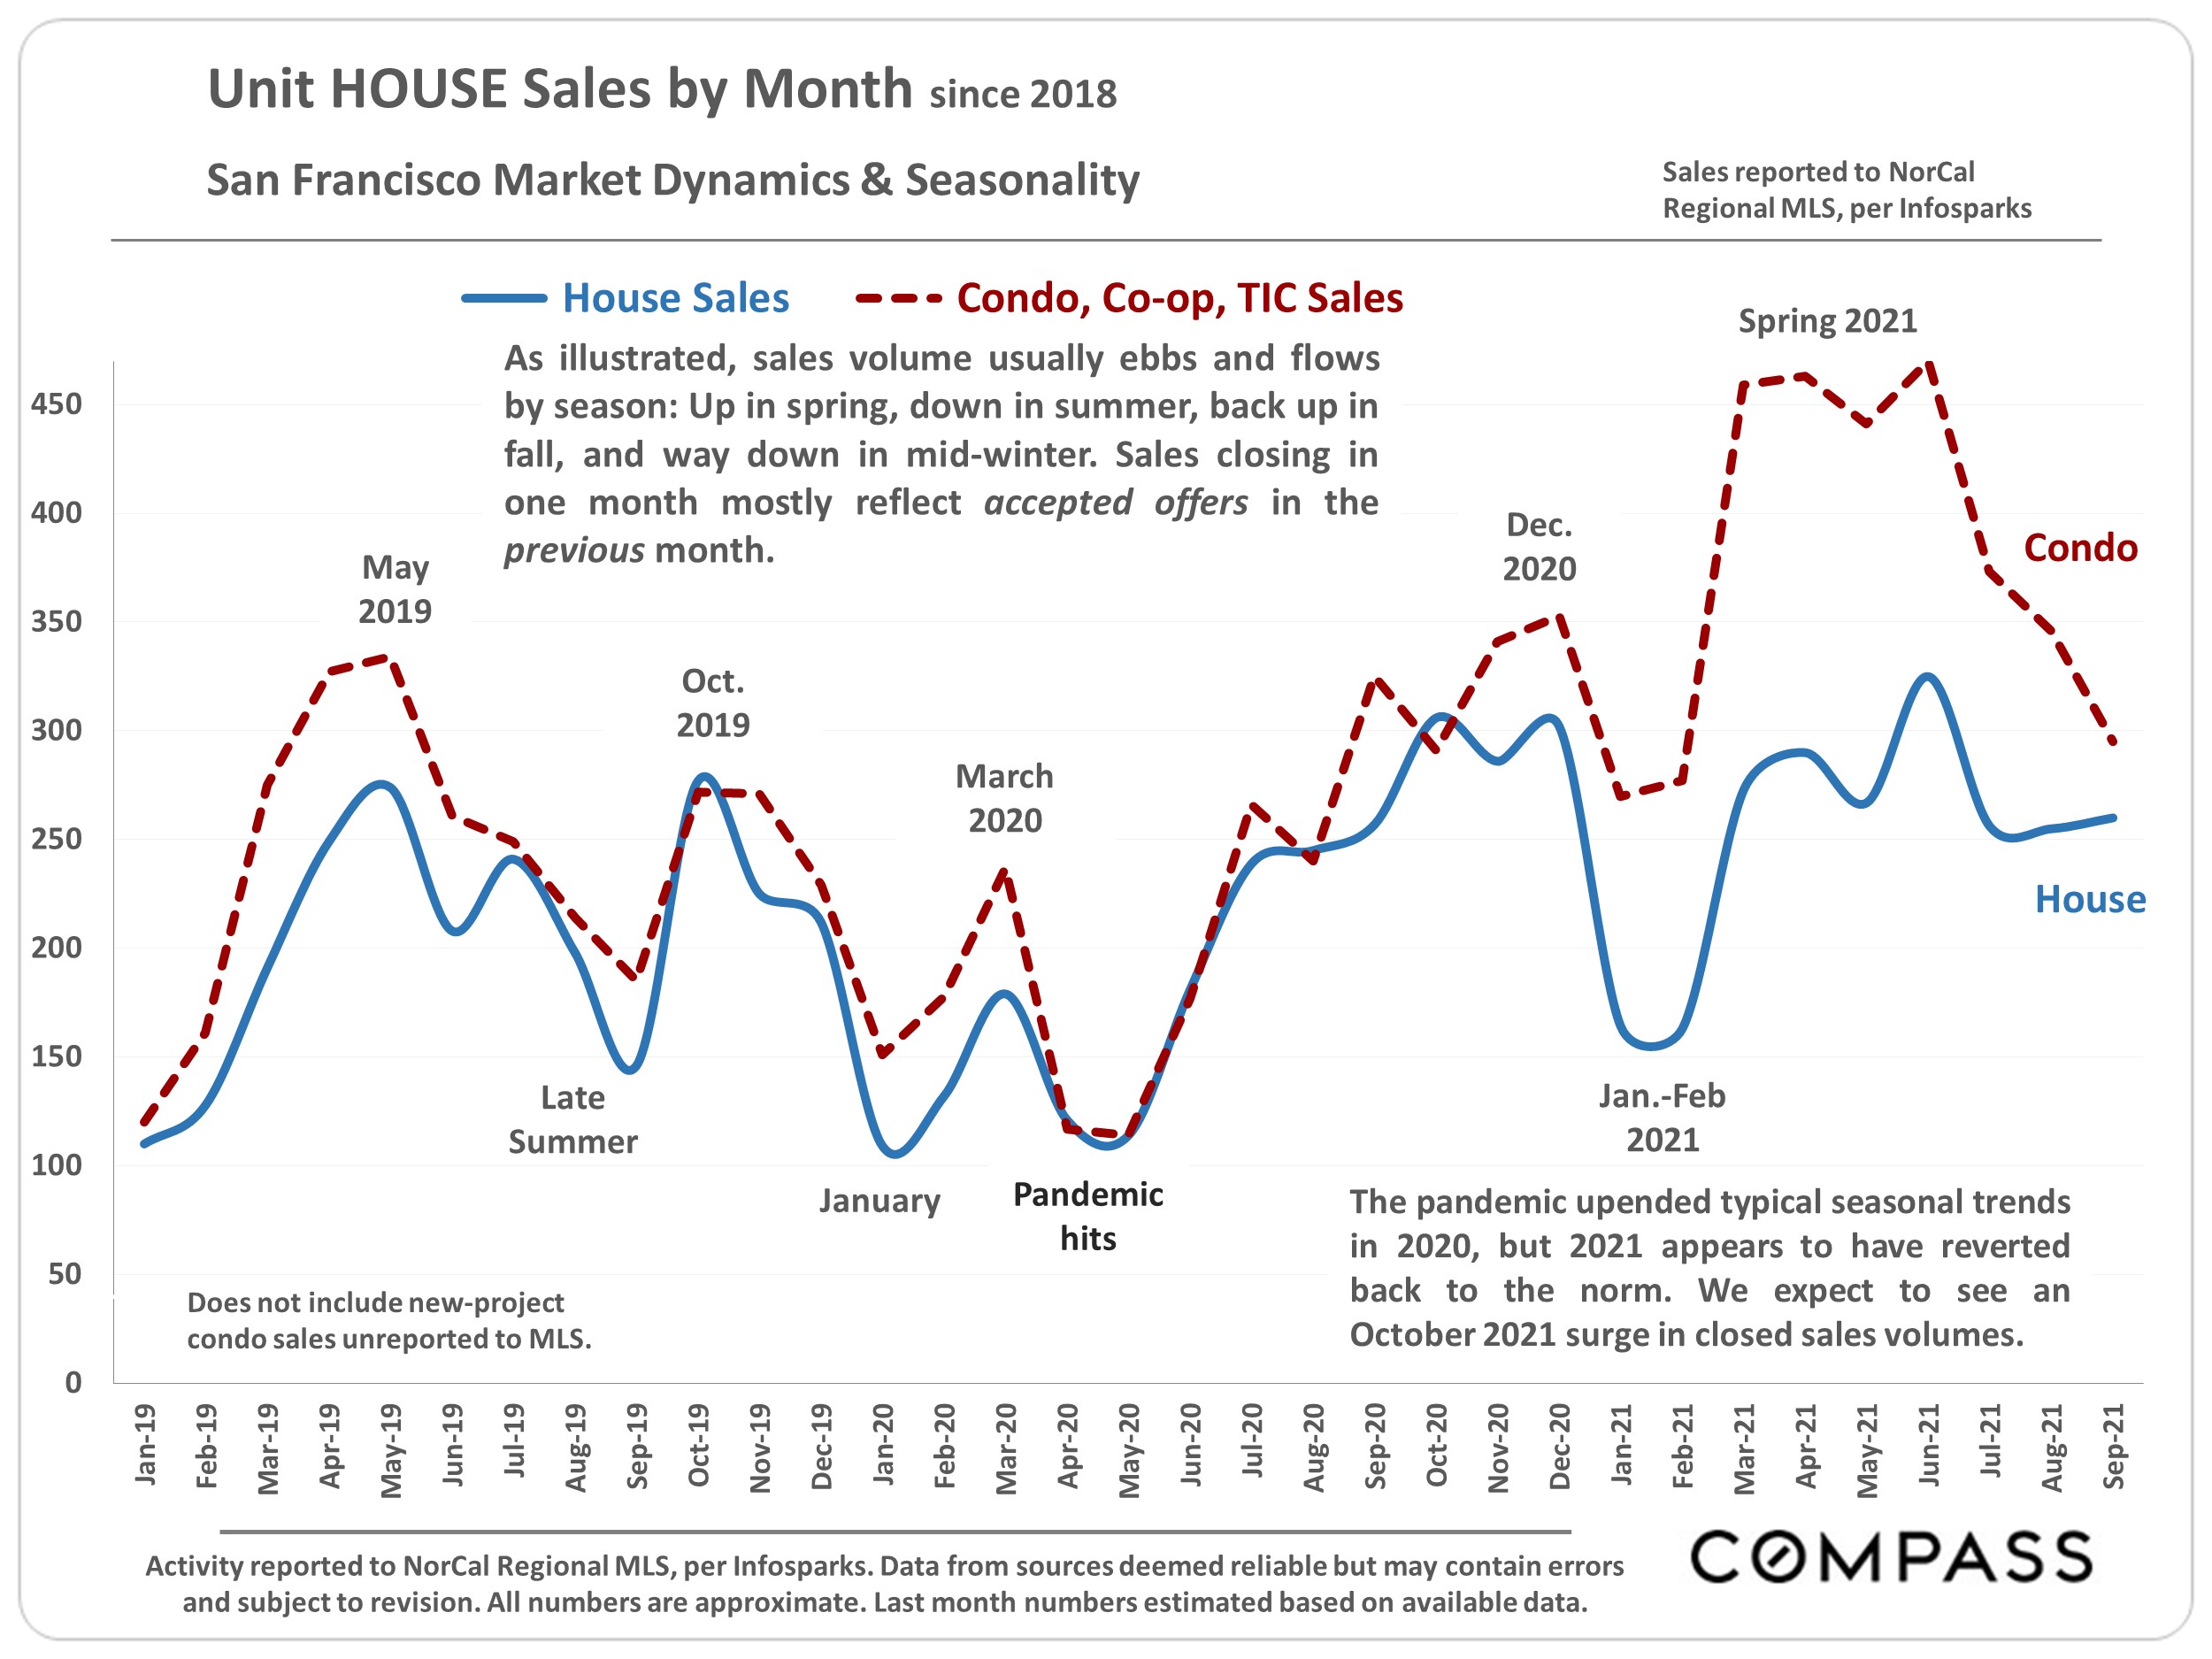
The market typically starts a big slowdown in mid-November, running through the mid-winter holidays, until it begins to wake up in mid-January. High-price segments normally see the most dramatic plunges in mid-winter activity.
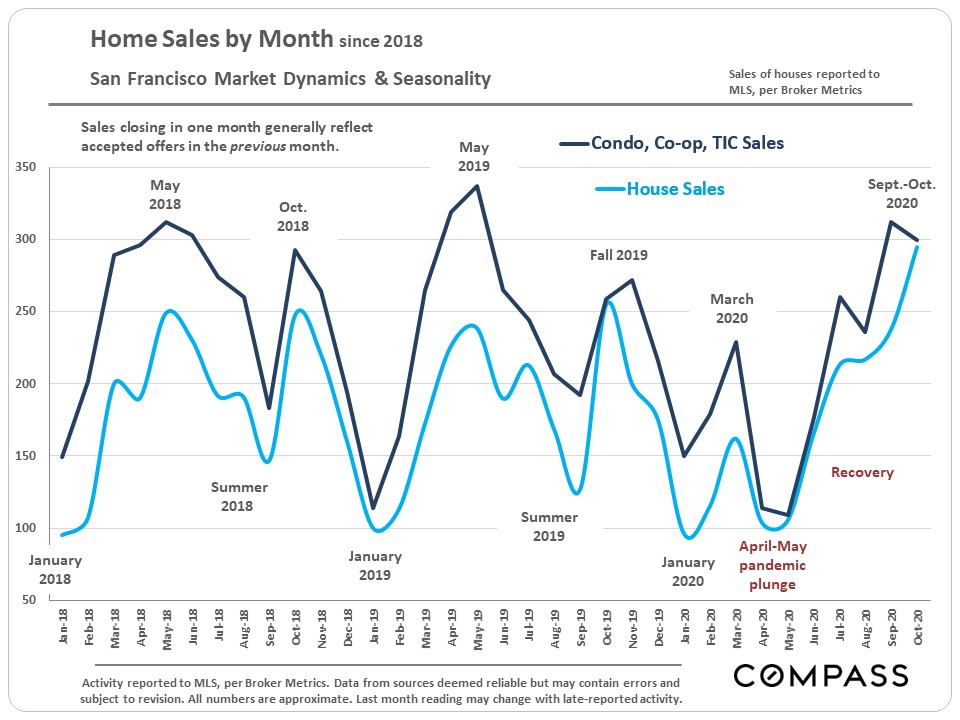
This year, the pandemic upended seasonality: Spring, usually the strongest selling season, saw a crash in activity; summer, which typically slows down – especially for luxury home sales – saw high demand; and the summer market accelerated into autumn. But supply has been accelerating even faster than demand.
We suspect late Q4 will see something of a slowdown, but remain more active than in past years.
Sales rebounded strongly from the early-spring pandemic crash: House sales are higher than in recent years and condo, co-op and TIC sales are at levels comparable to peak sales volumes over that period.
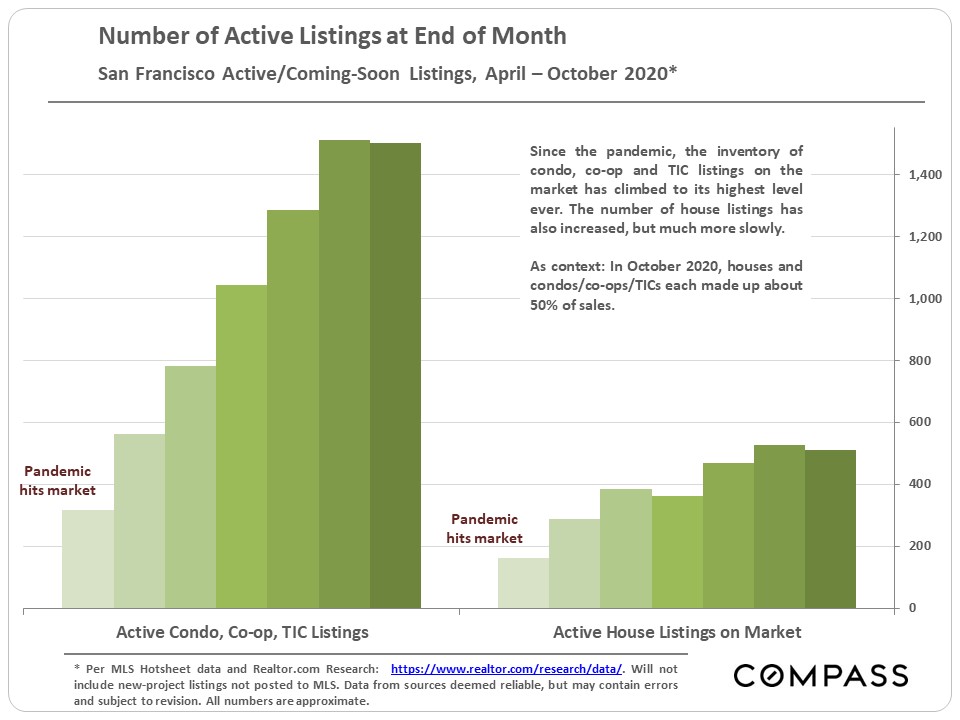
The most dramatic change is the increase in the number of listings for sale. Condo, co-op and TIC listings in MLS are at their highest point ever, approximately 85% higher than one year ago. House listings are also up, but much less dramatically, running about 20% to 25% higher than in autumn 2019.
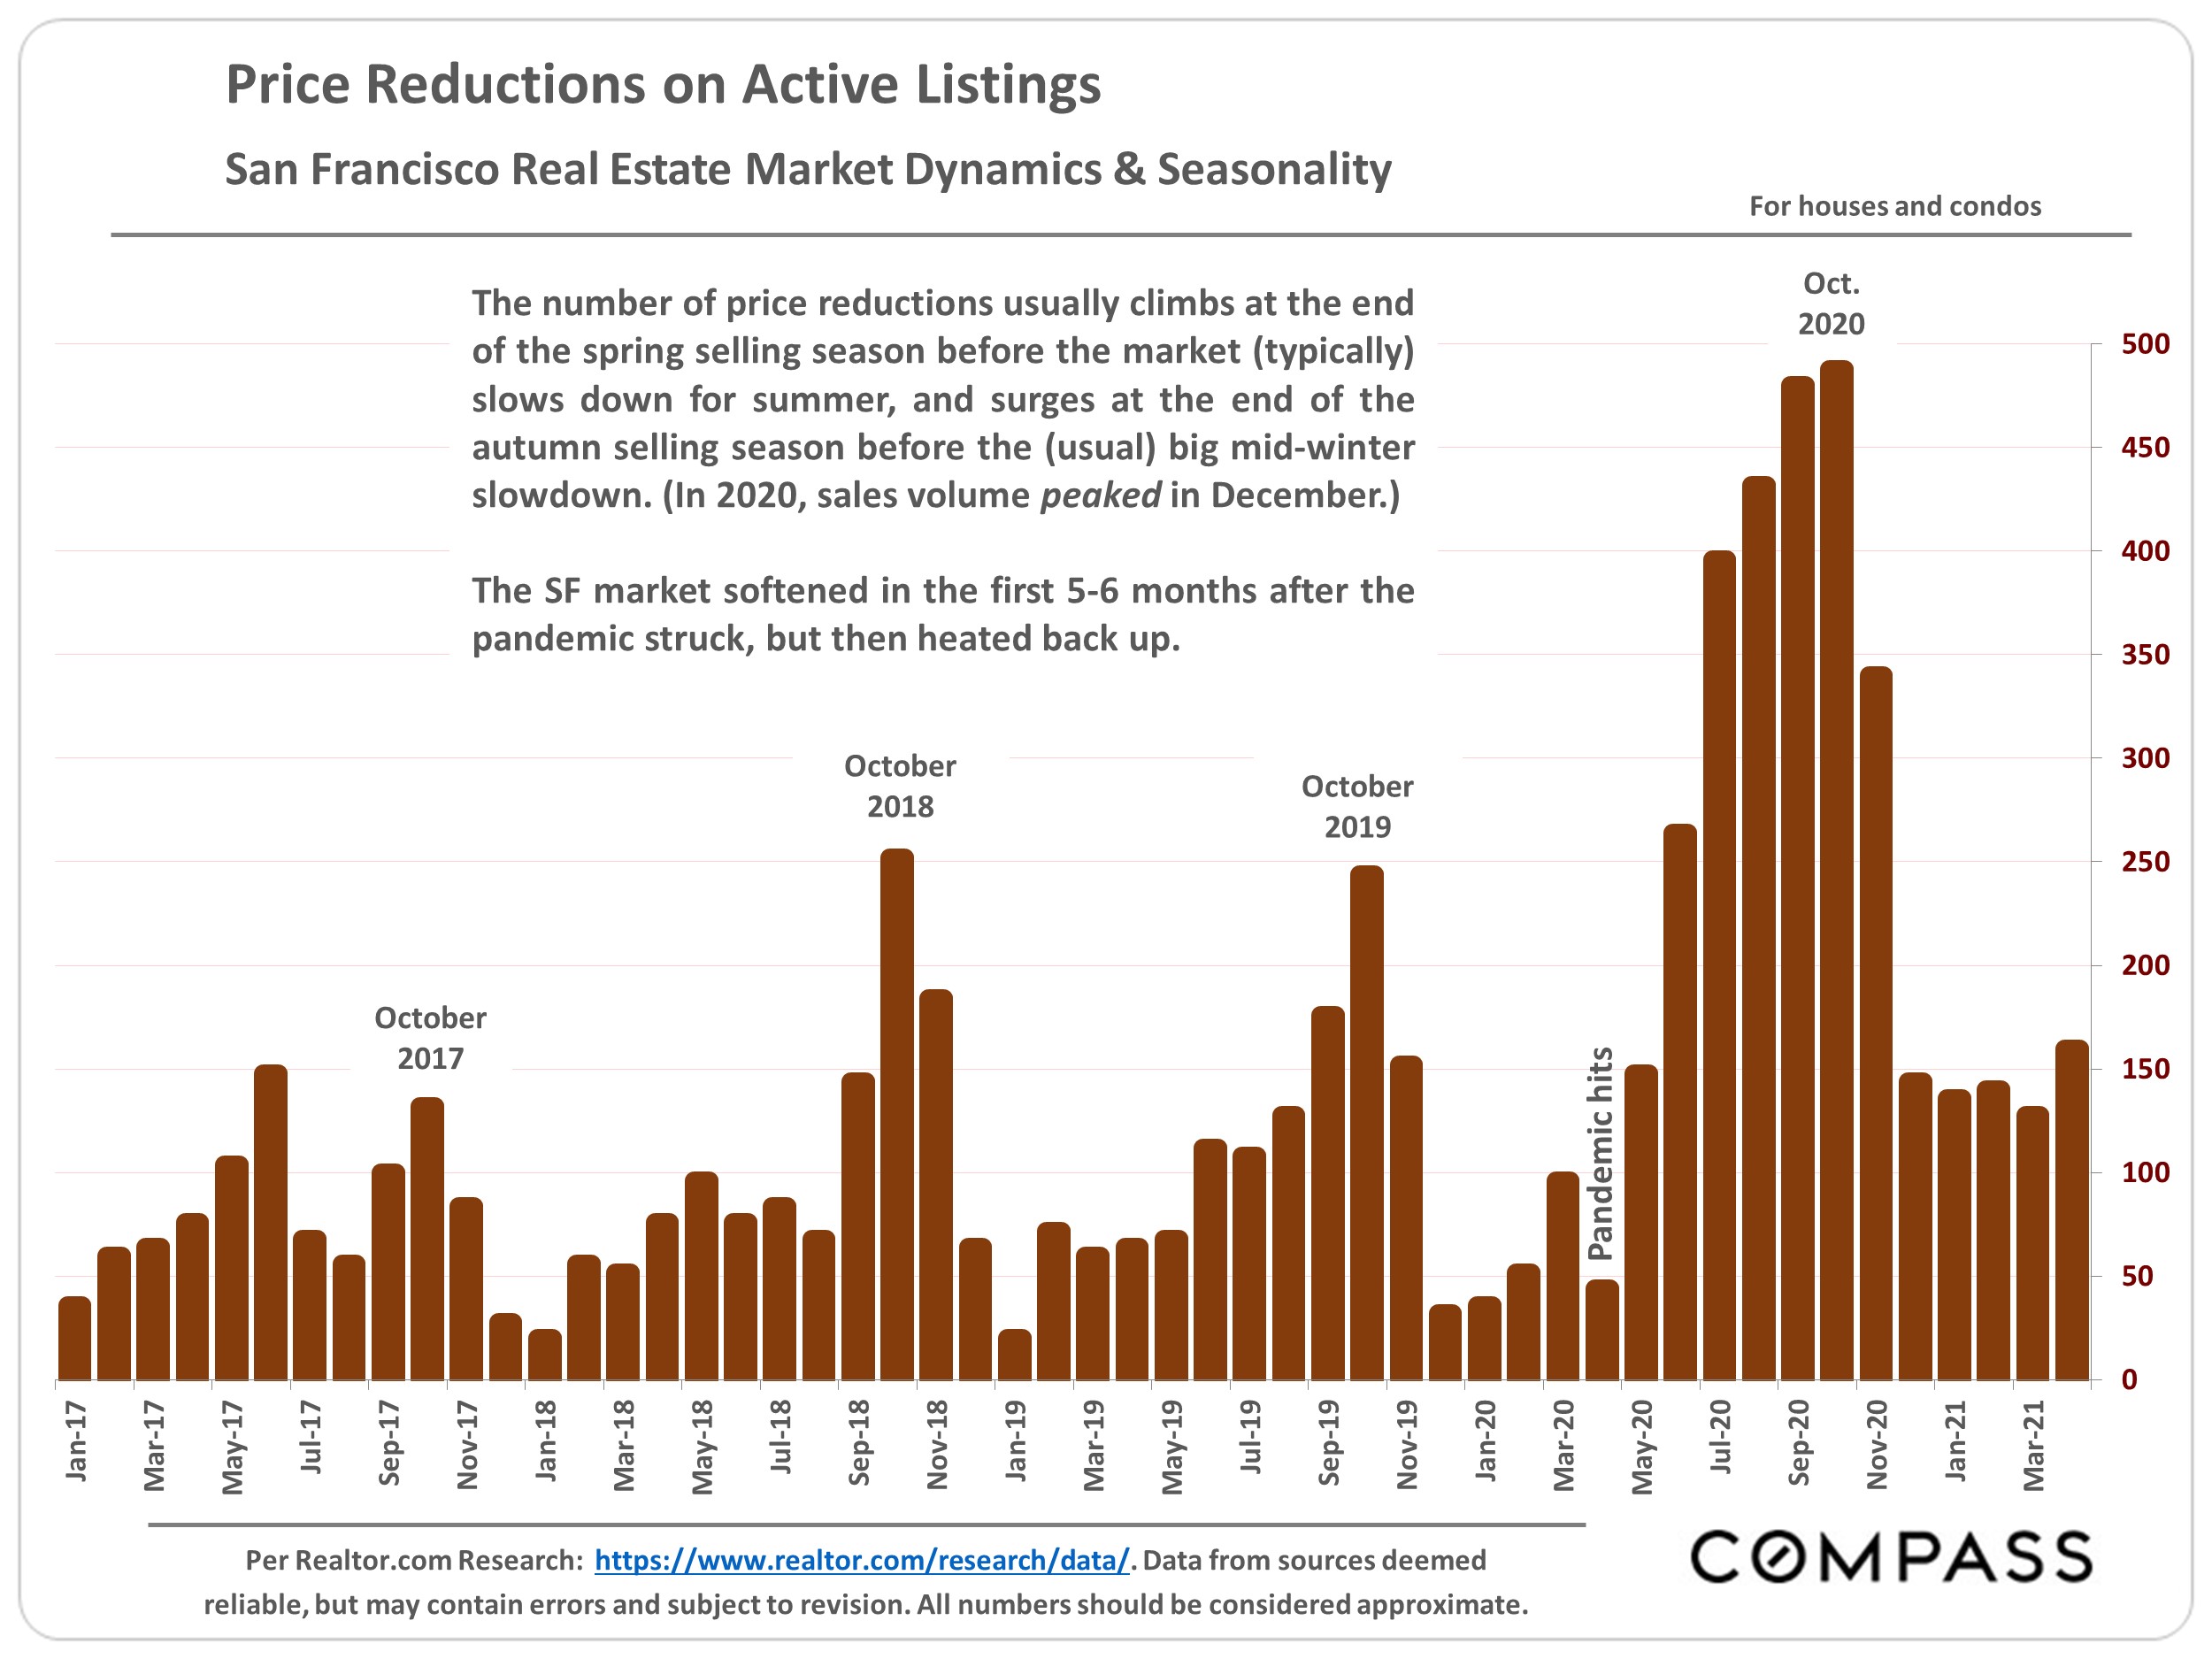
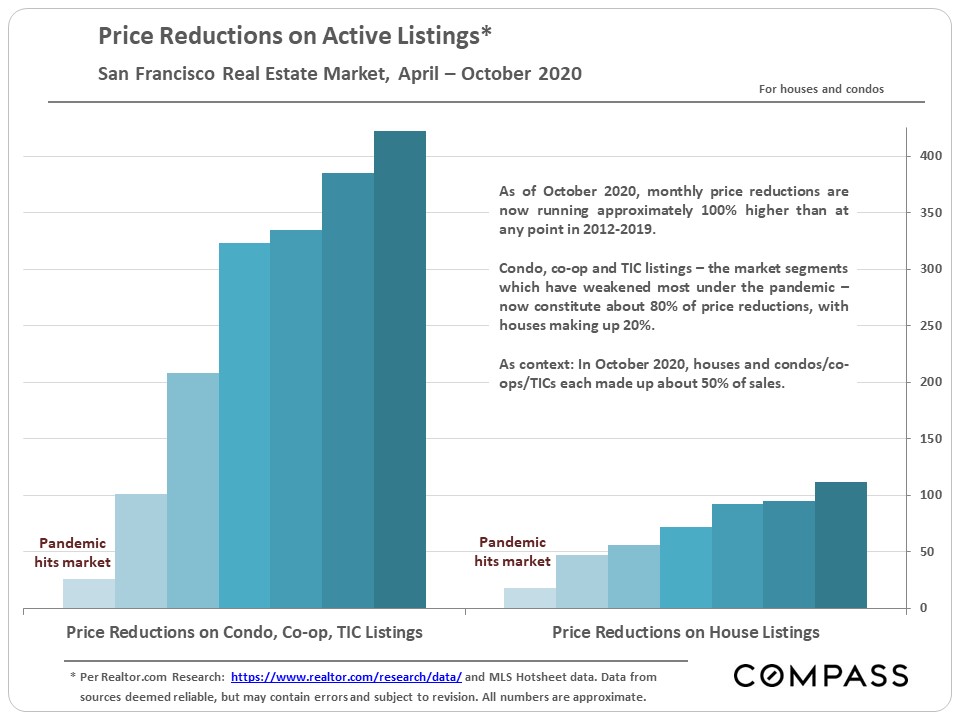
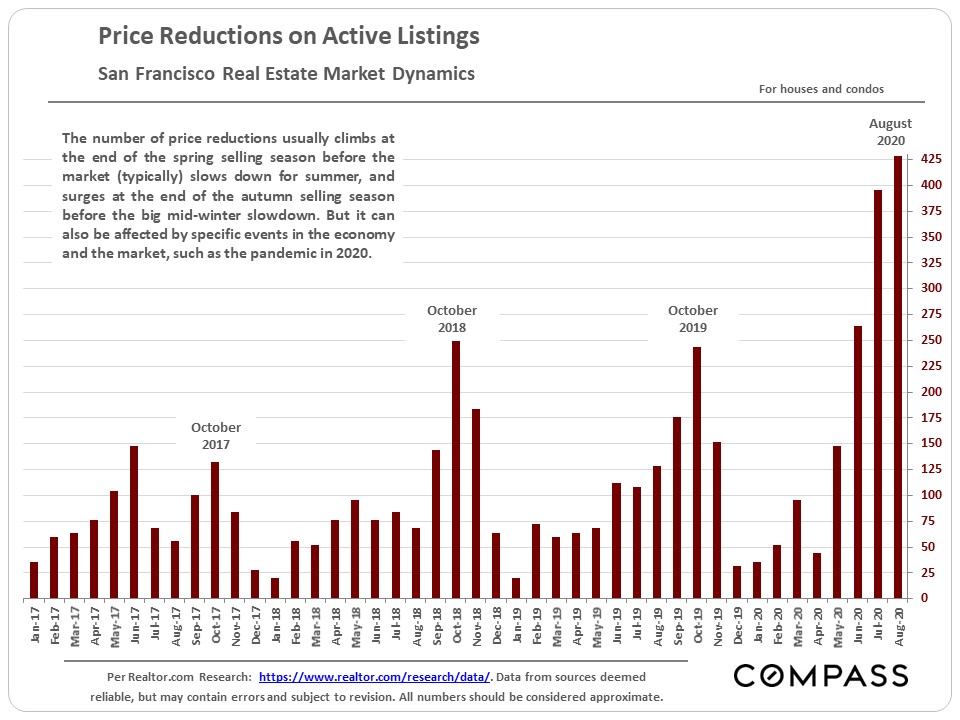
Steady demand but soaring inventory has led to an increase in price reductions. When demand outweighs supply, buyers compete for listings, usually by overbidding. When supply outweighs demand, sellers often compete for buyers through price reductions. The condo market is probably seeing its highest number of reductions in history.
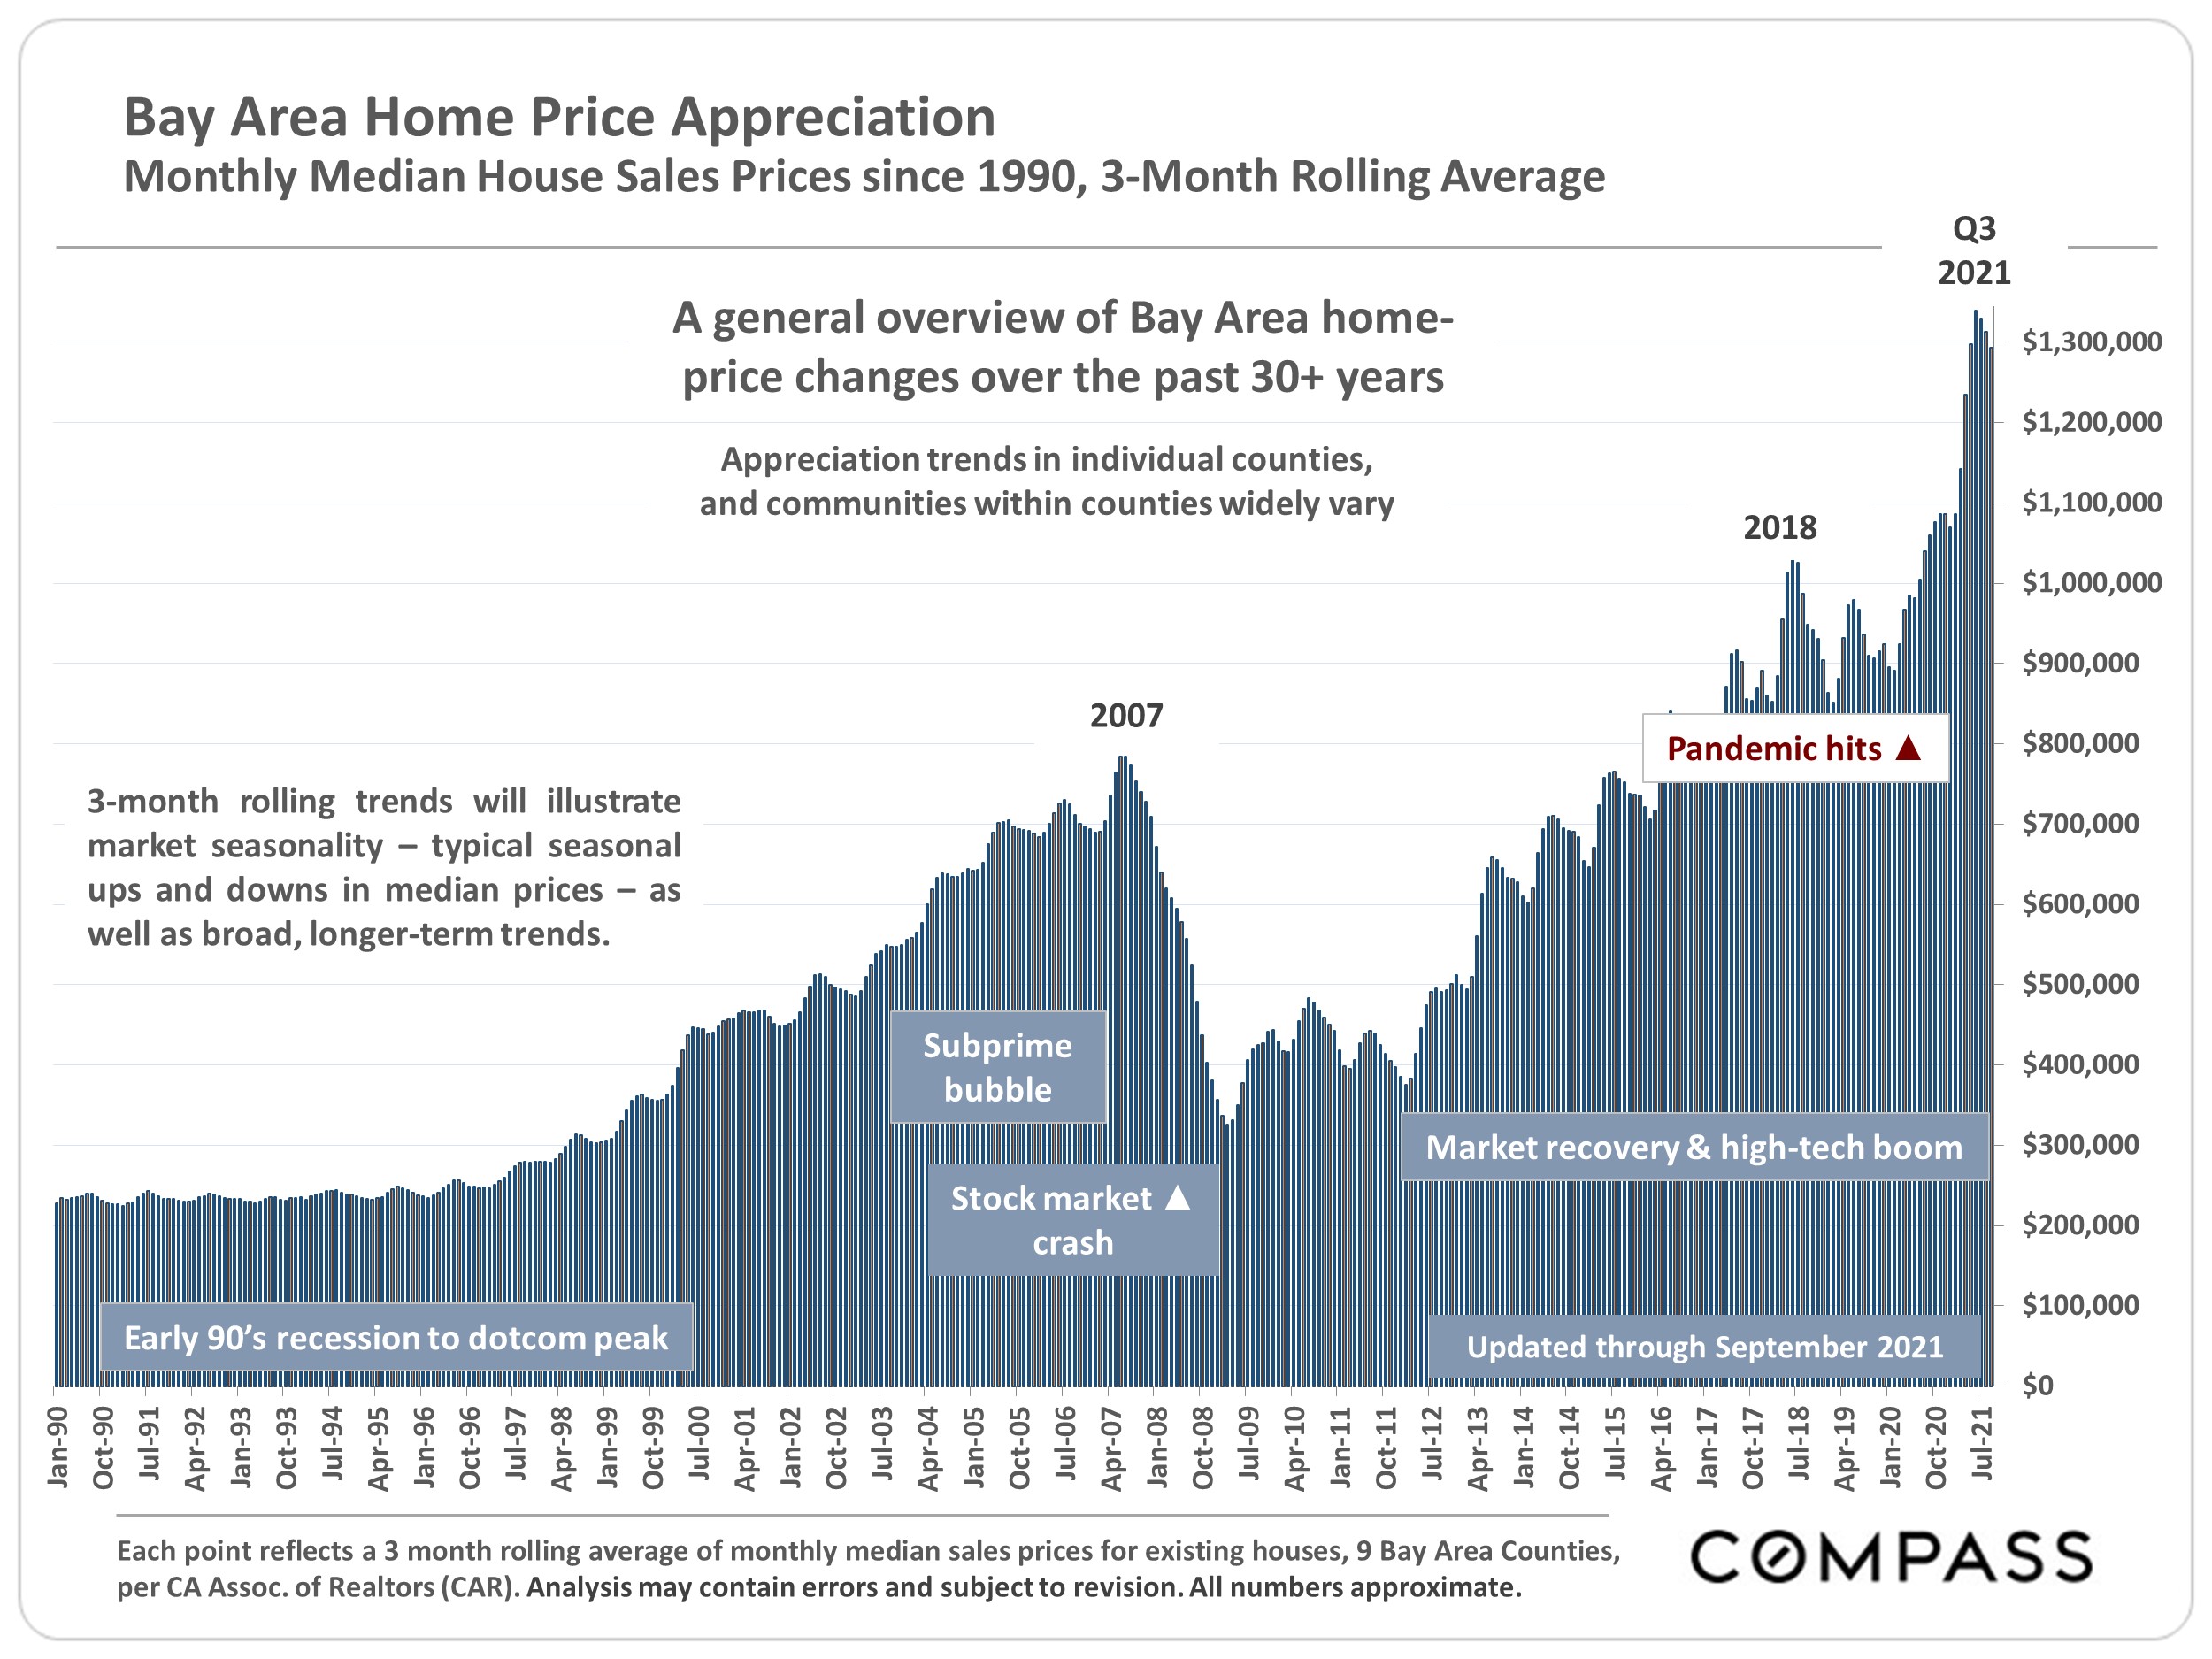
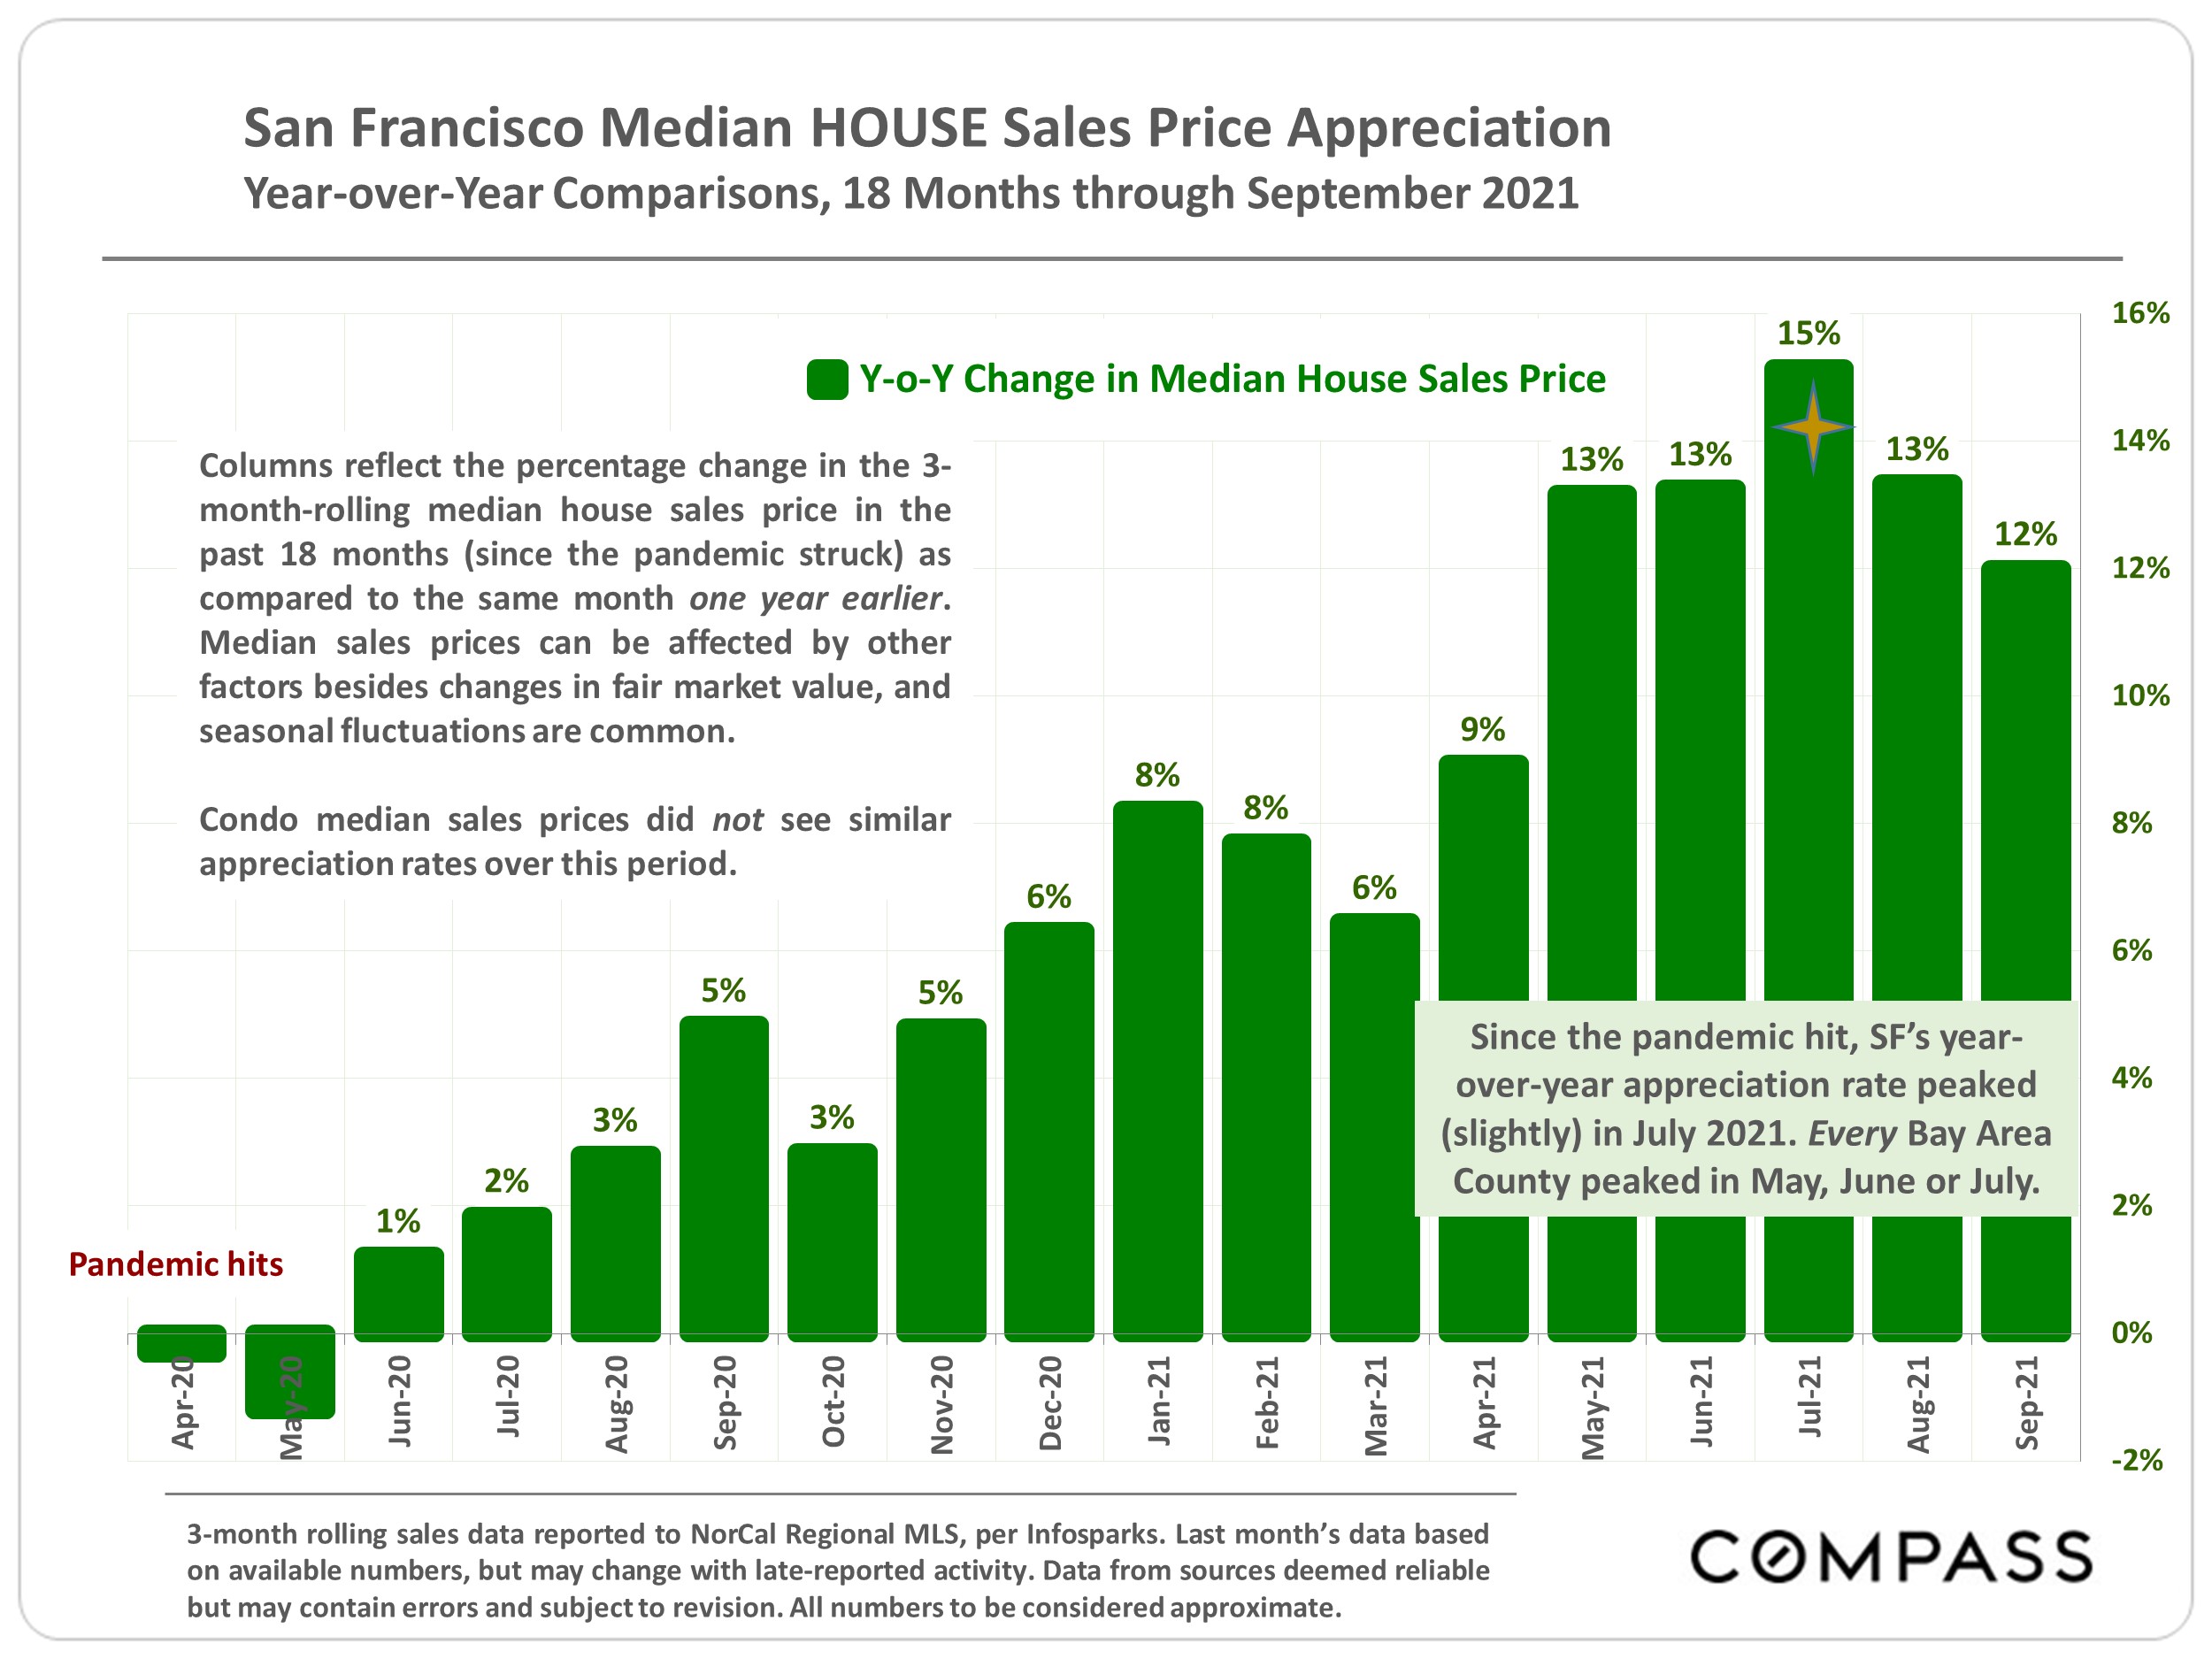
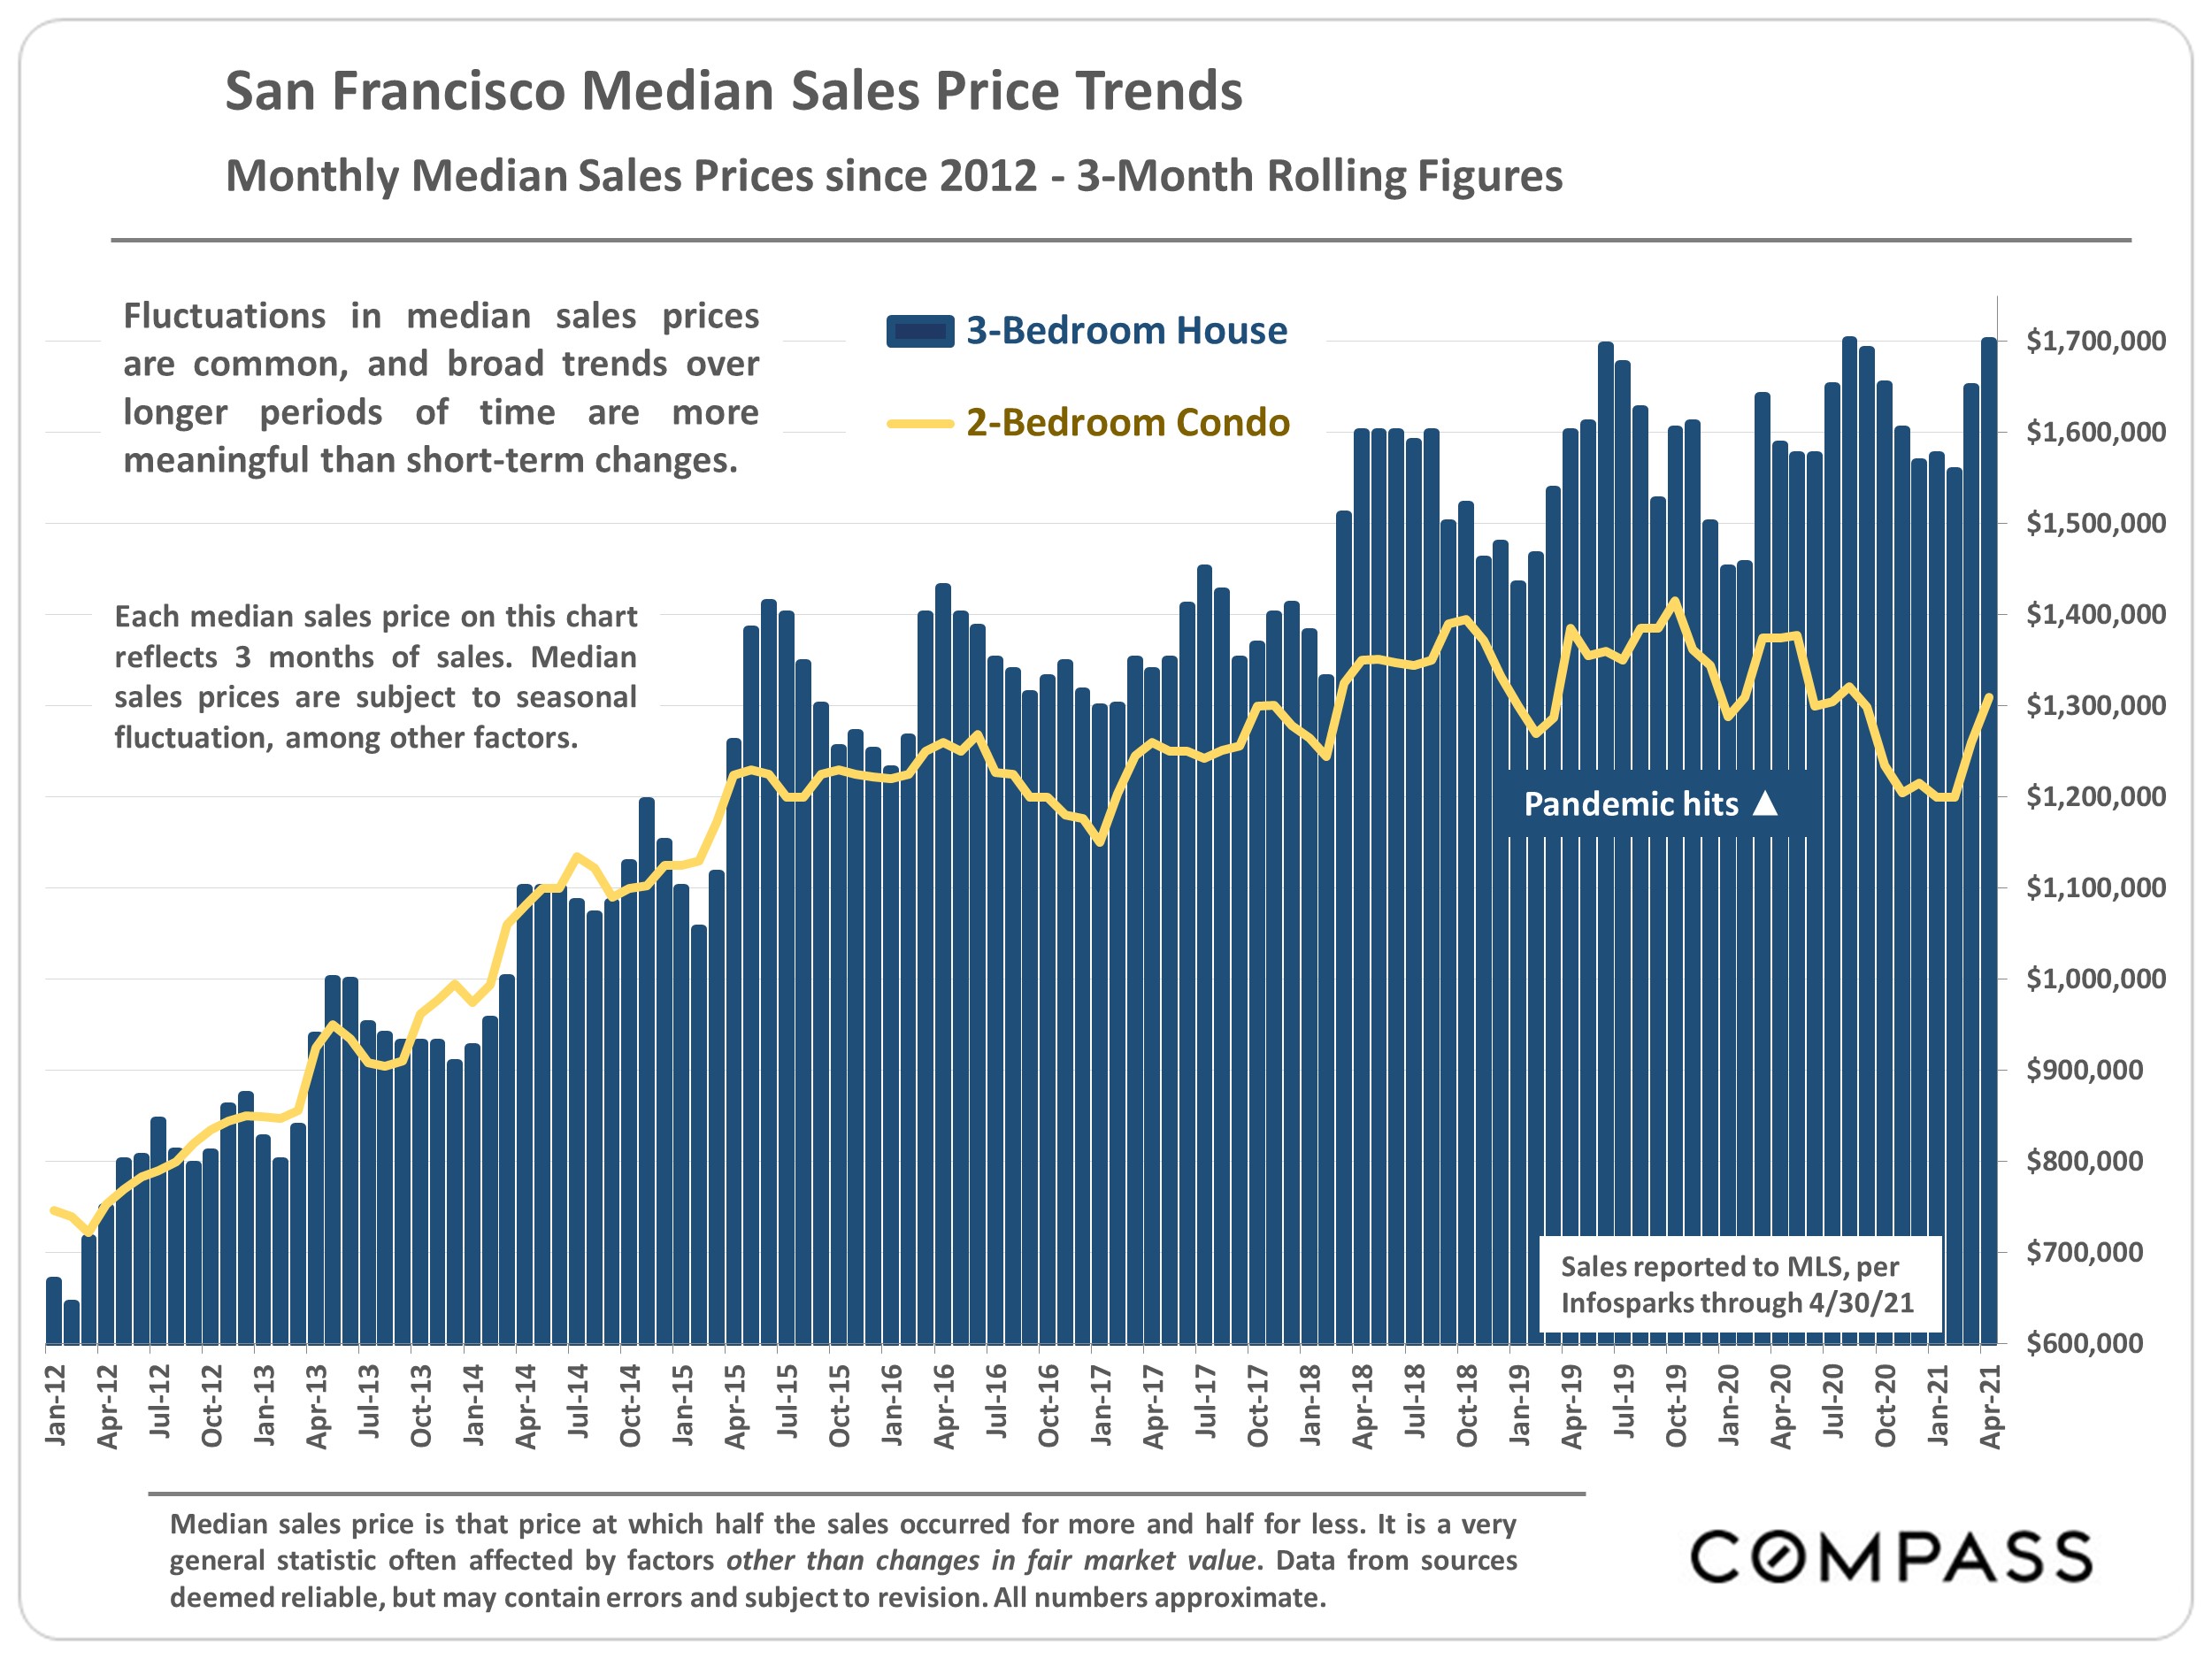
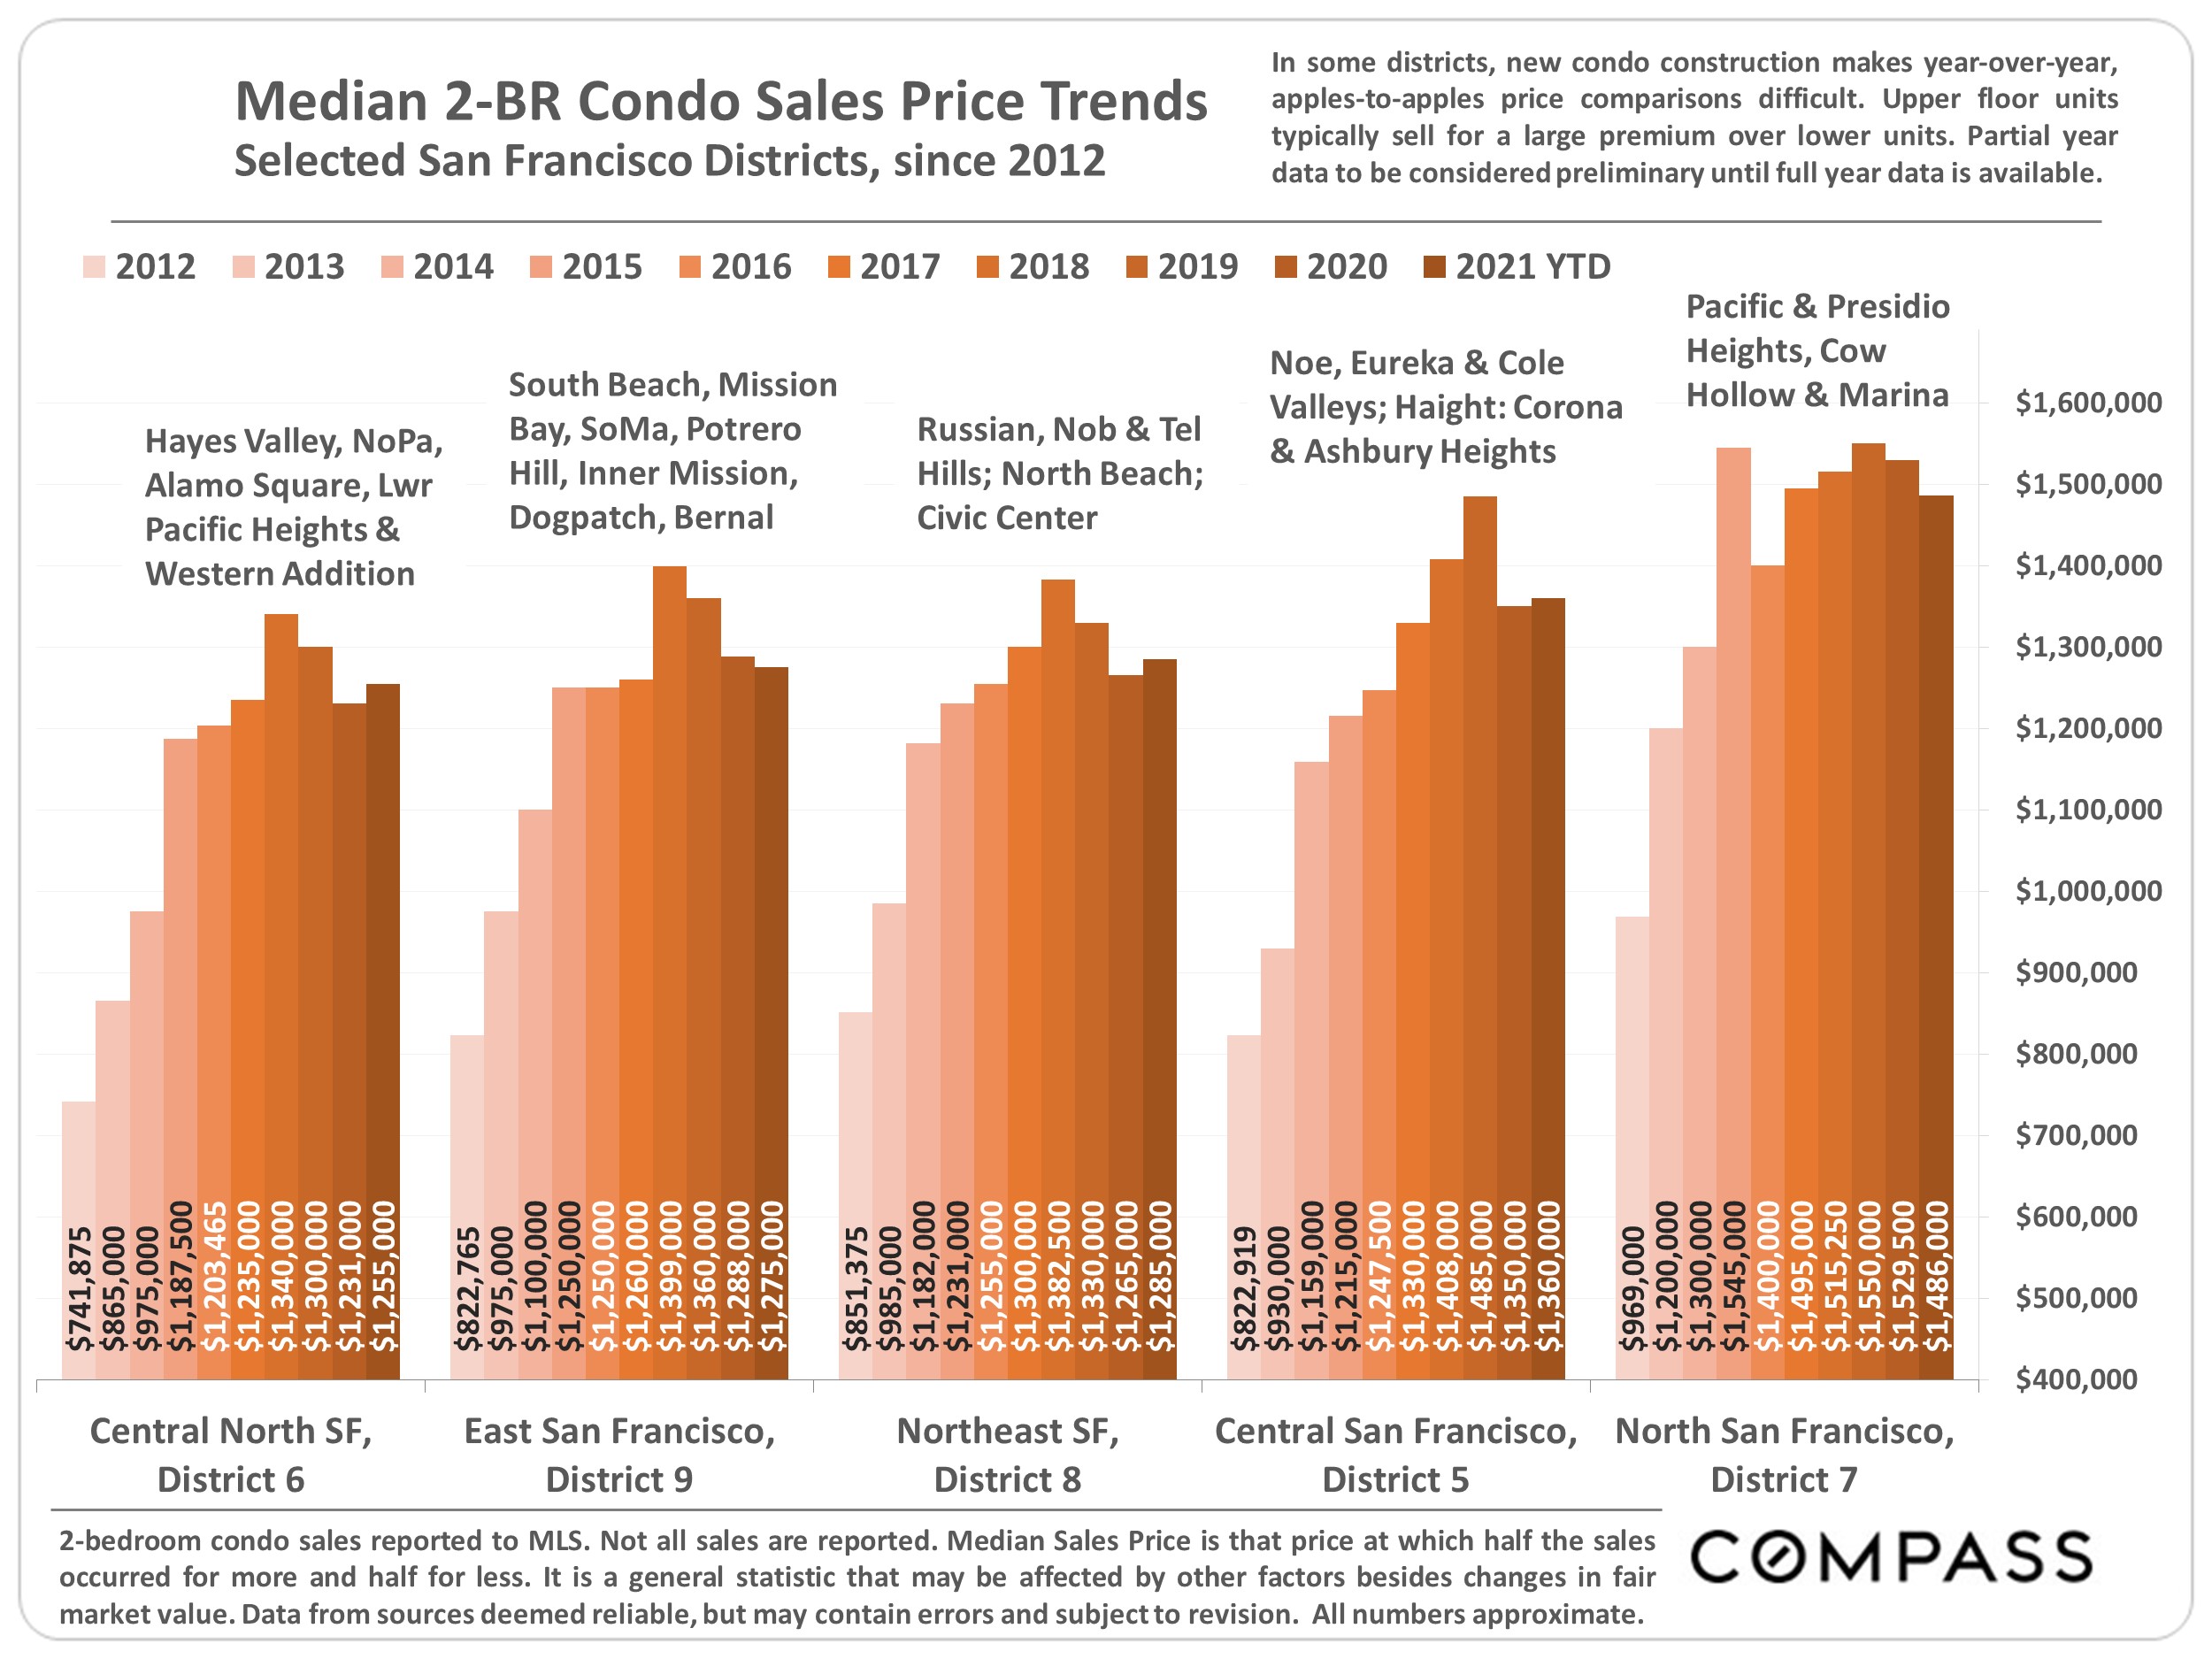
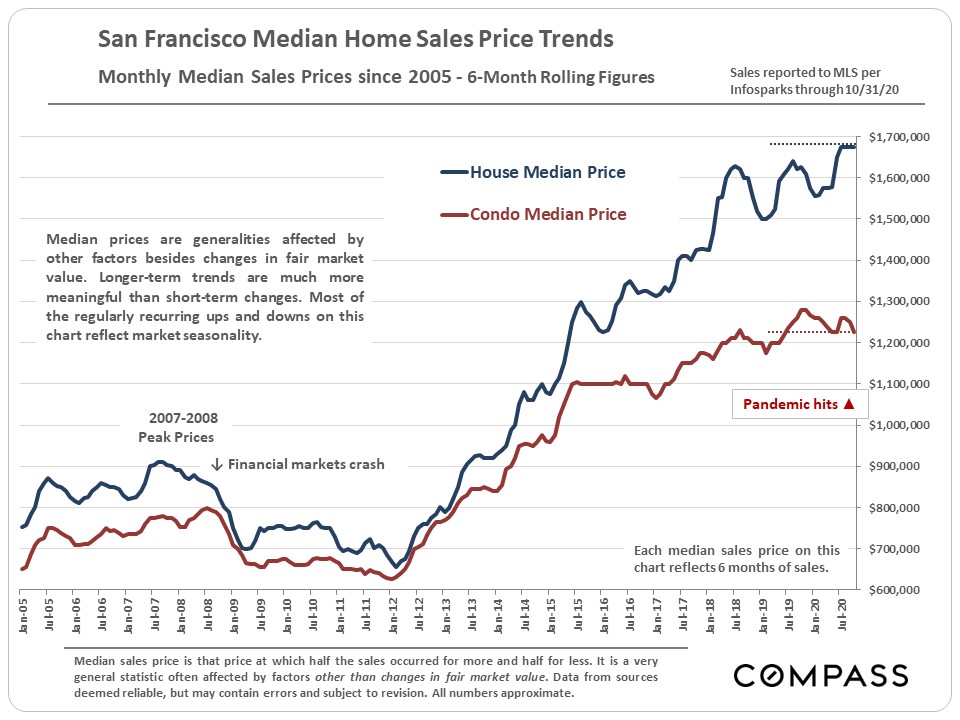
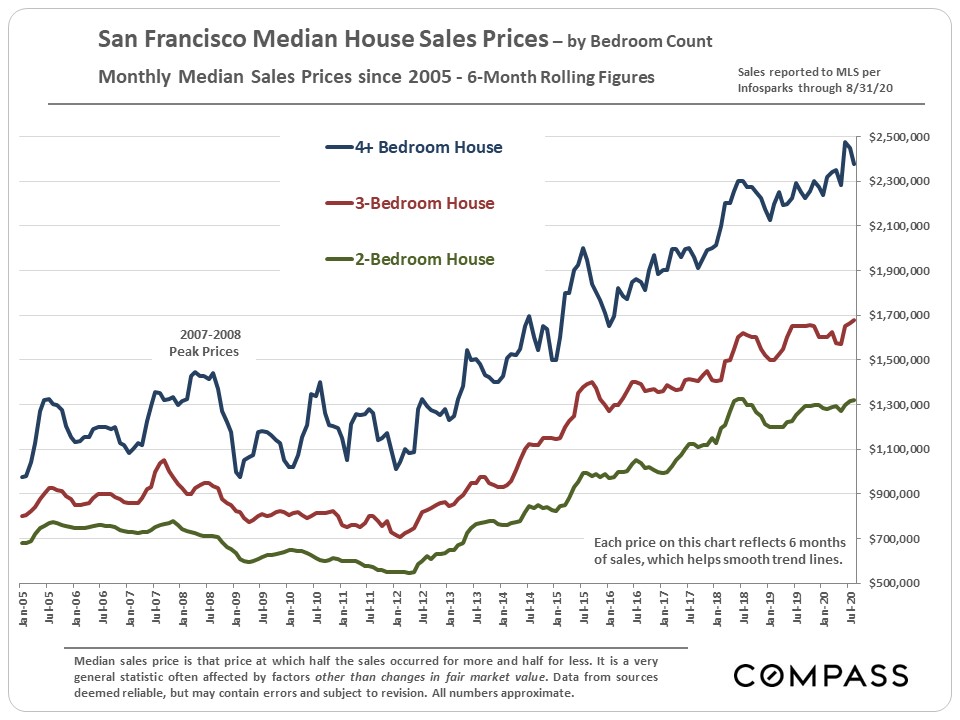
Long-term median sales price trends, 6-month rolling:
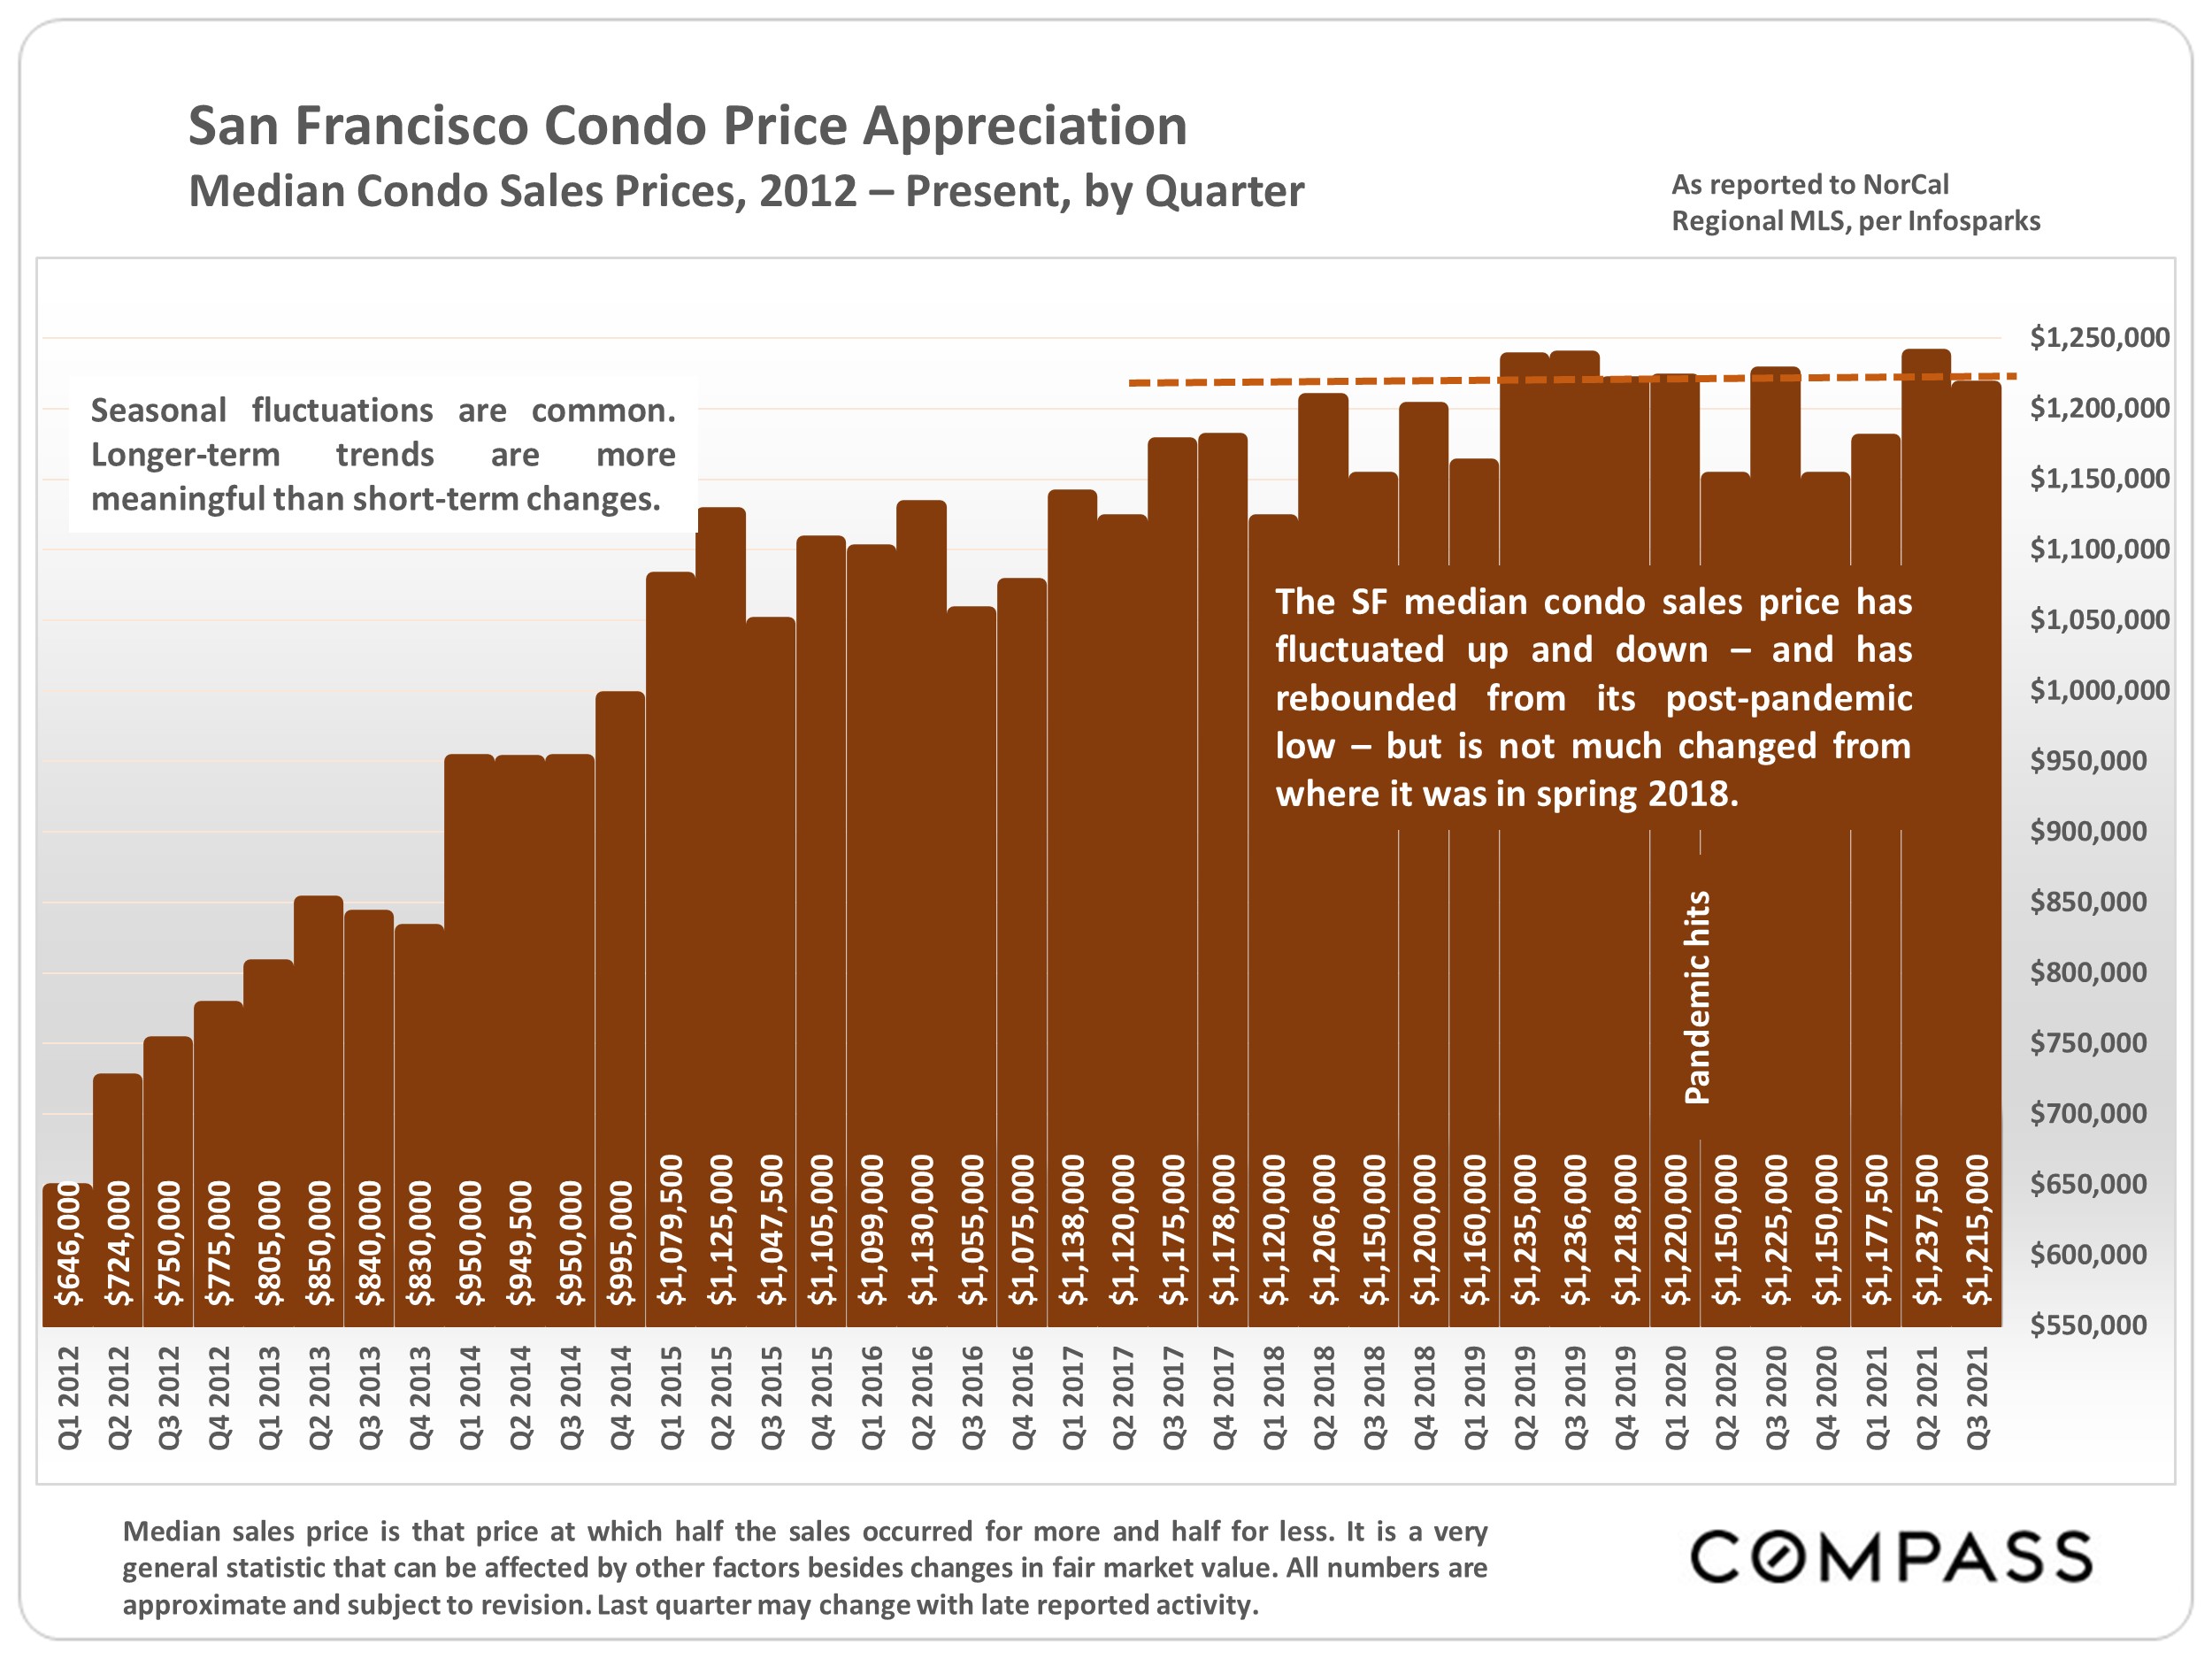
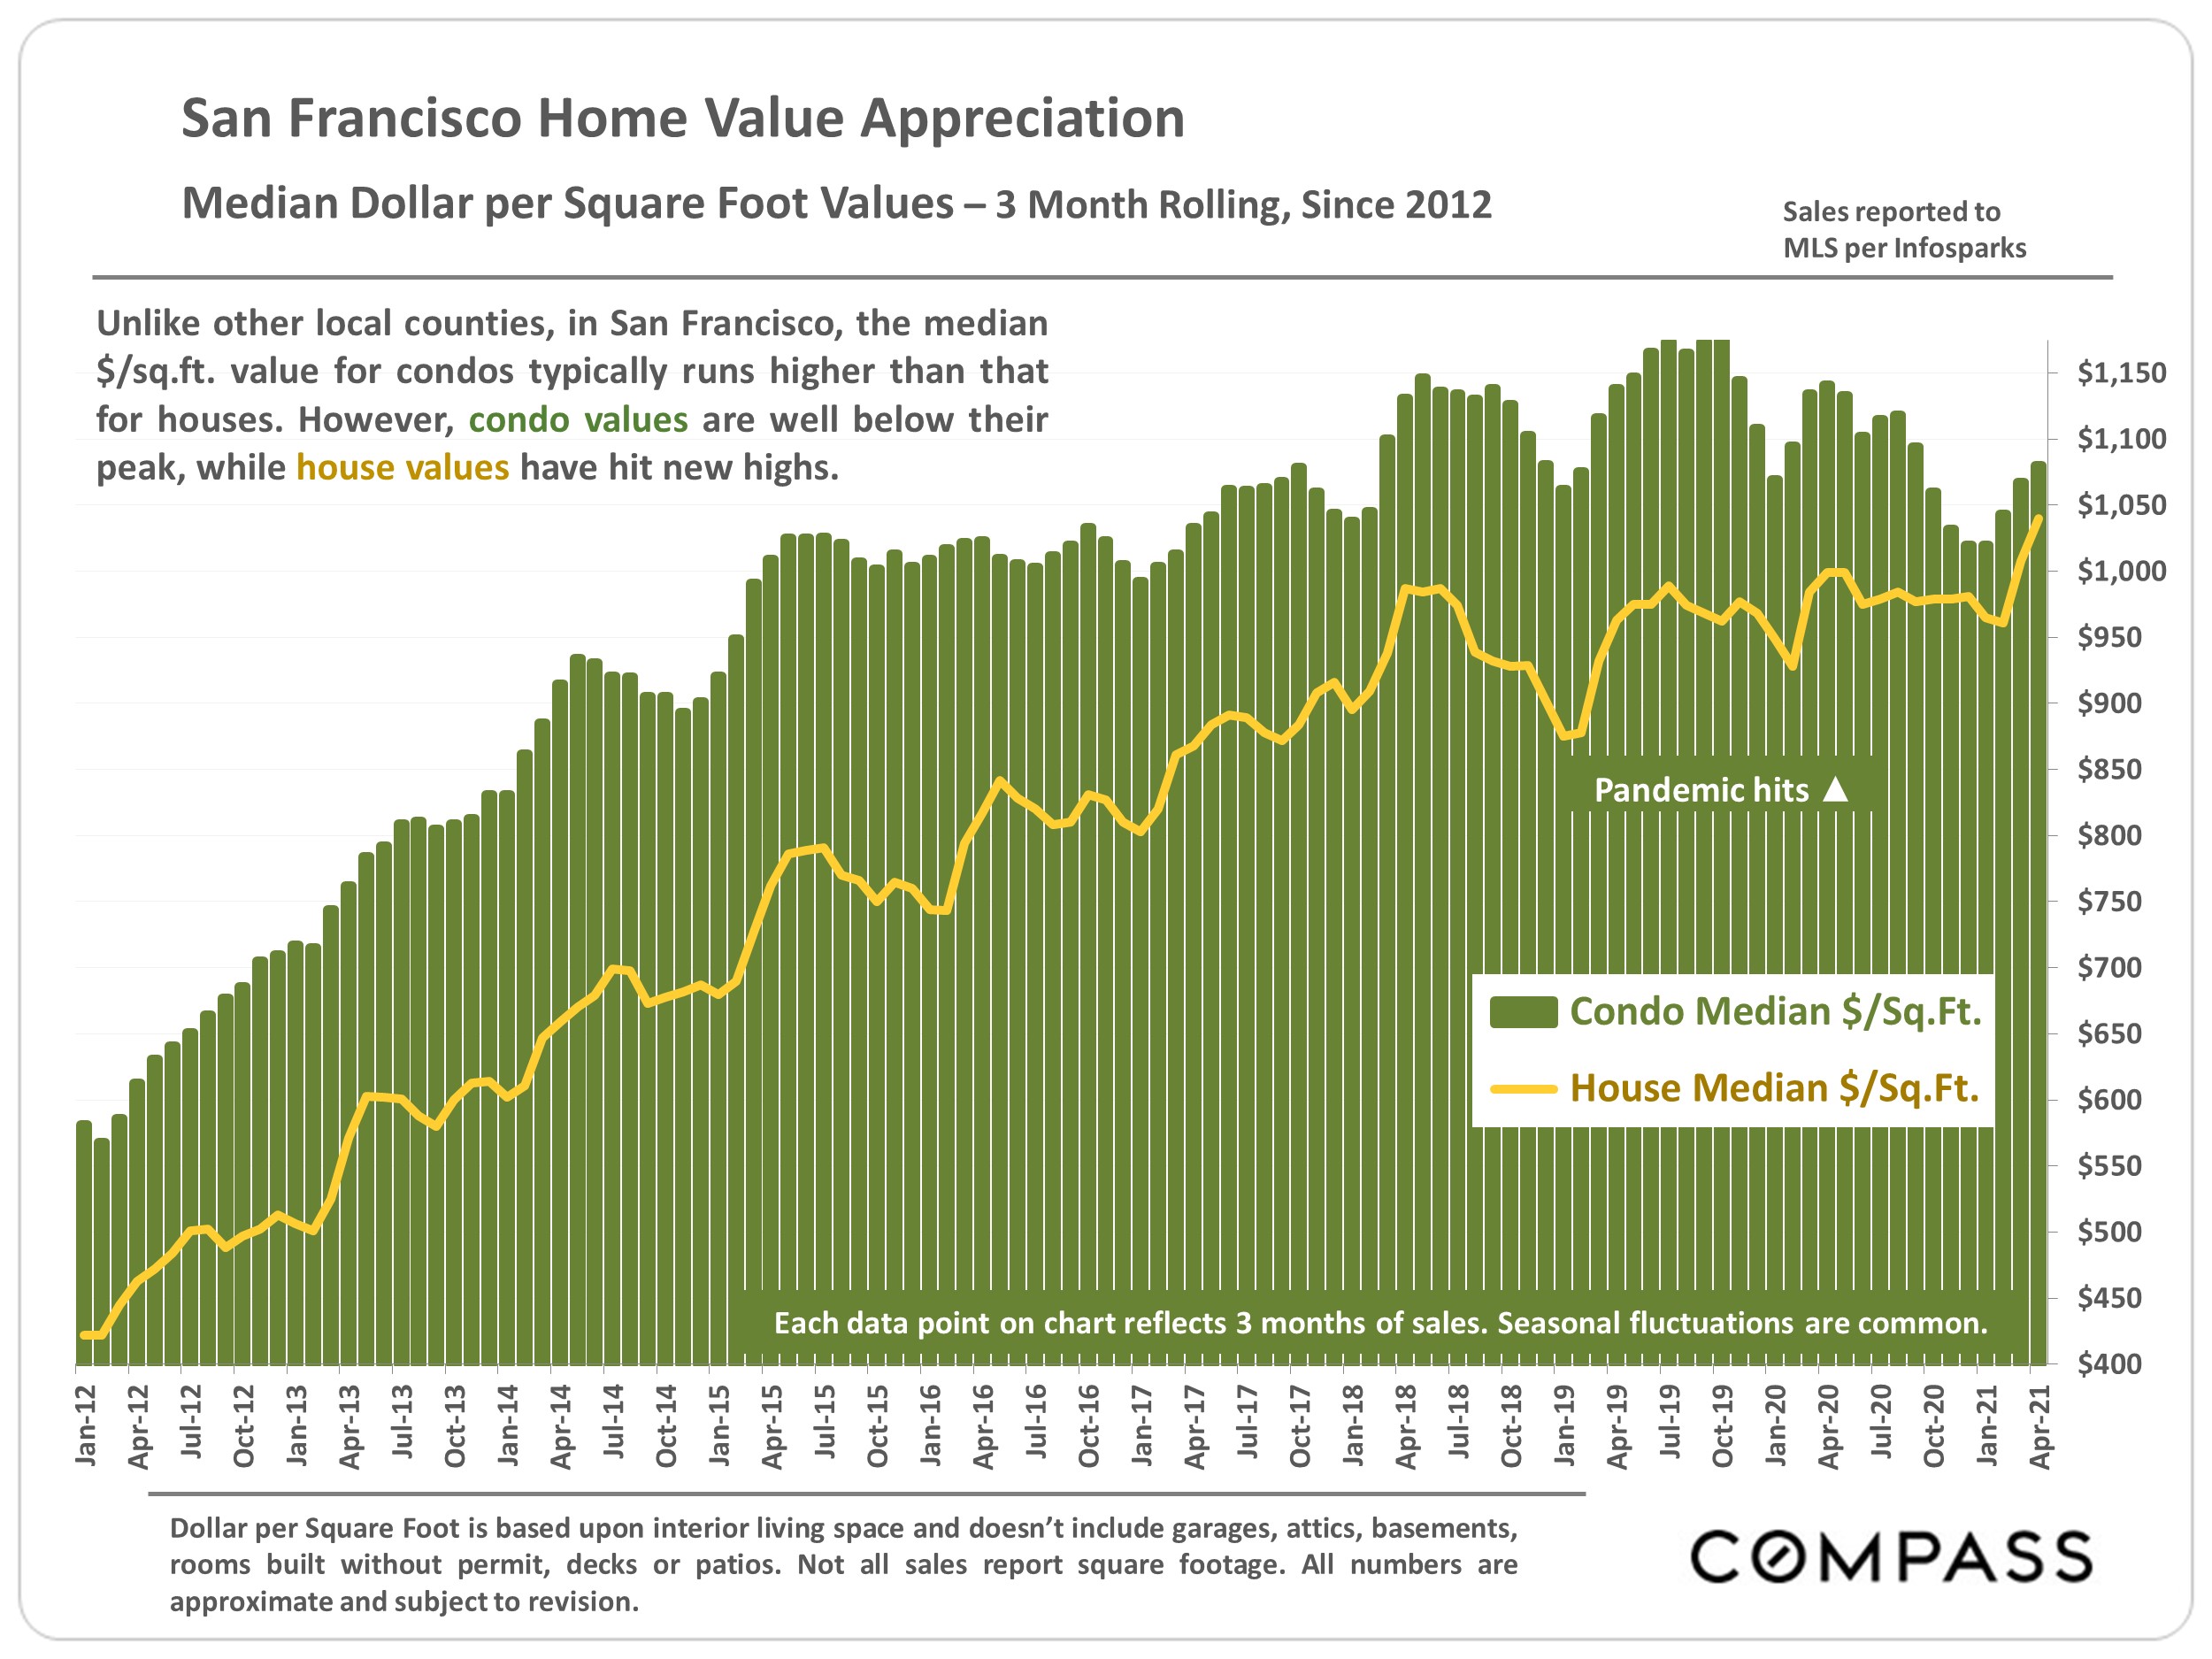
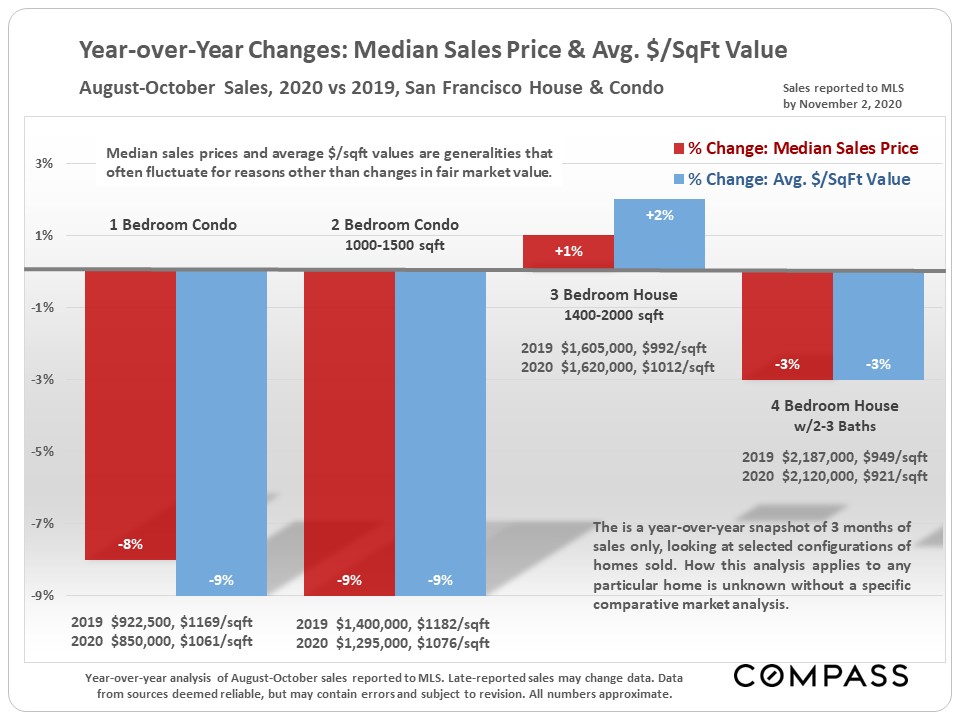
Year-over-year changes in median sales prices and average dollar per square foot values in selected home configurations. The condo market has been hit by significant declines in these 2 measurements.
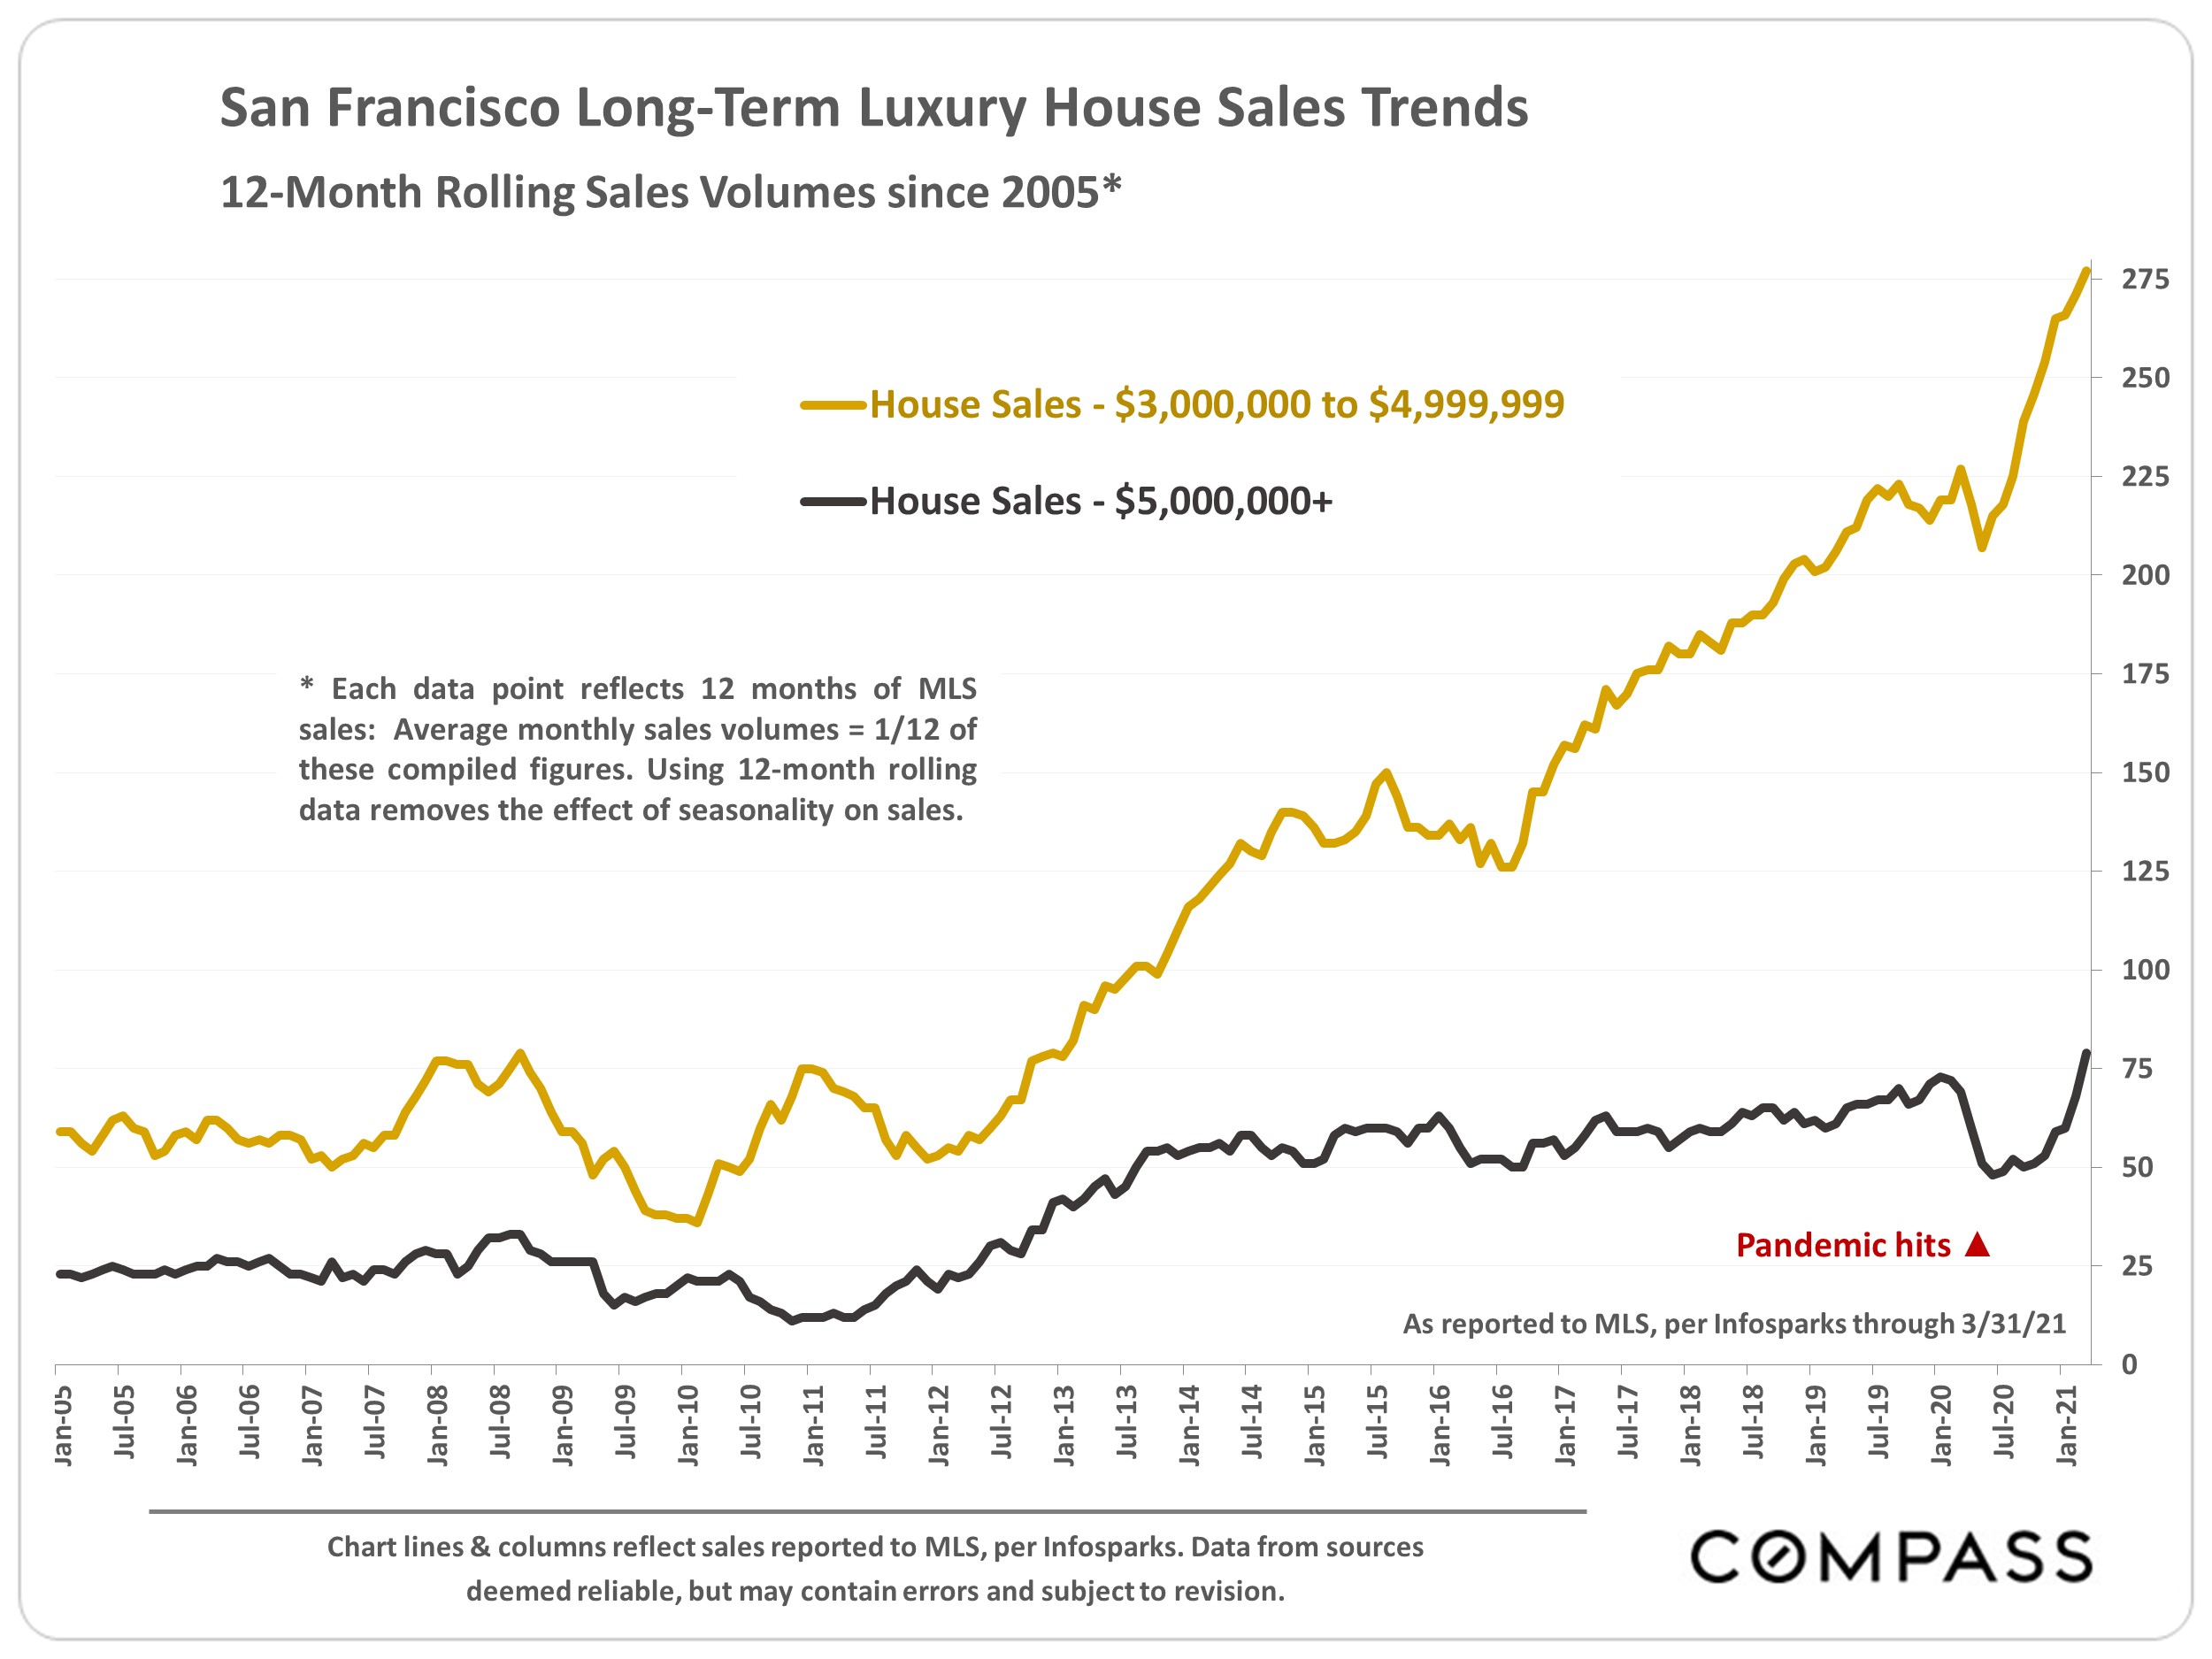
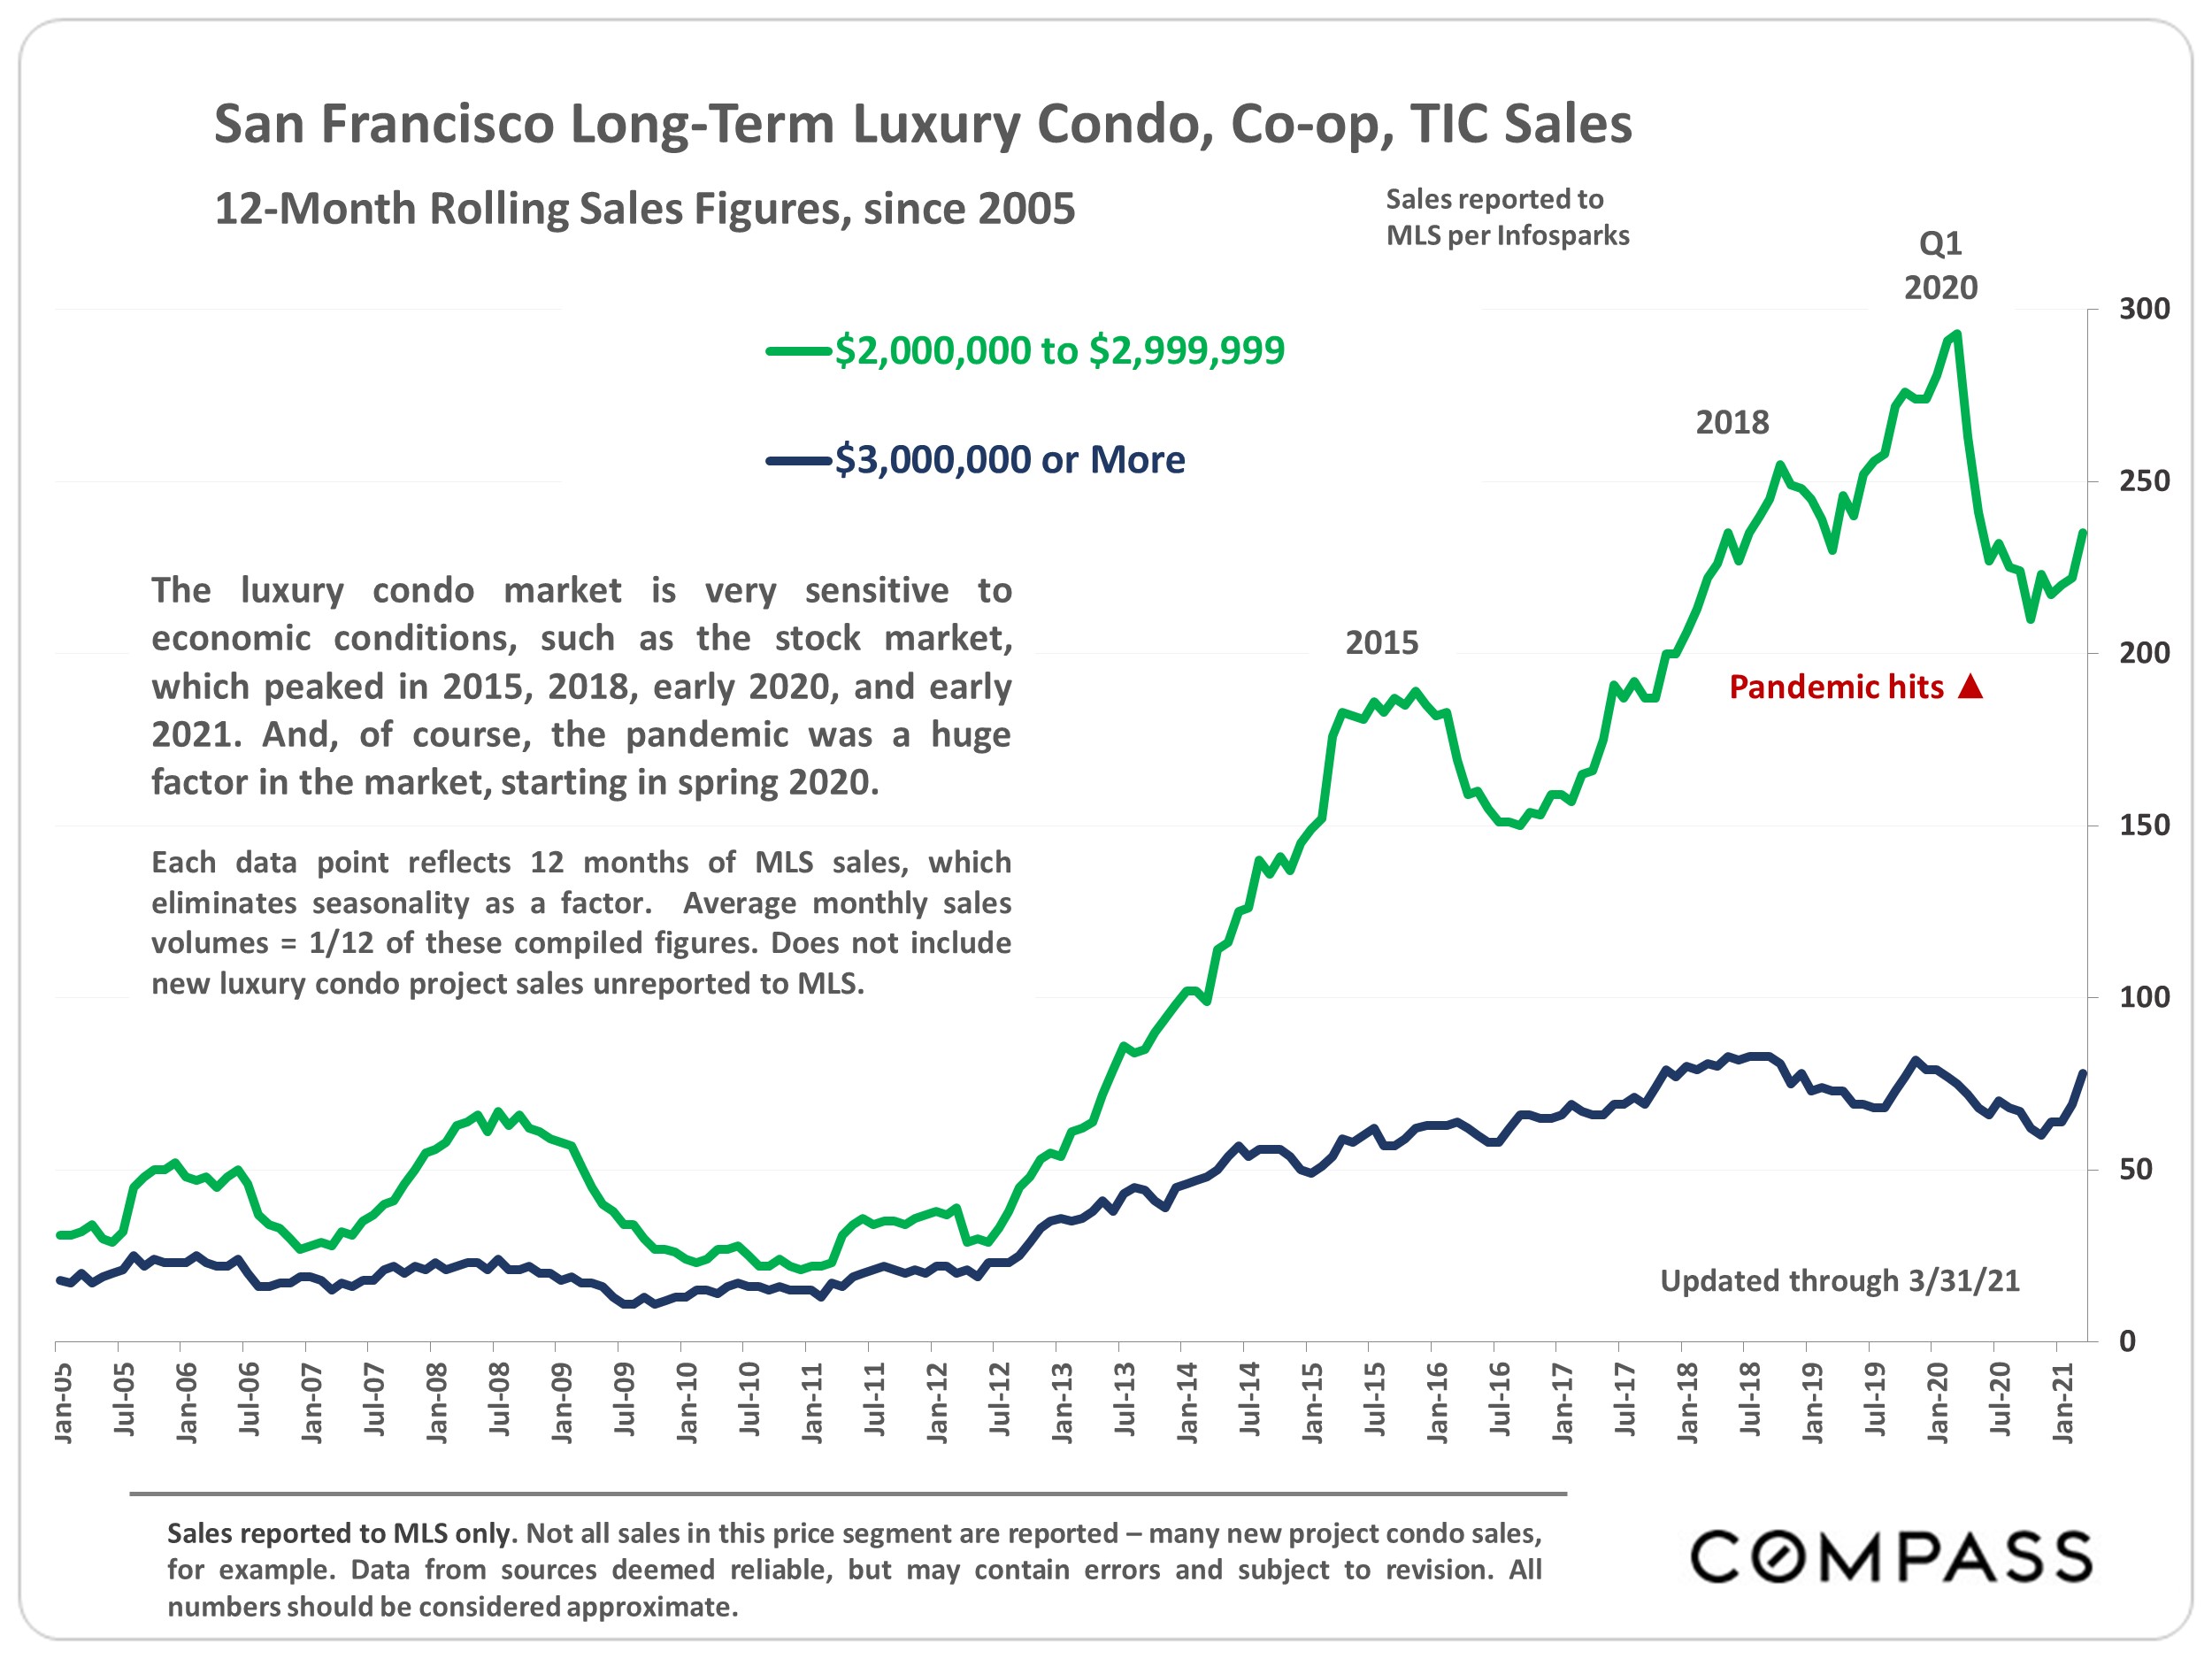
Luxury Home Sales by Property Type & Price Segment
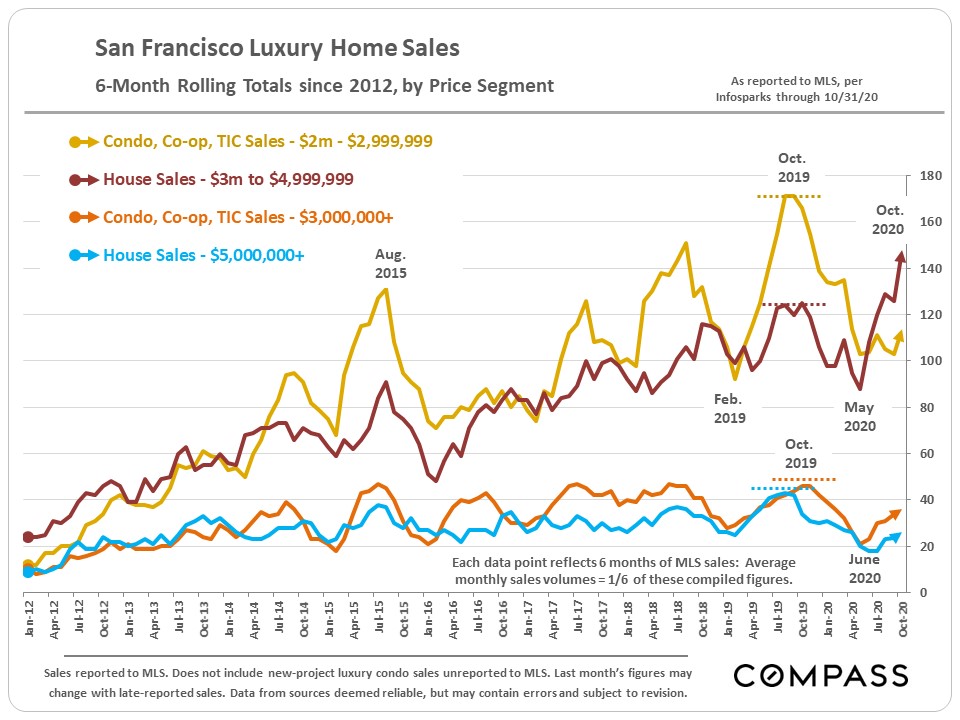
Of the luxury home segments broken out in the chart below, the market for houses selling for $3,000,000 to $4,999,999 (red line) has rebounded very strongly over the past 6 months, hitting a new peak in sales (on a 6-month rolling basis). The other segments – luxury condos and co-ops, and $5m+ houses – have seen much smaller rebounds from shelter-in-place lows, and remain far below previous peaks.
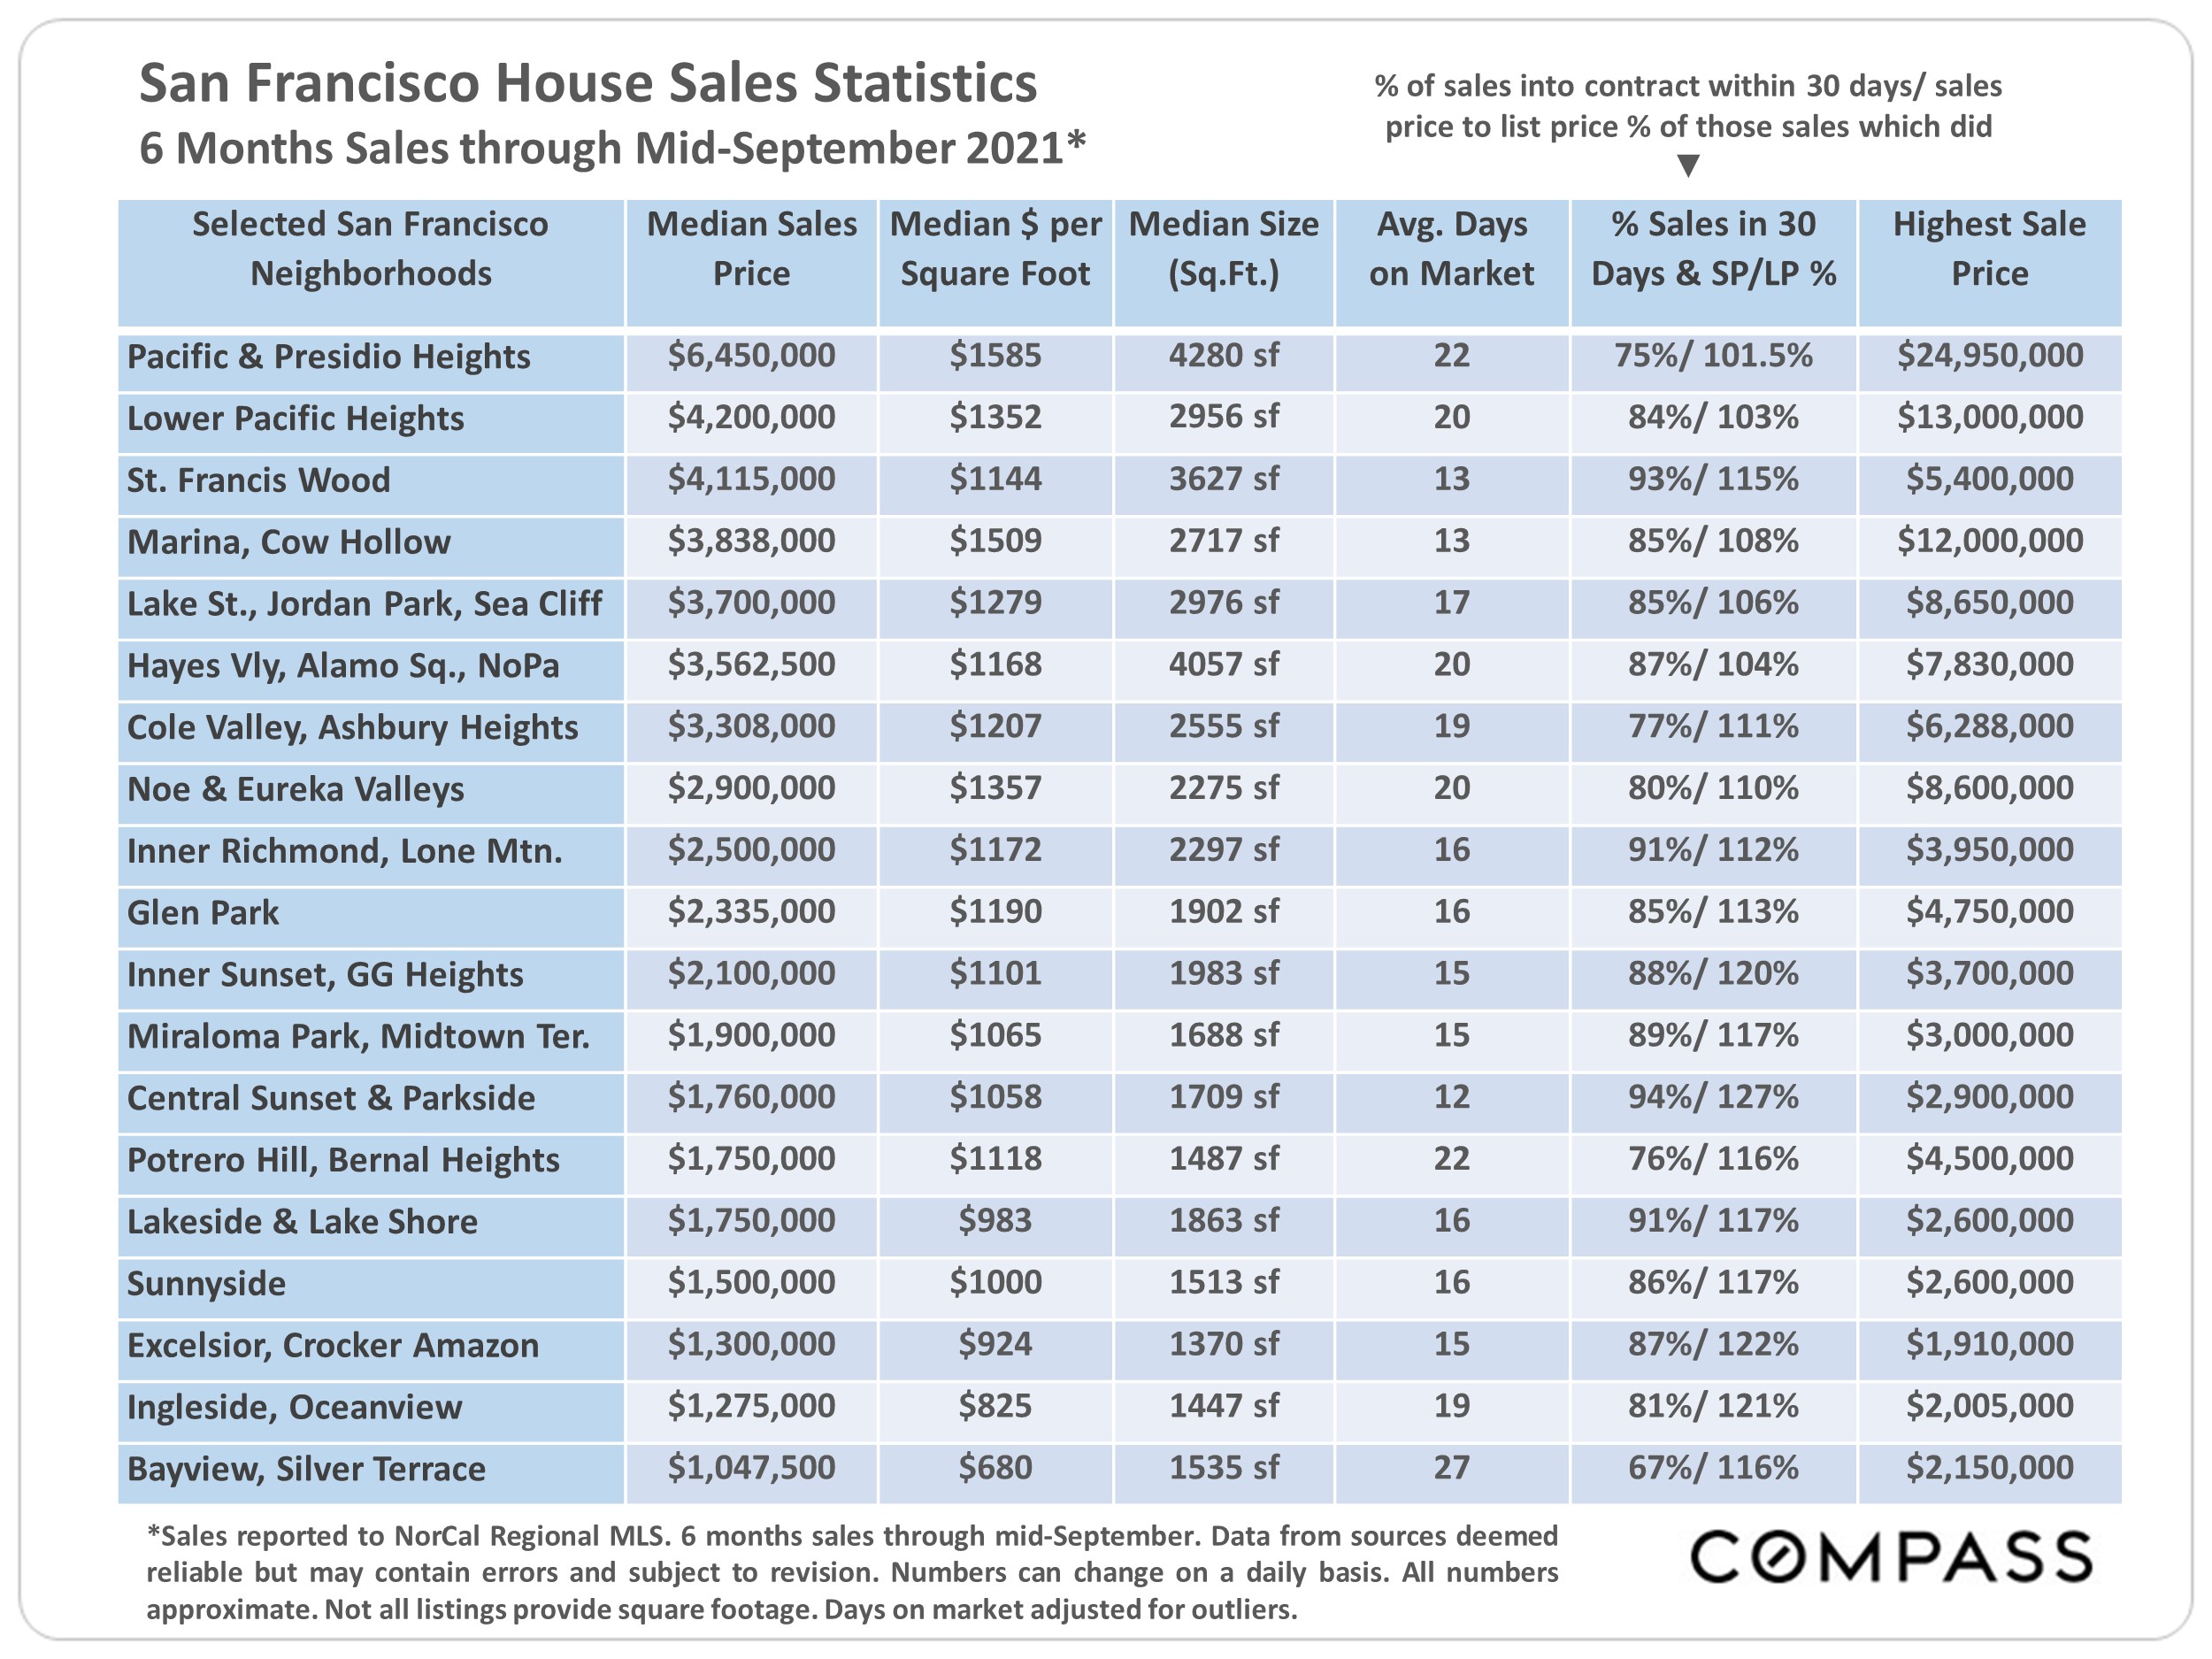
House Markets by District/Neighborhood
Within the city, there are significant differences in market dynamics by location. This report will look first at house markets, followed by a series of analyses on condo markets. How these charts apply to any particular home is unknown without a specific comparative market analysis.
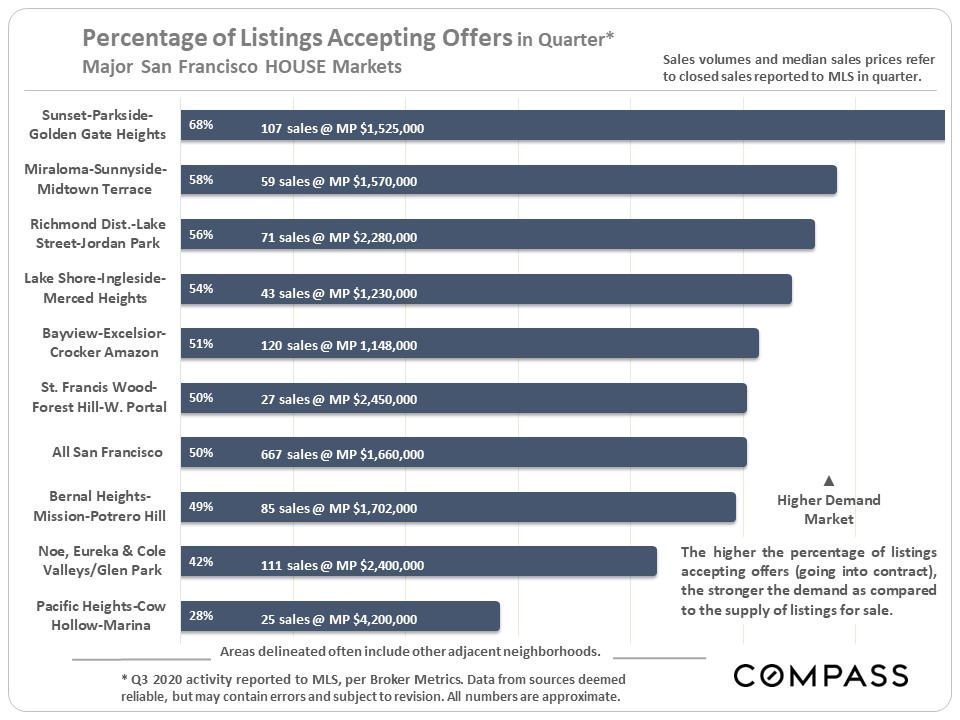
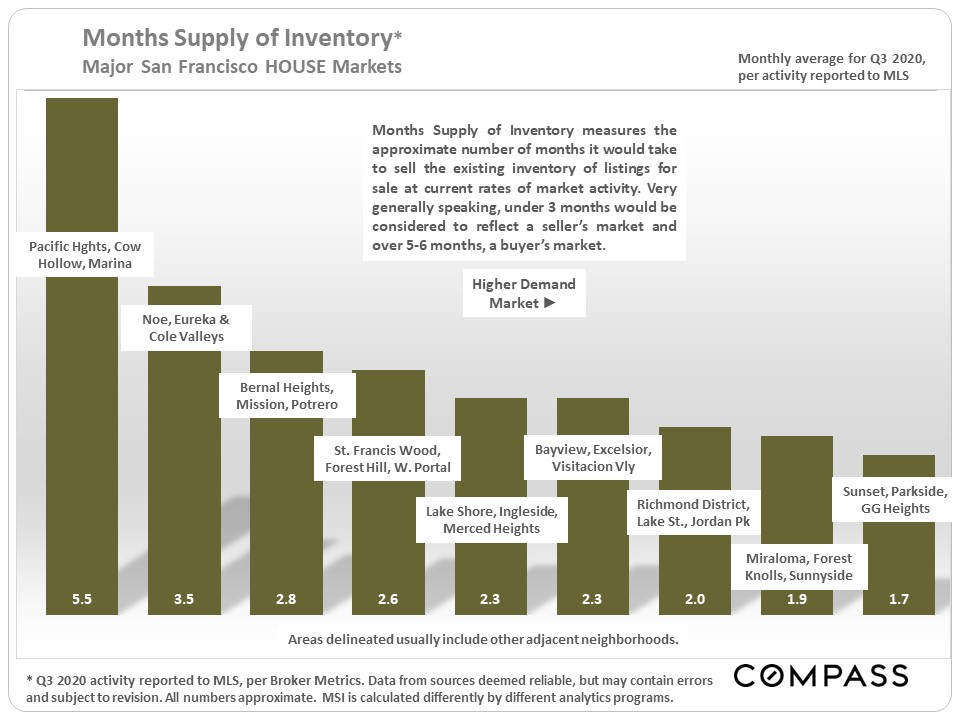
By most standard measurements, the greater Sunset/Parkside district has the strongest house market in the city with house values just below the SF median house price. At the softer end of dynamics are 2 of the city's most expensive districts, which feature the largest luxury house segments.
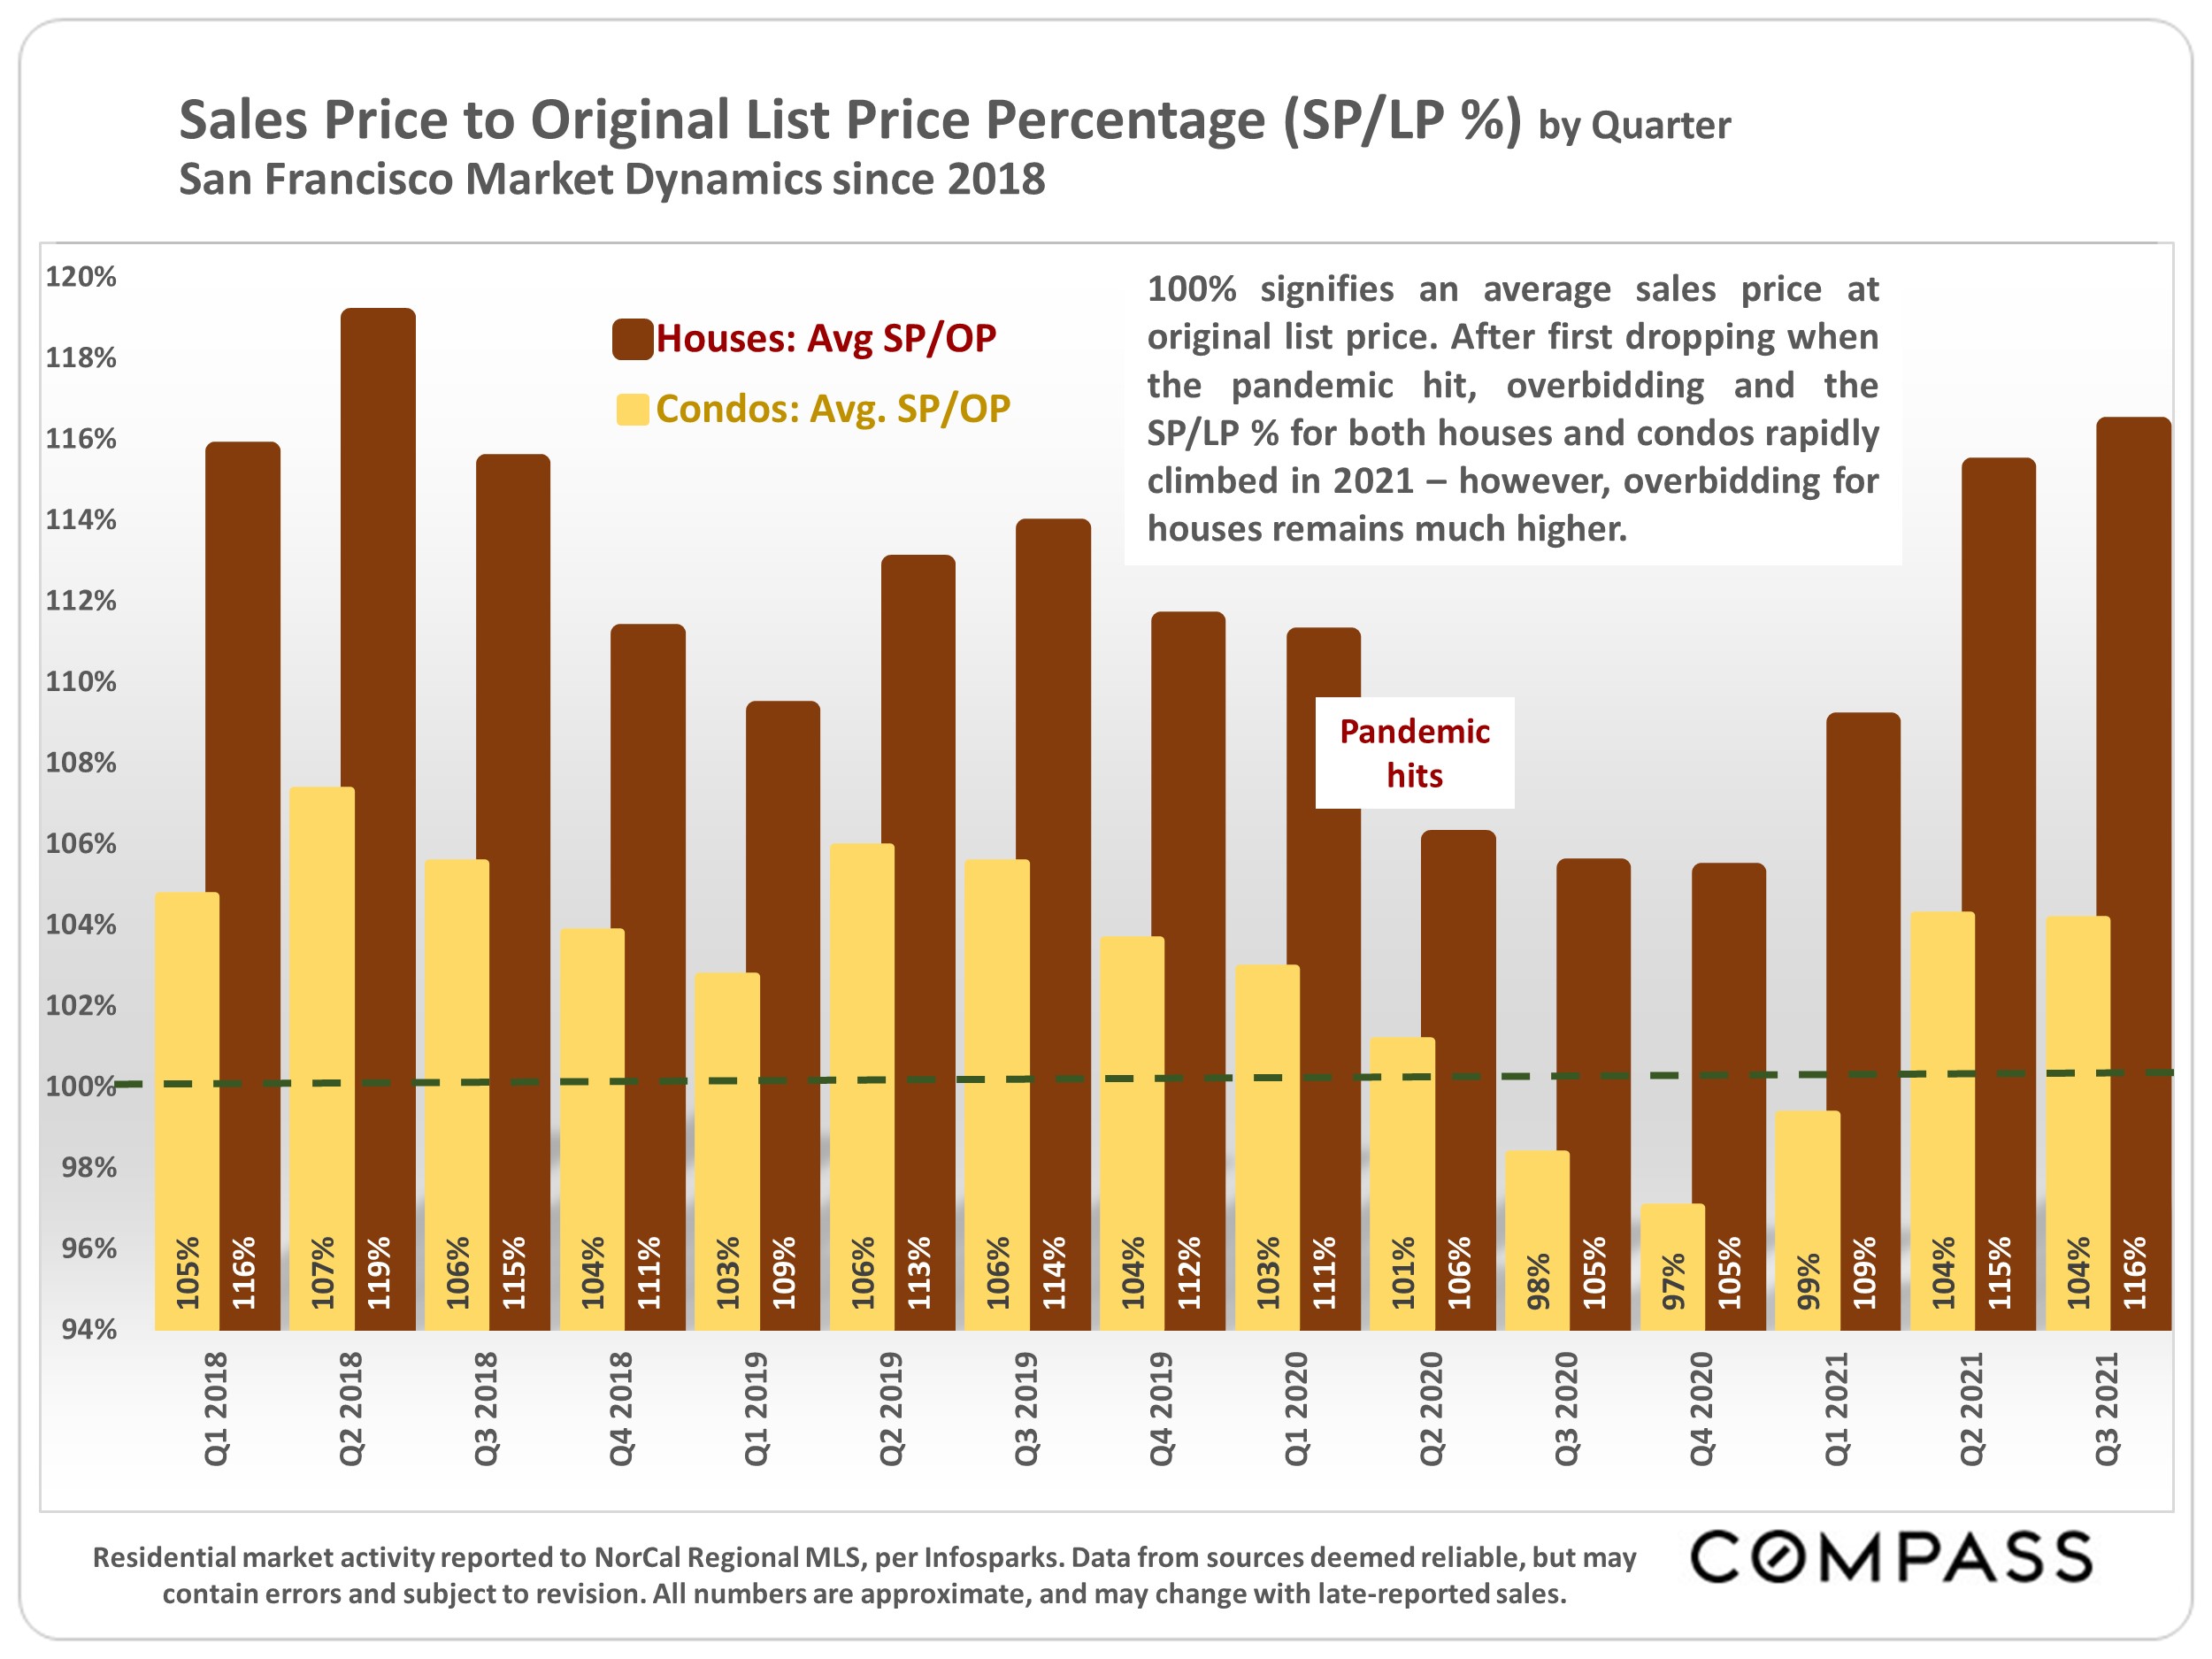
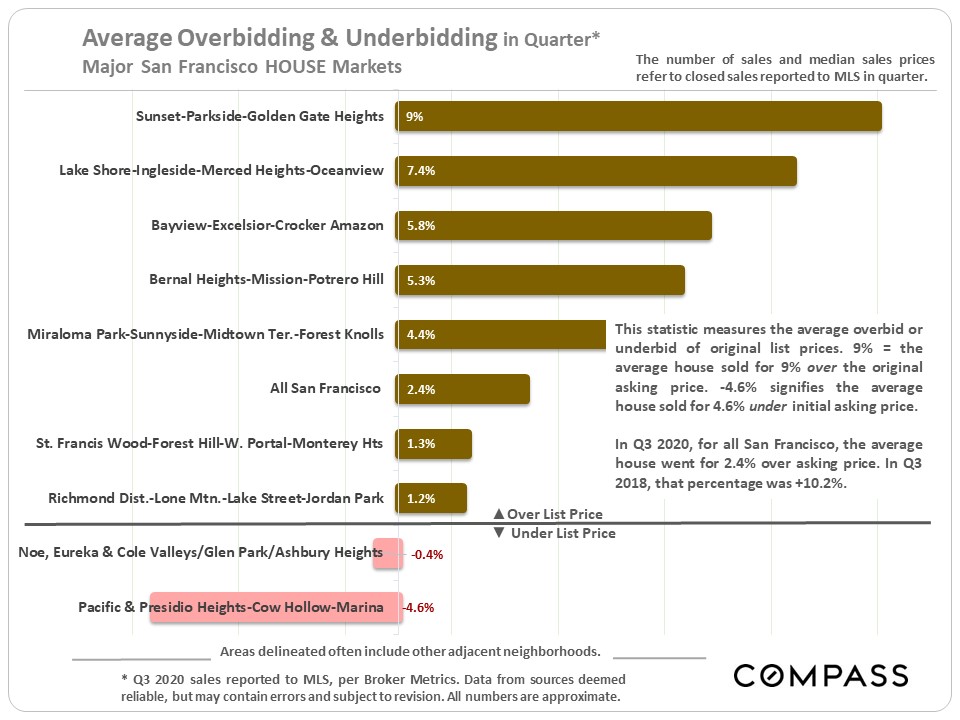
Overbidding on house listings is well down from the crazed levels of recent years, but is still relatively common in more affordable districts. Some part of the overbidding percentages is caused by strategic underpricing of listings (to get buyers excited).
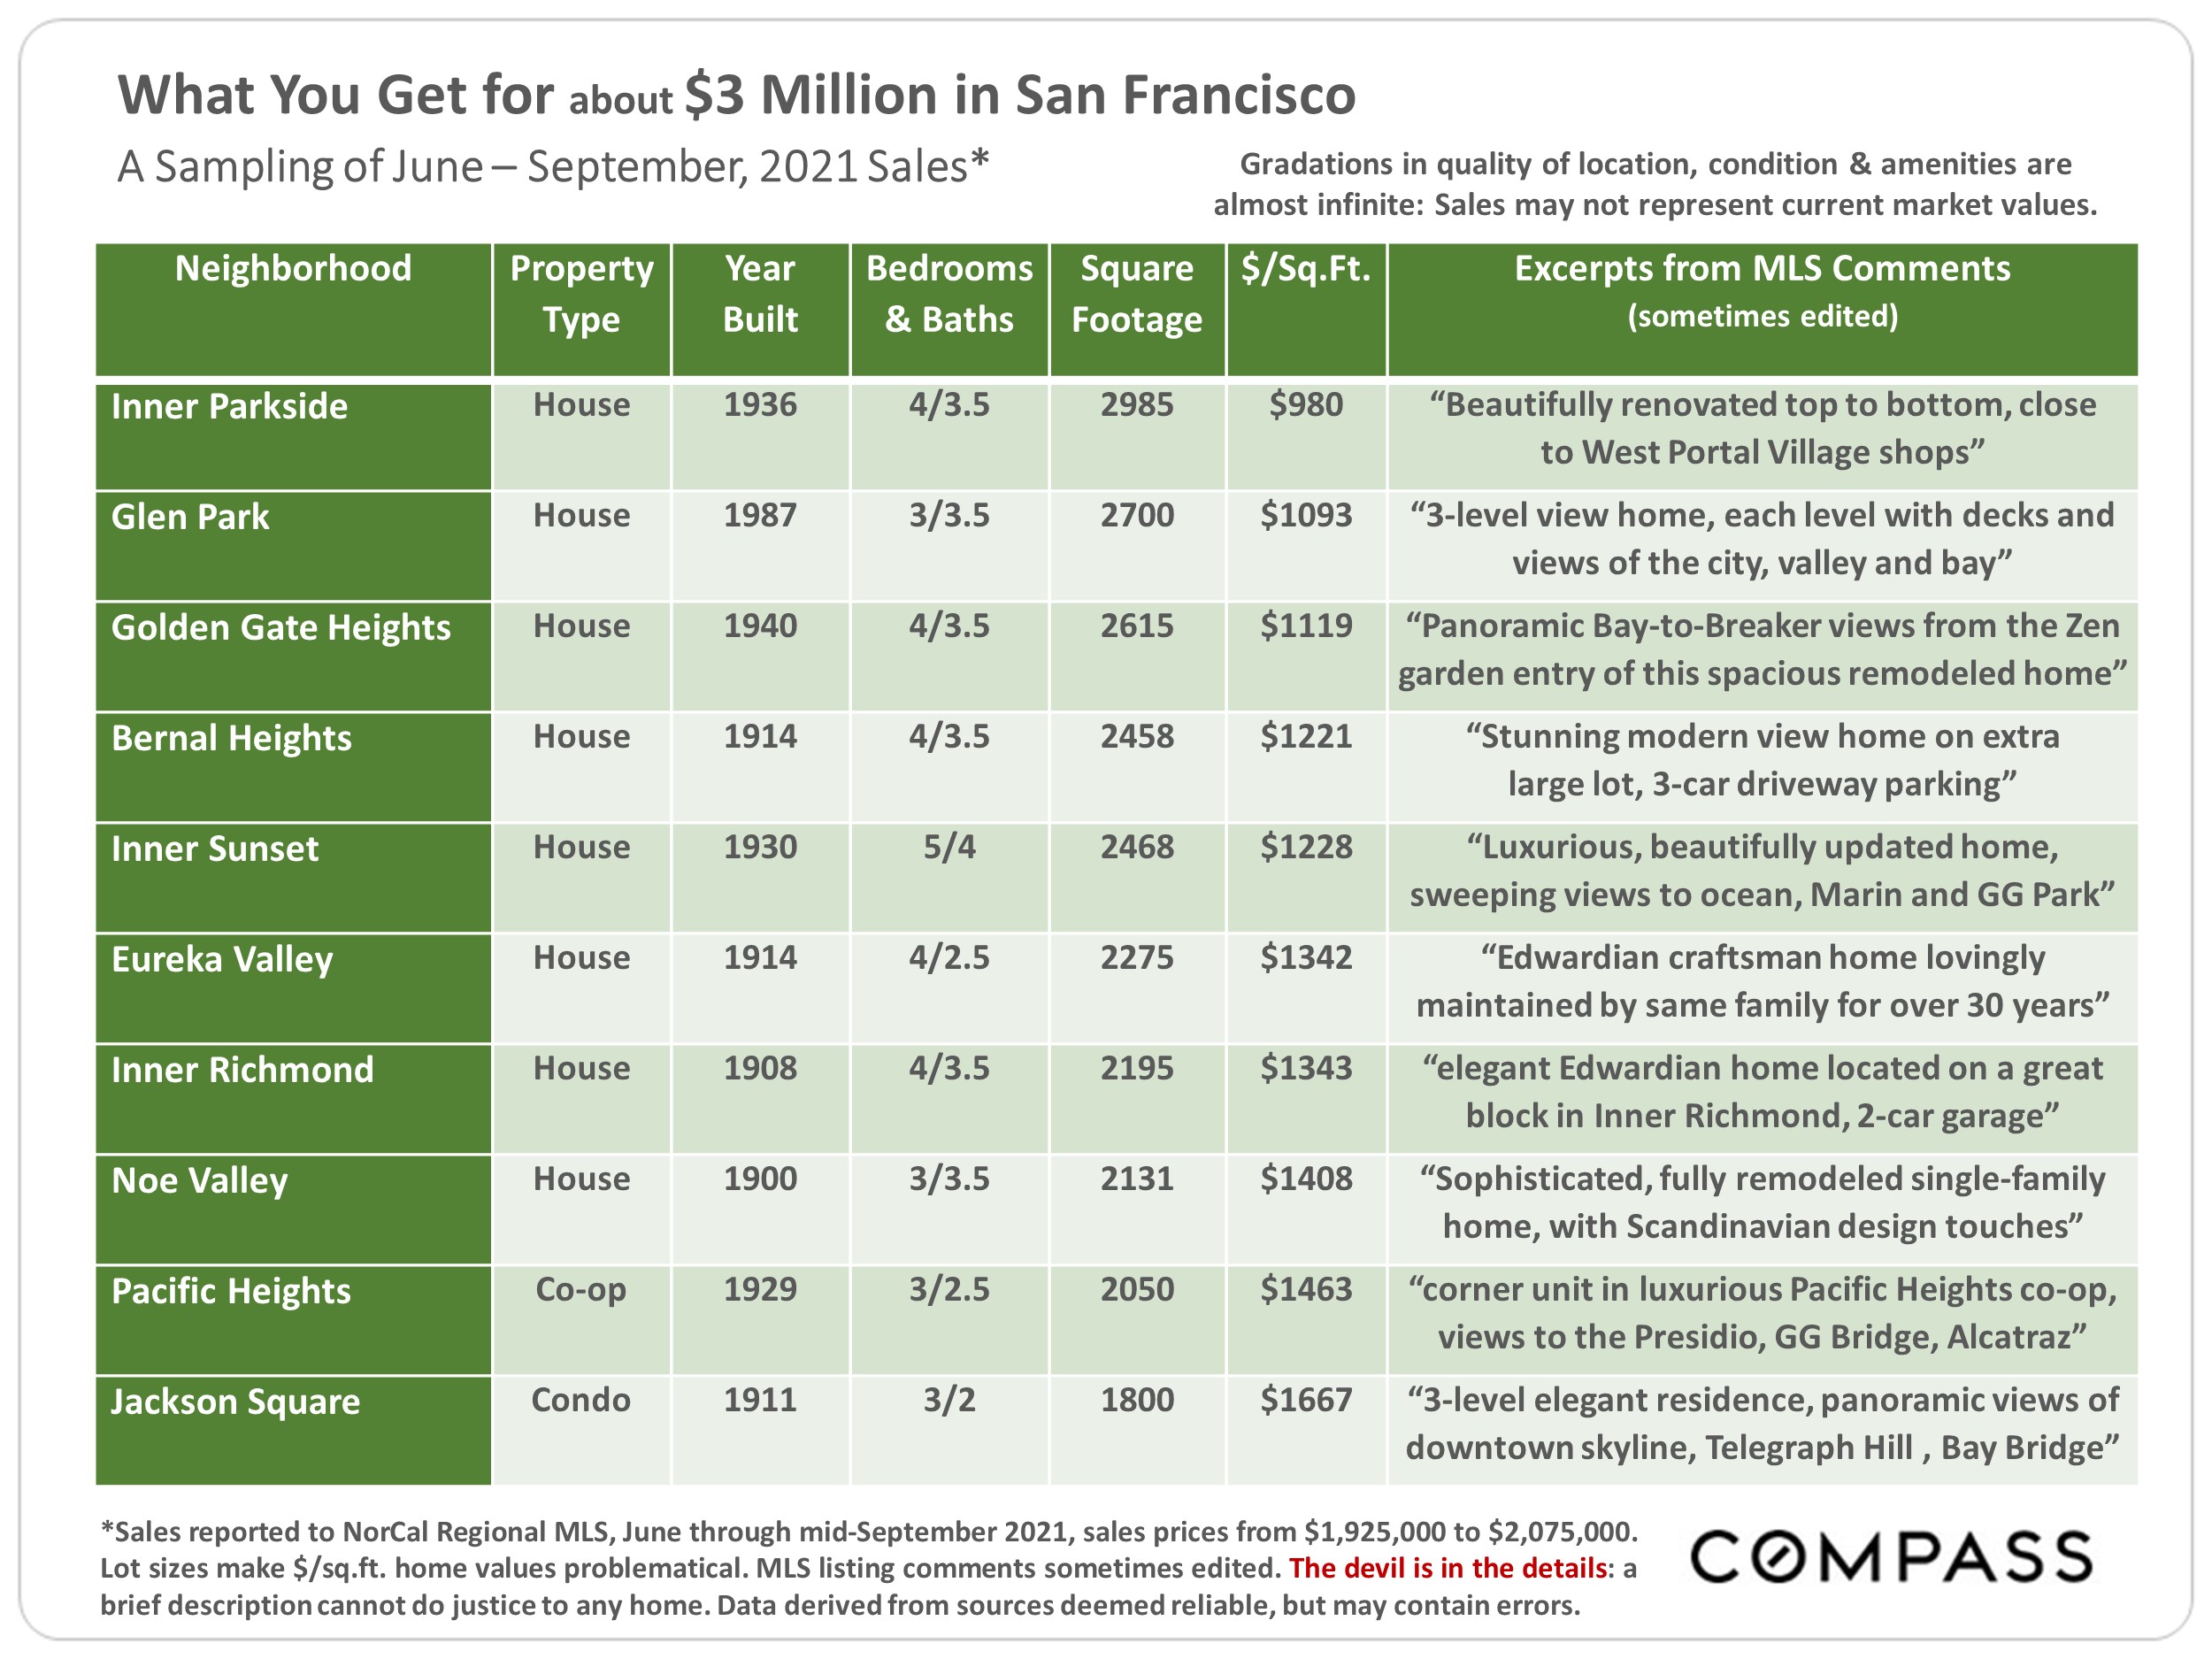
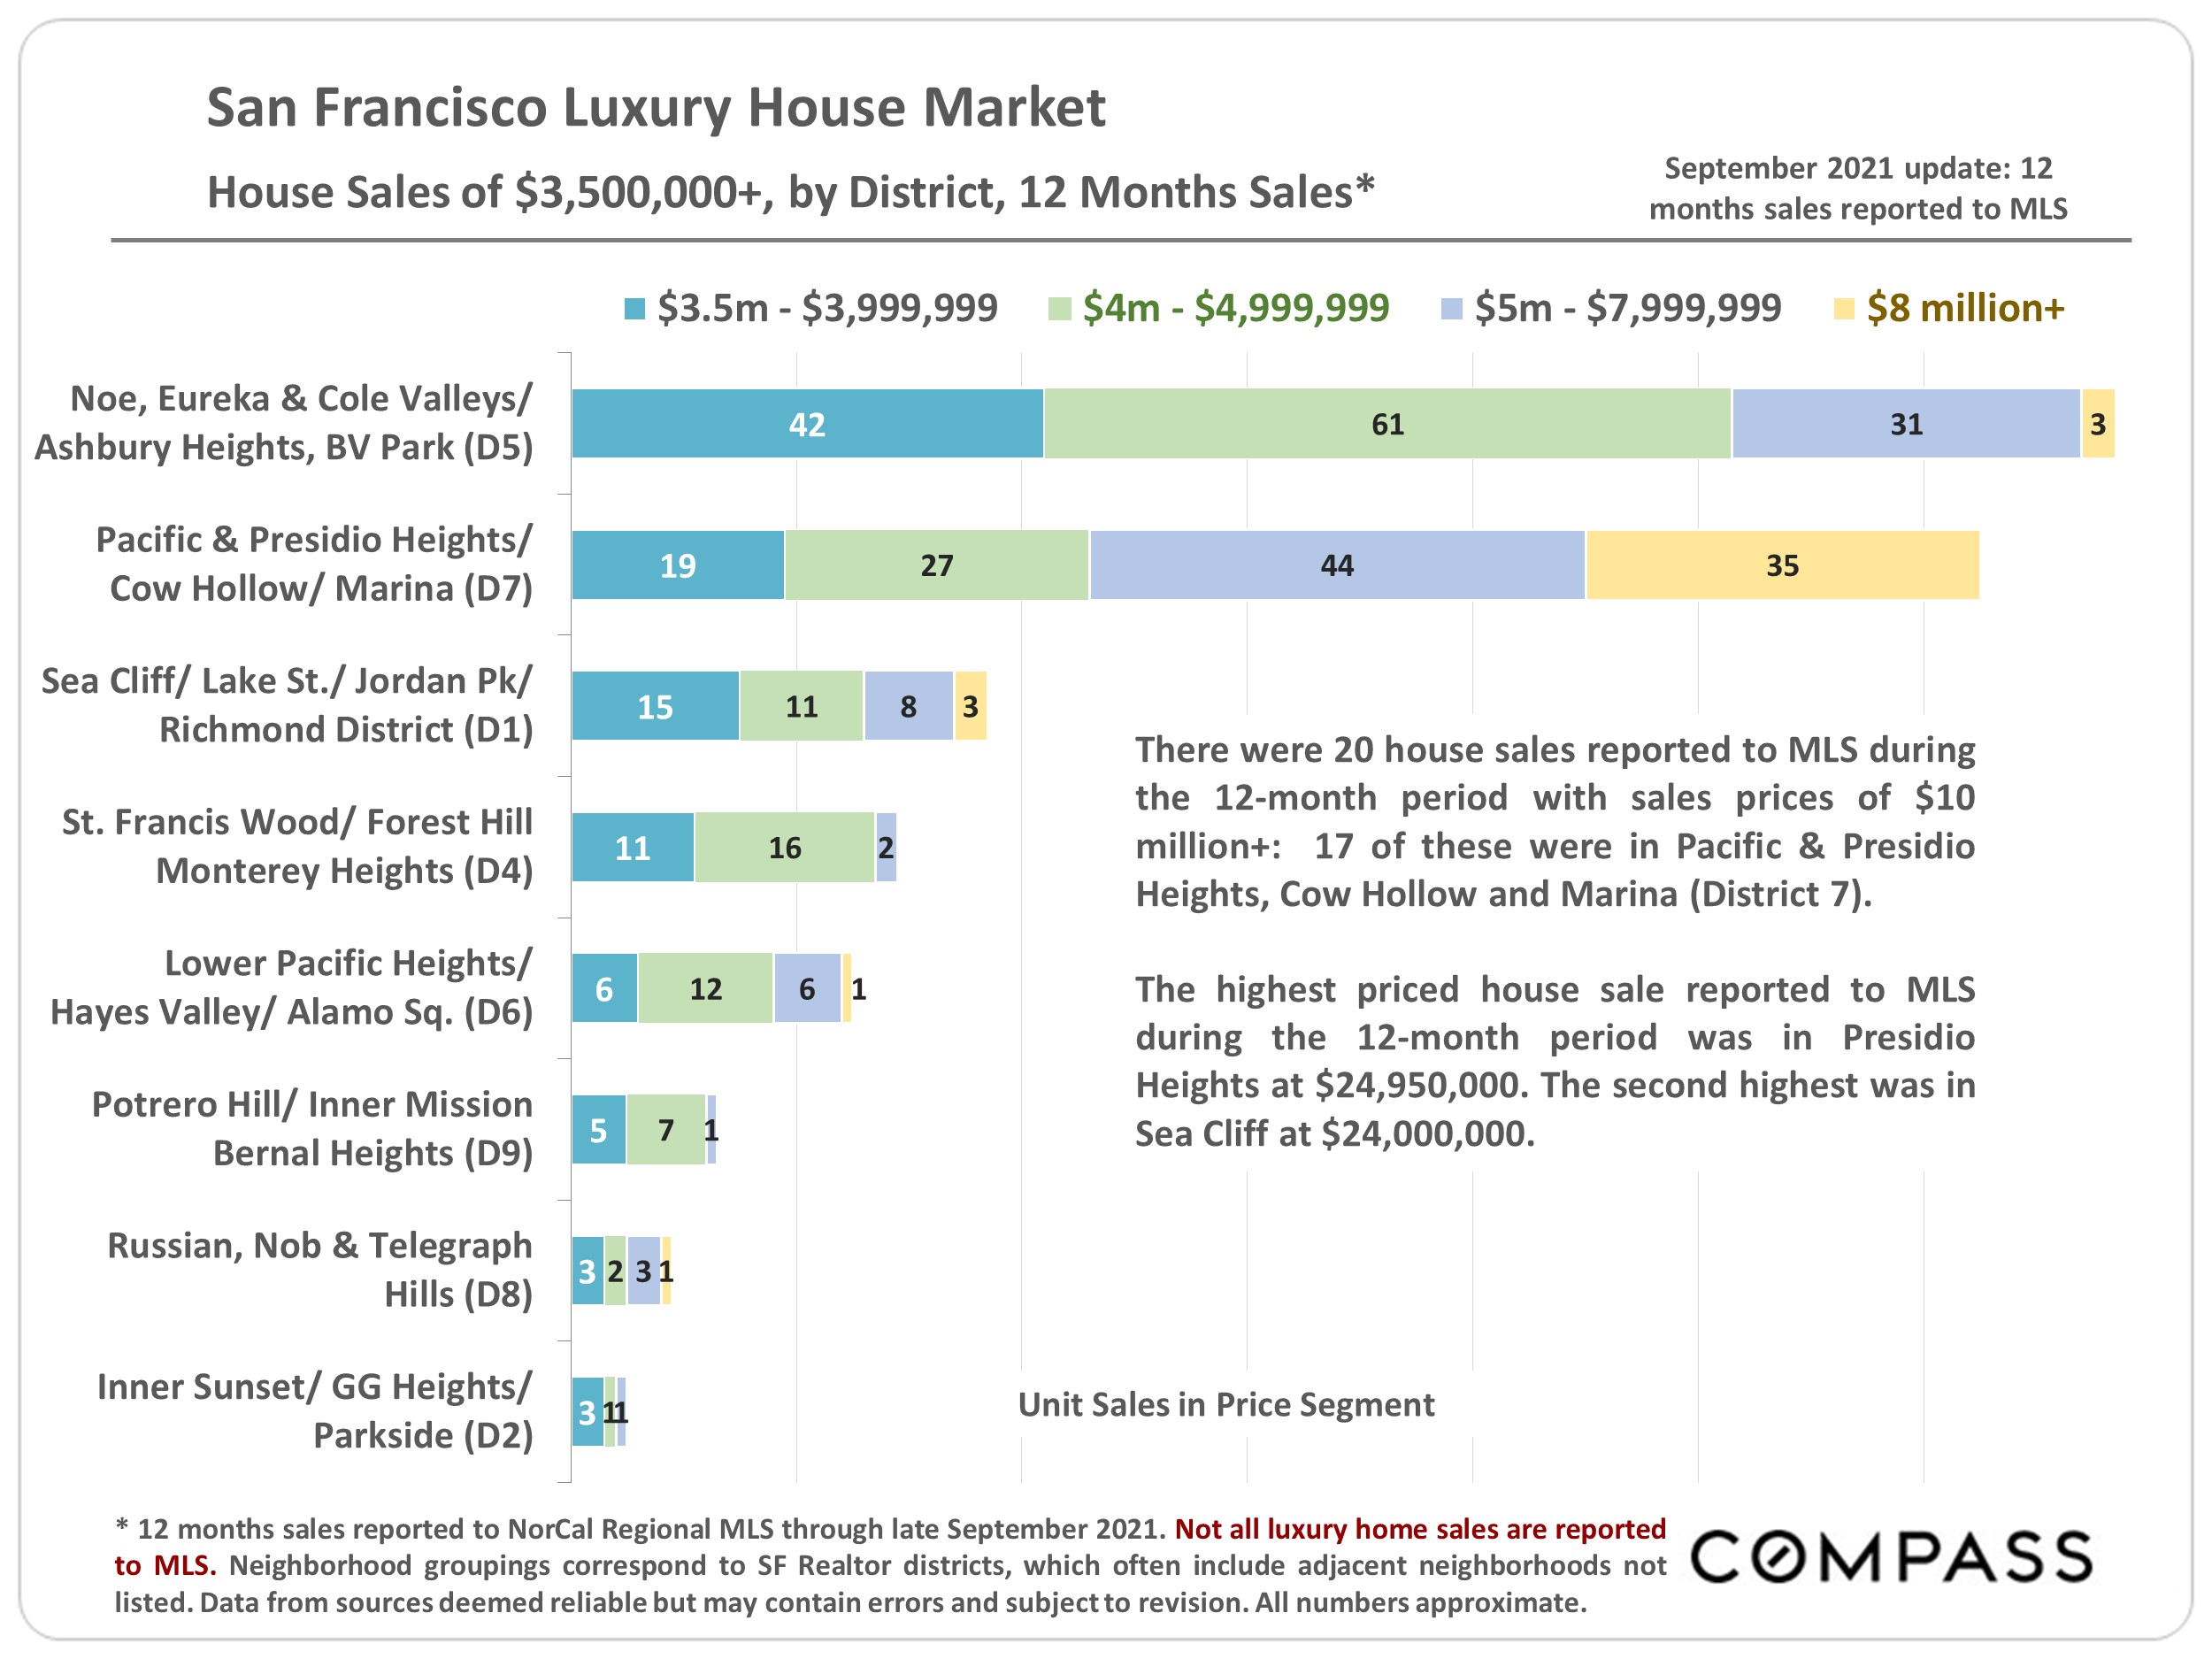
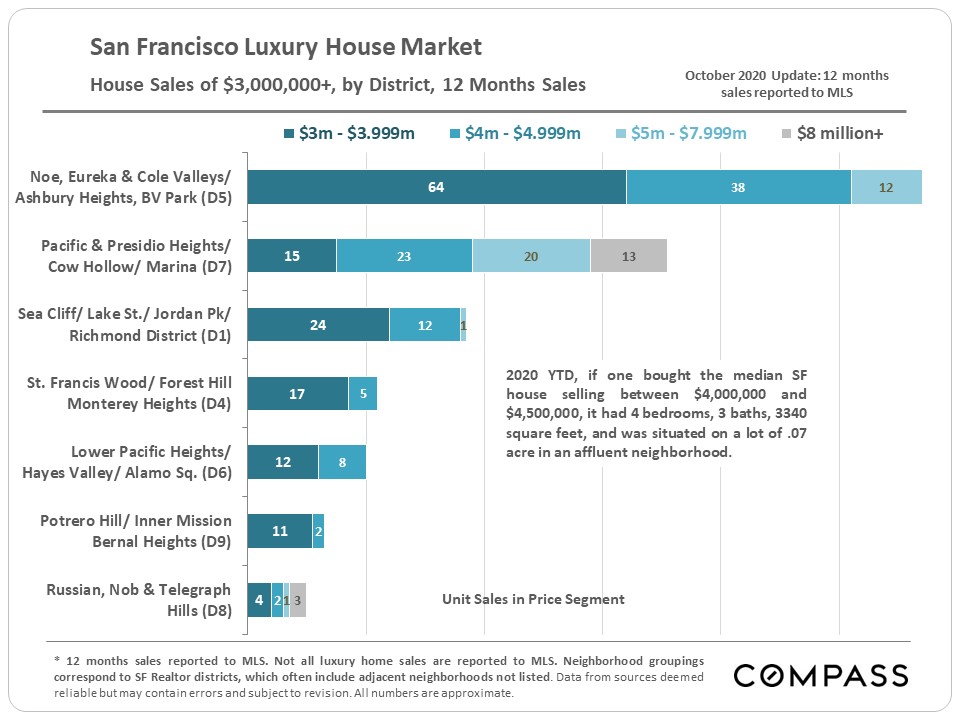
A breakdown of house sales, $3 million and above, by district over the past 12 months.
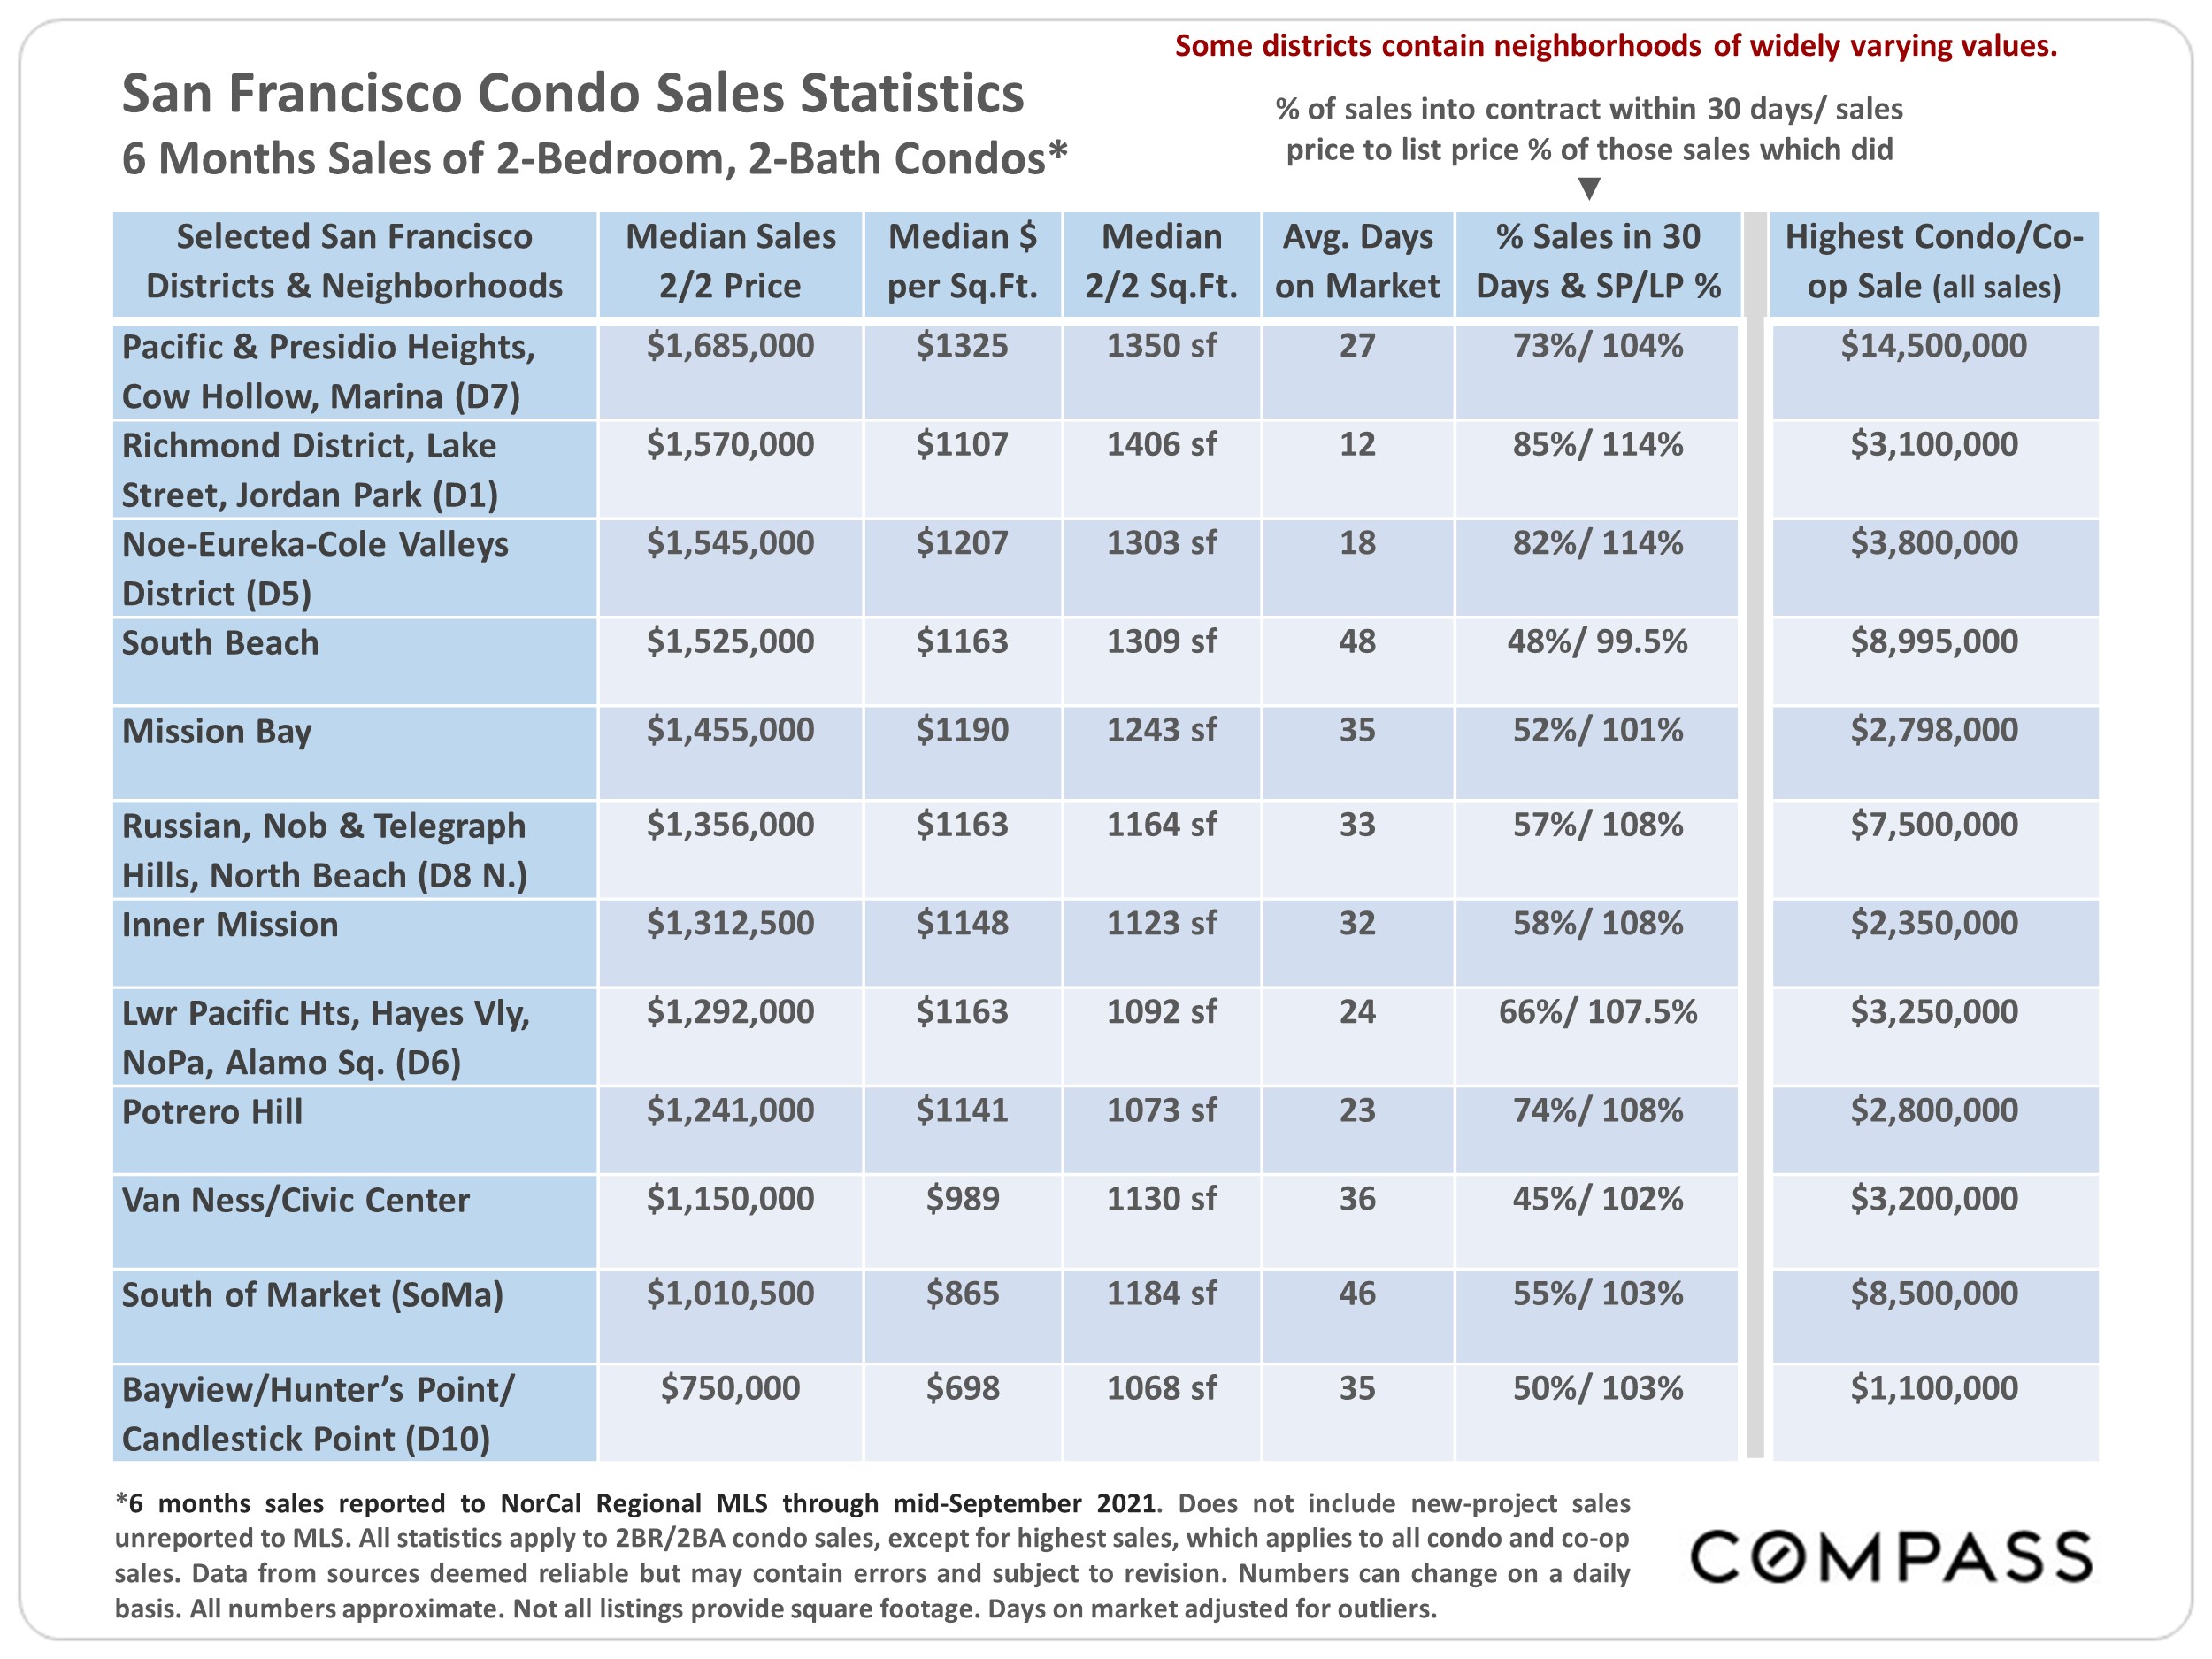
San Francisco Condo Markets by District/Neighborhood
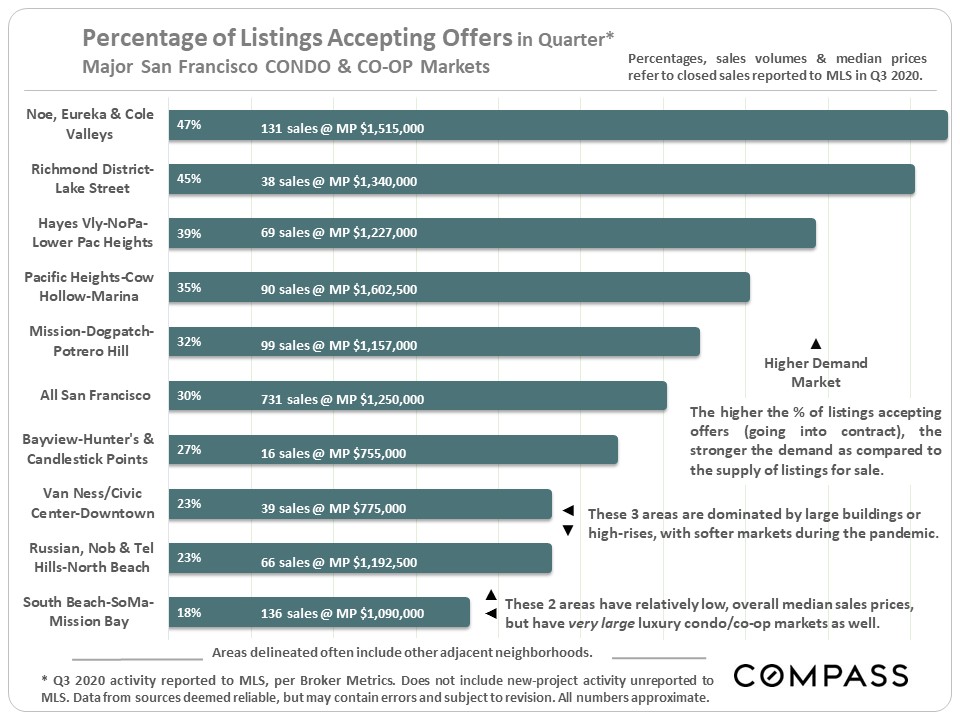
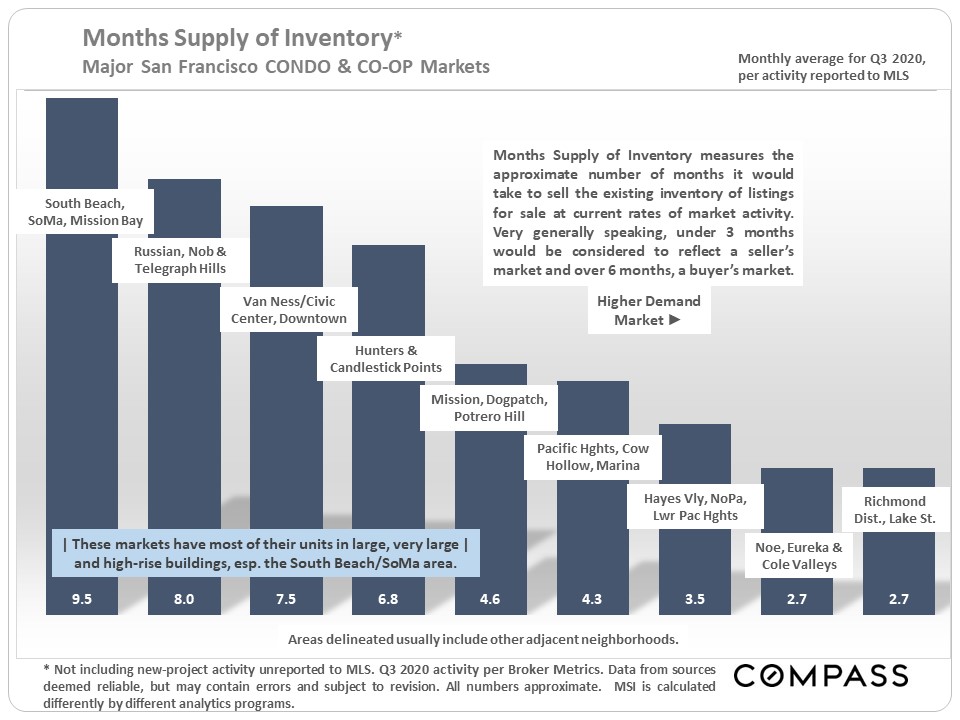
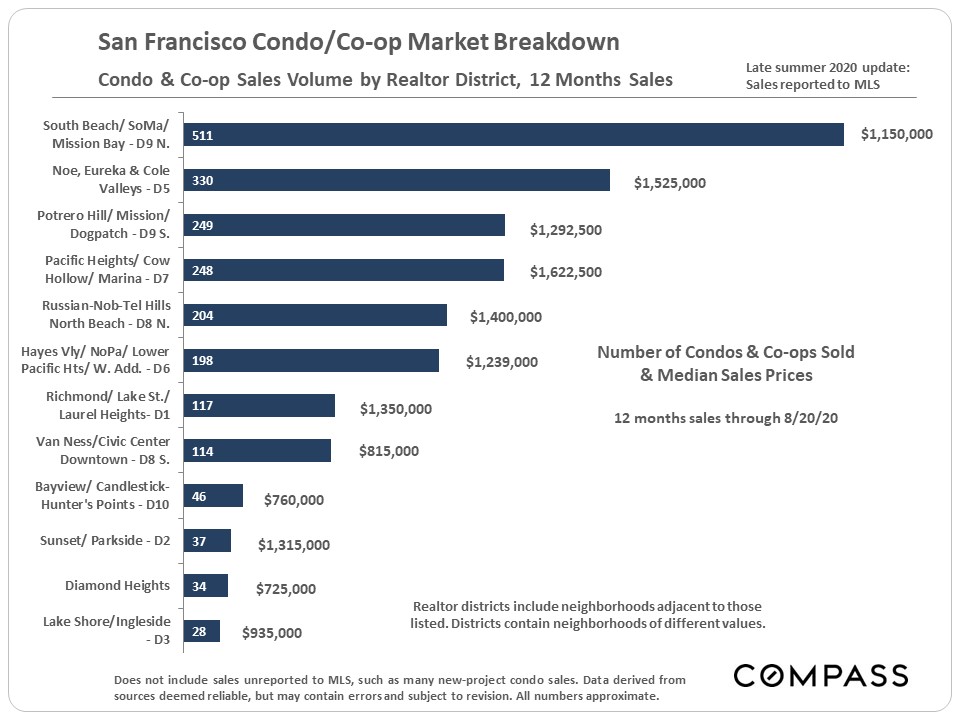
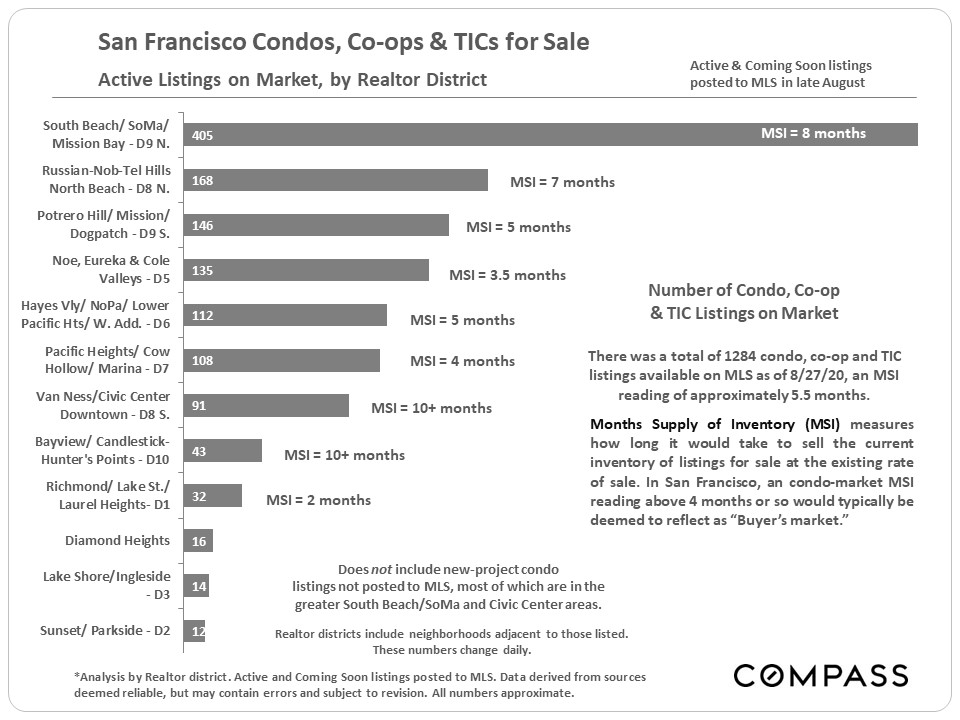
Since the pandemic hit, the softest condo markets have been those dominated by larger complexes and high-rises. The greater South Beach/ SoMa/ Mission Bay area – by far the largest condo market in SF – has the weakest supply and demand dynamic, followed by the greater Russian, Nob and Telegraph Hills area, and the Van Ness/Civic Center area.
Markets dominated by smaller buildings, often with separate unit entrances and dedicated outdoor spaces, have seen stronger buyer demand.
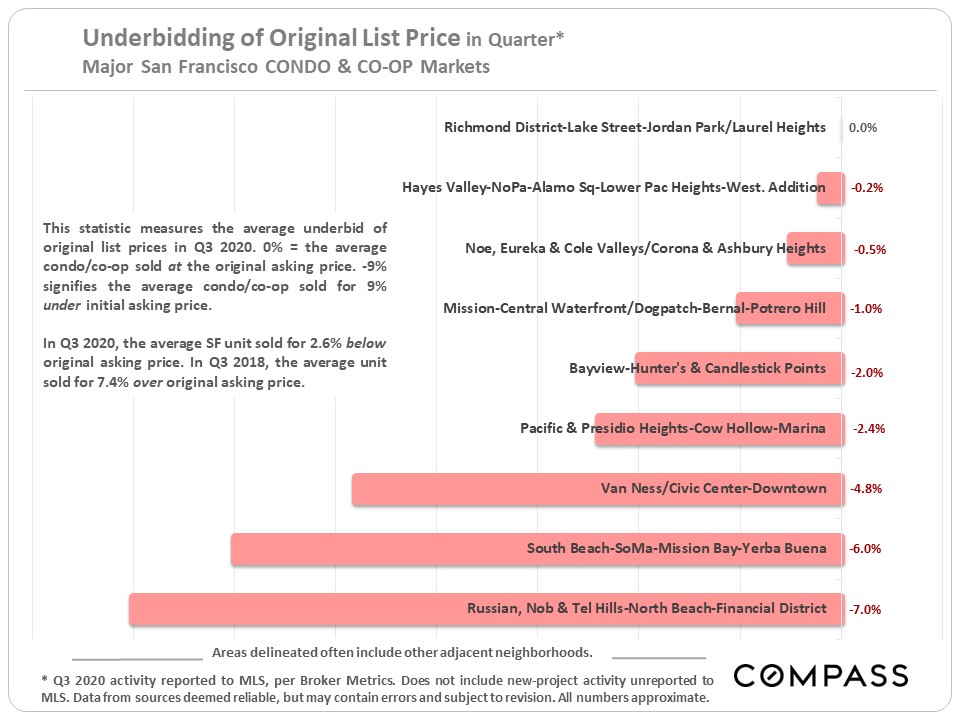
As a statistical average, overbidding above the original list price has disappeared from the condo market. This ties in with the previous chart on price reductions.
Compass is a real estate broker licensed by the State of California operating under
multiple entities. License Numbers 01991628, 1527235, 1527365, 1356742, 1443761, 1997075,
1935359, 1961027, 1842987, 1869607, 1866771, 1527205, 1079009, 1272467. All material presented
herein is intended for informational purposes only and is compiled from sources deemed reliable
but has not been verified. Changes in price, condition, sale or withdrawal may be made without
notice. No statement is made as to accuracy of any description. All measurements and square
footage are approximate. Equal Housing Opportunity.
In the context of the horrible fires we've seen in recent weeks – with many of our Bay Area communities and neighbors so terribly affected – a real estate report seems trivial. But since we have clients still trying to make buying and selling decisions, we will try to continue to deliver straightforward data on market conditions.
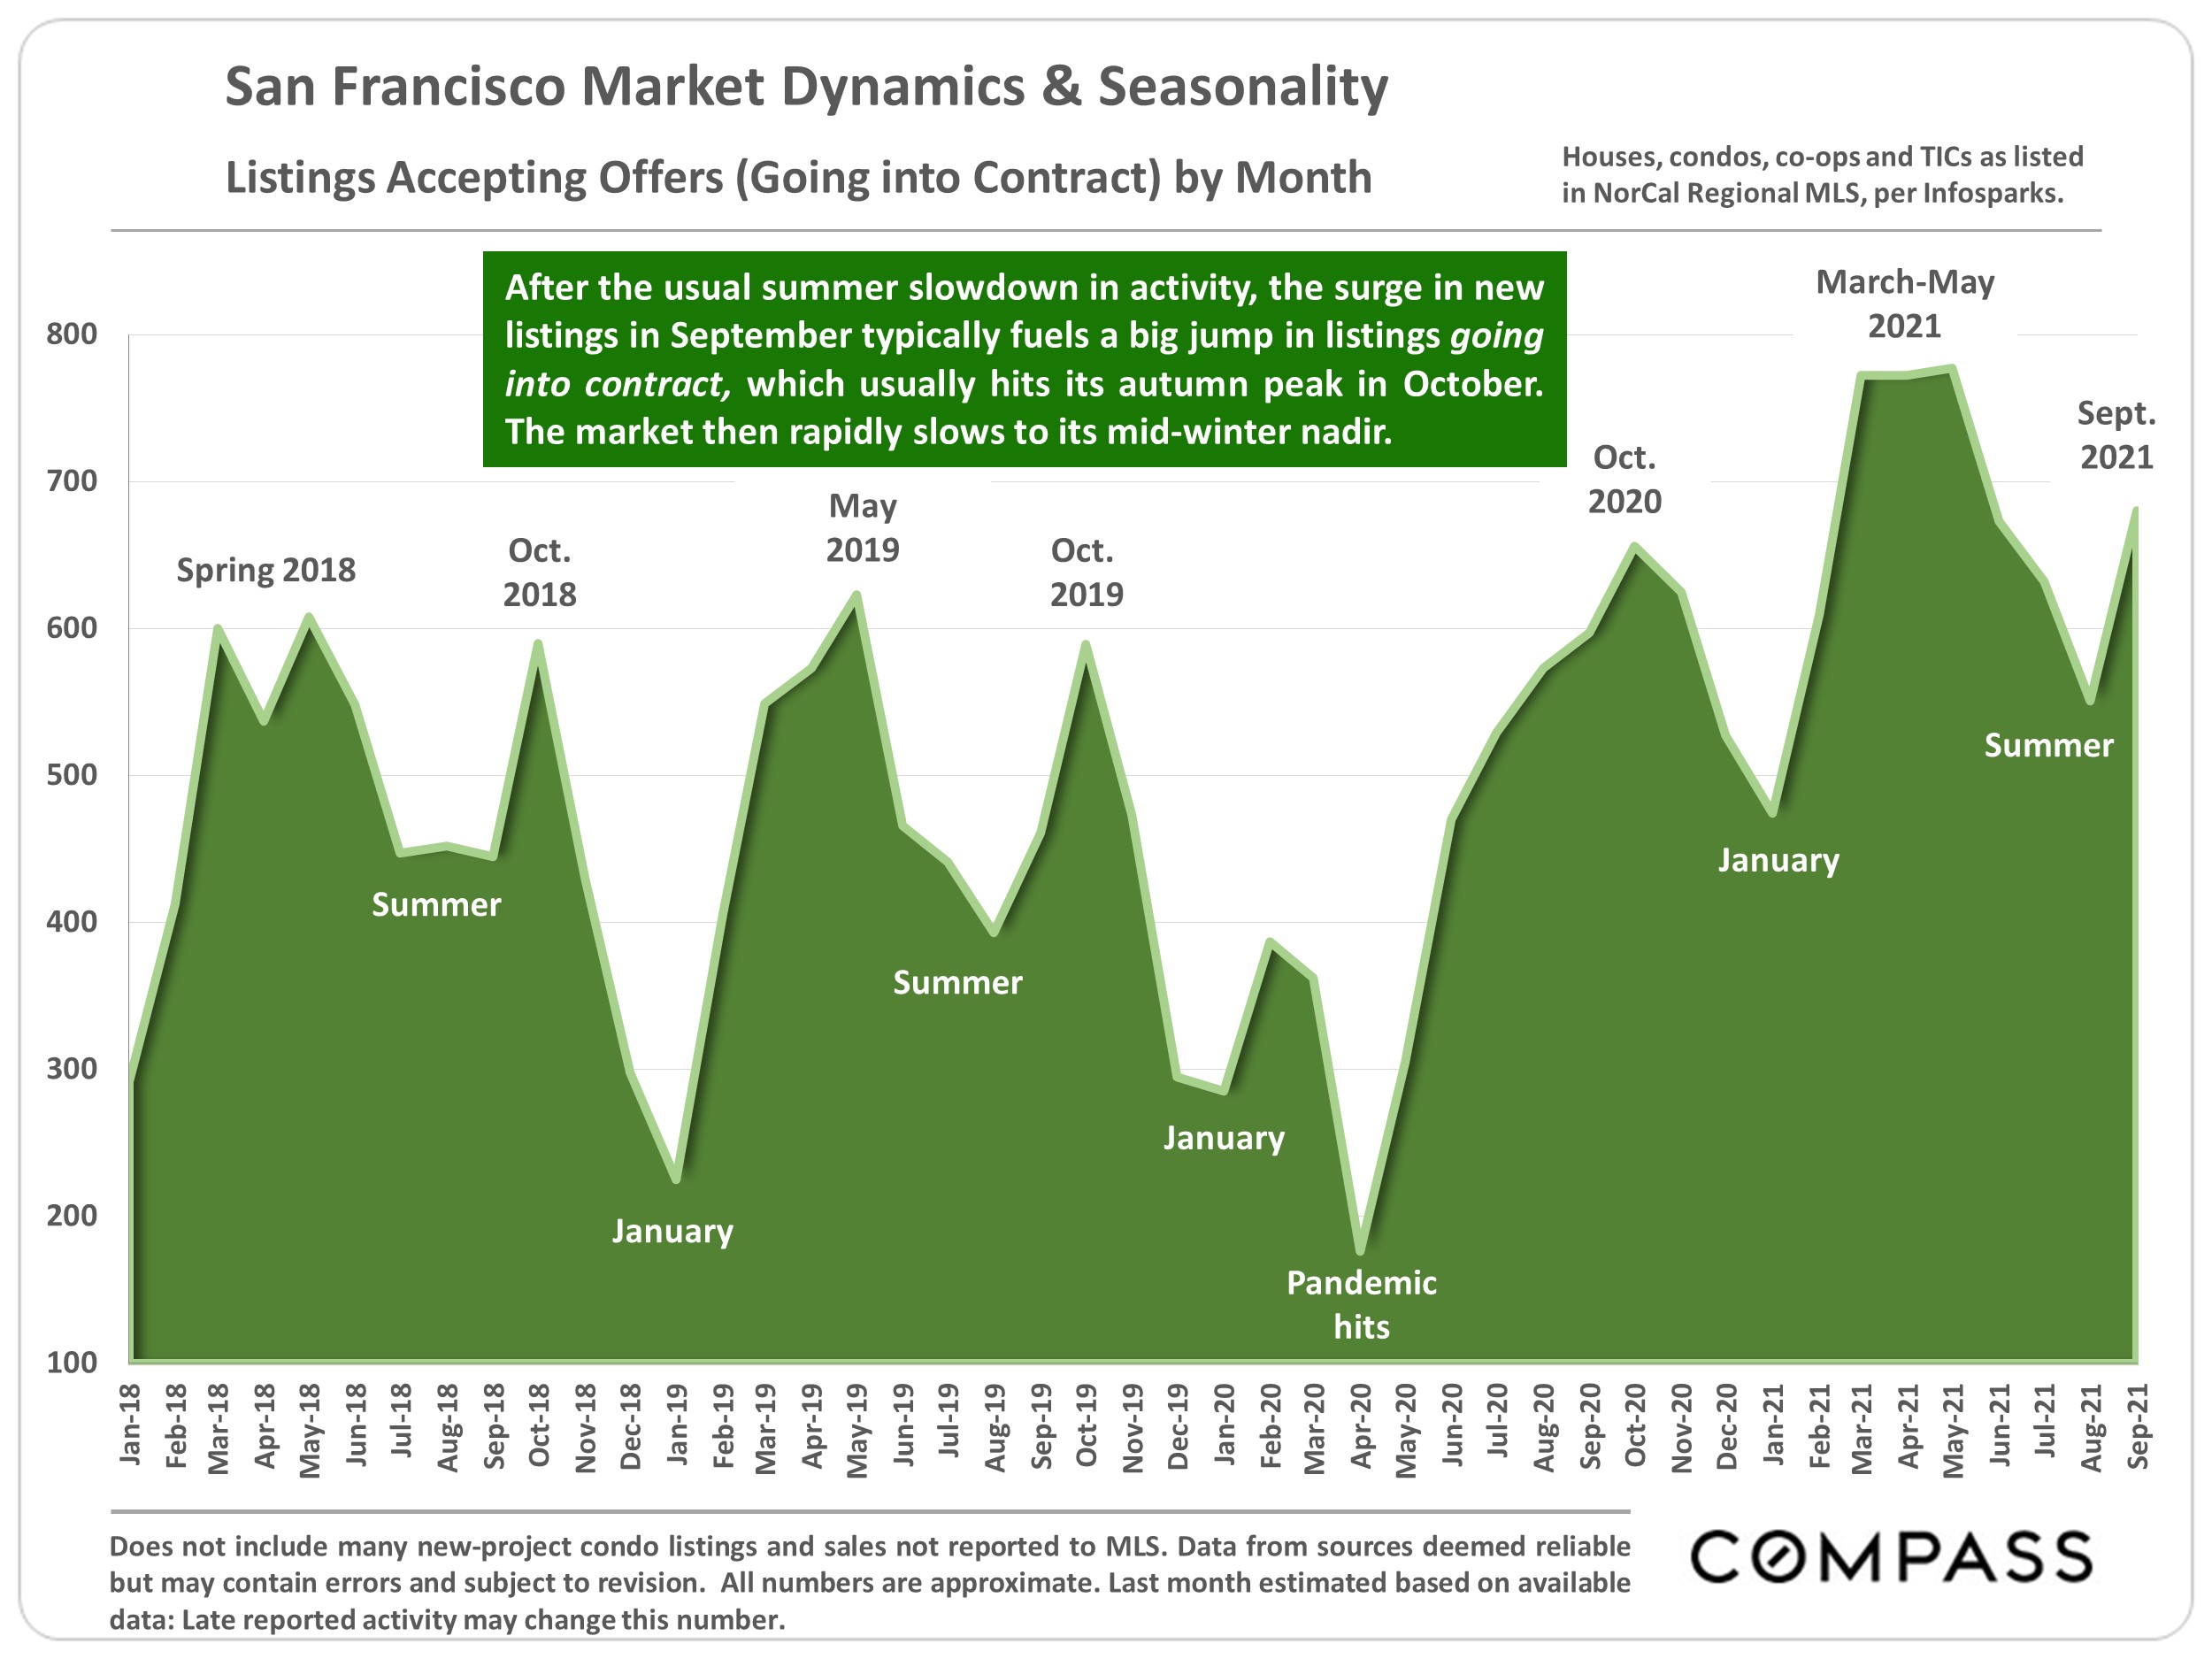
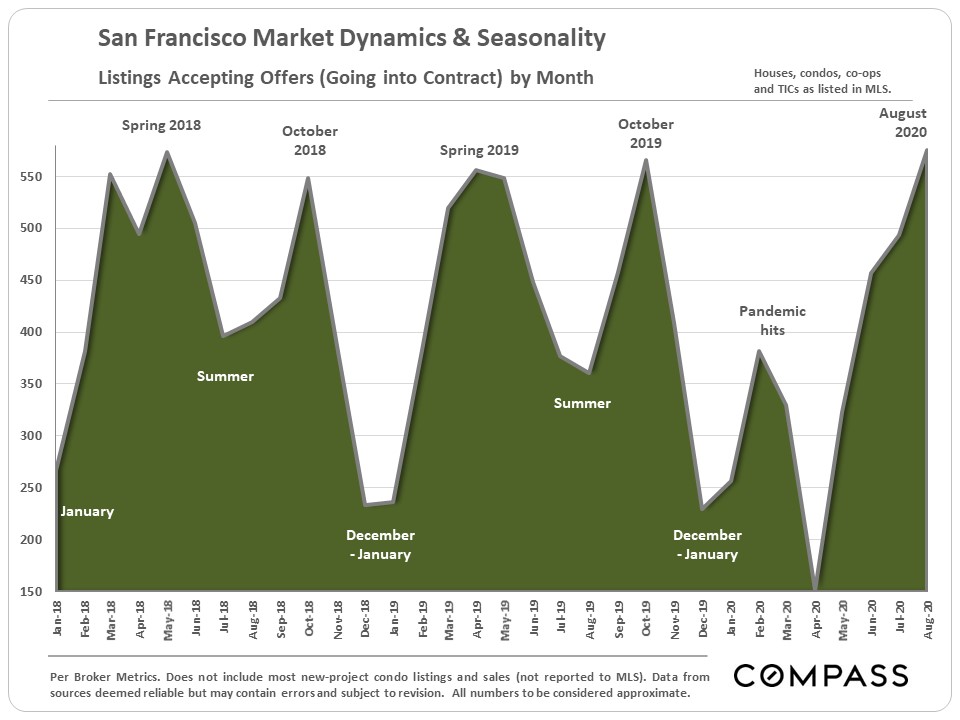
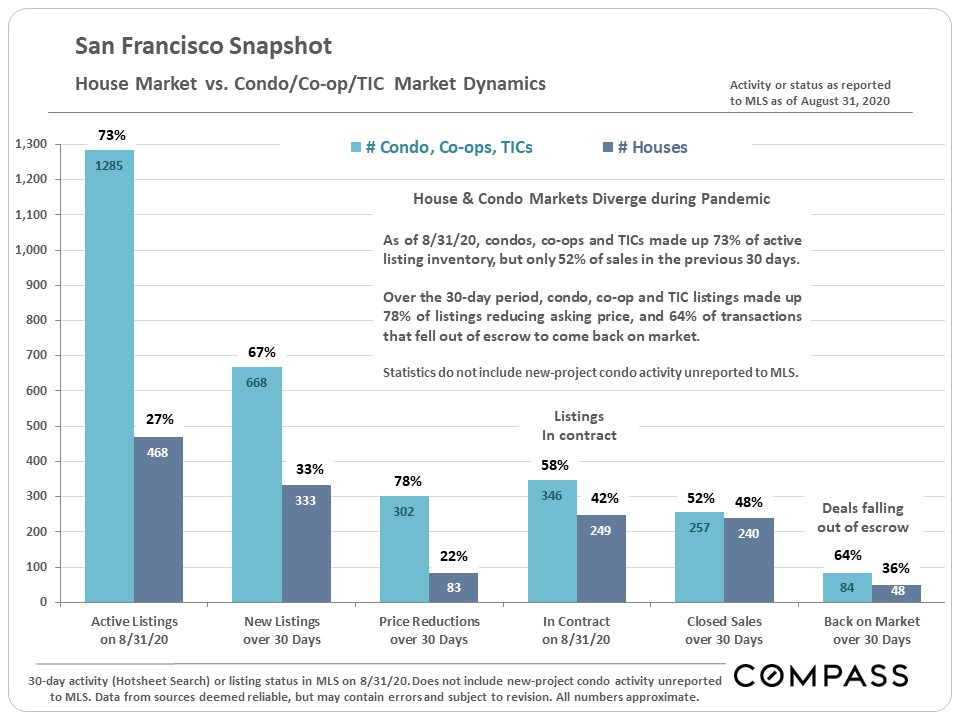
Despite the fires, SF had a very active month in listings going into contract in August, hitting a high point for the year and matching the high points of recent years.
______________________________________
With no more open houses, all viewings of properties are by appointment. Buyers need agents to open the door. If you know anyone who might be in the market to buy property during this time, please forward my contact information or reach out to me and I'll call them.
And if you'd like to know more about the market or to just say hello, please give me a call. Thank you!
Pota
415 407 2595
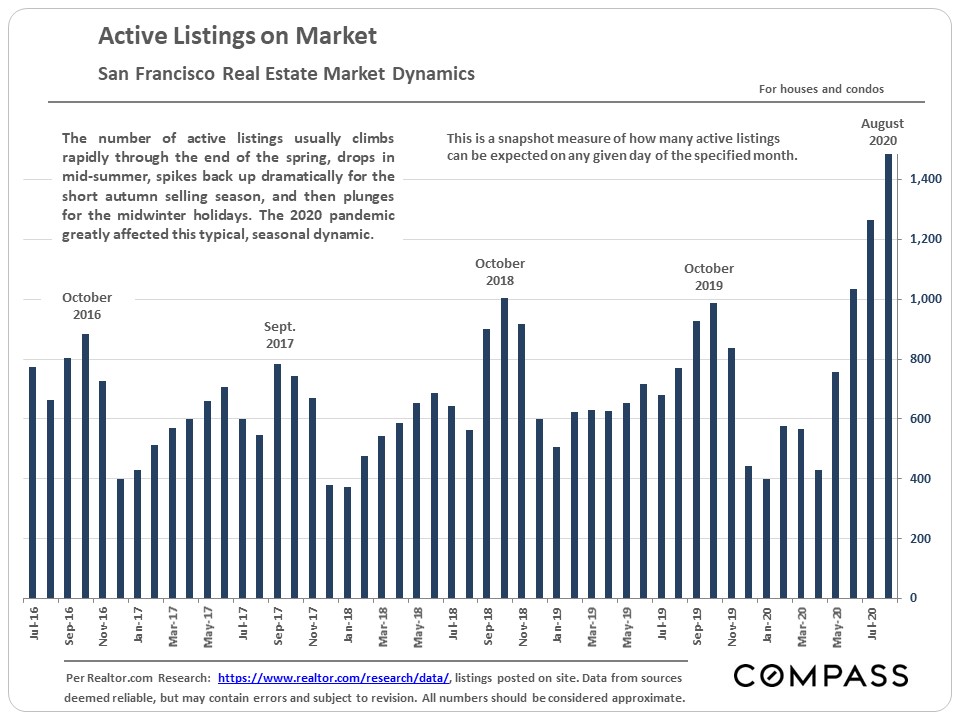
The number of active listings on the SF market has risen dramatically over the last few months, outpacing the increase in listings going into contract. However, there are significant differences between the house and condo markets, which are discussed later in the report.
With the increase in inventory has come a big jump in the number of listings reducing asking price. In some market segments, sellers are now competing for buyers, instead of buyers competing for listings.
The next two charts illustrate how the house and condo markets have diverged since the pandemic hit. The condo market is much weaker, comparing demand to supply. However, within the condo market, different neighborhoods are seeing varying dynamics, and hundreds of condos are still selling each month. More detail follows later in the report.
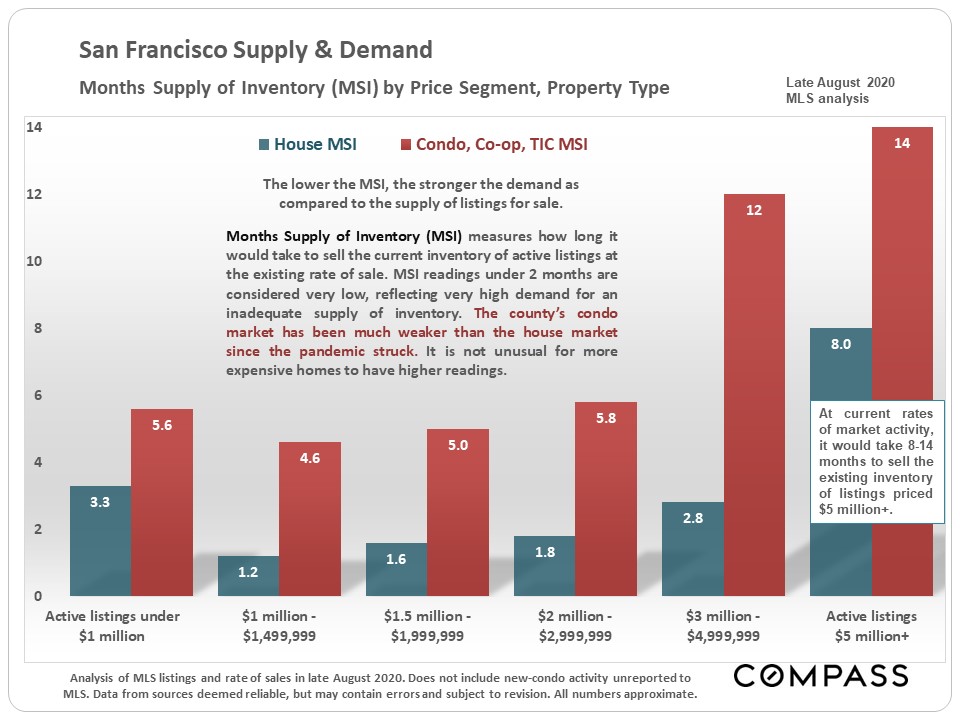
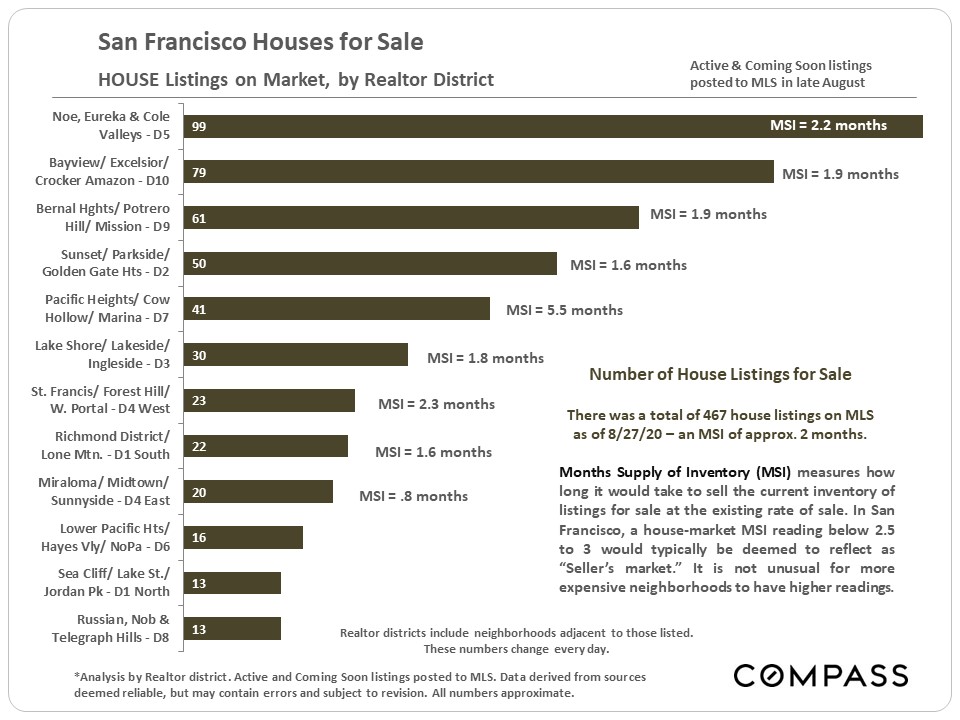
Regarding the next chart, the lower the Months Supply of Inventory (MSI), the stronger the demand as compared to the supply of listings for sale. Much of the SF house market (blue columns) remains firmly in "seller's market" territory, but the condo market's supply (red columns) is outpacing buyer demand, especially in the higher price segments.
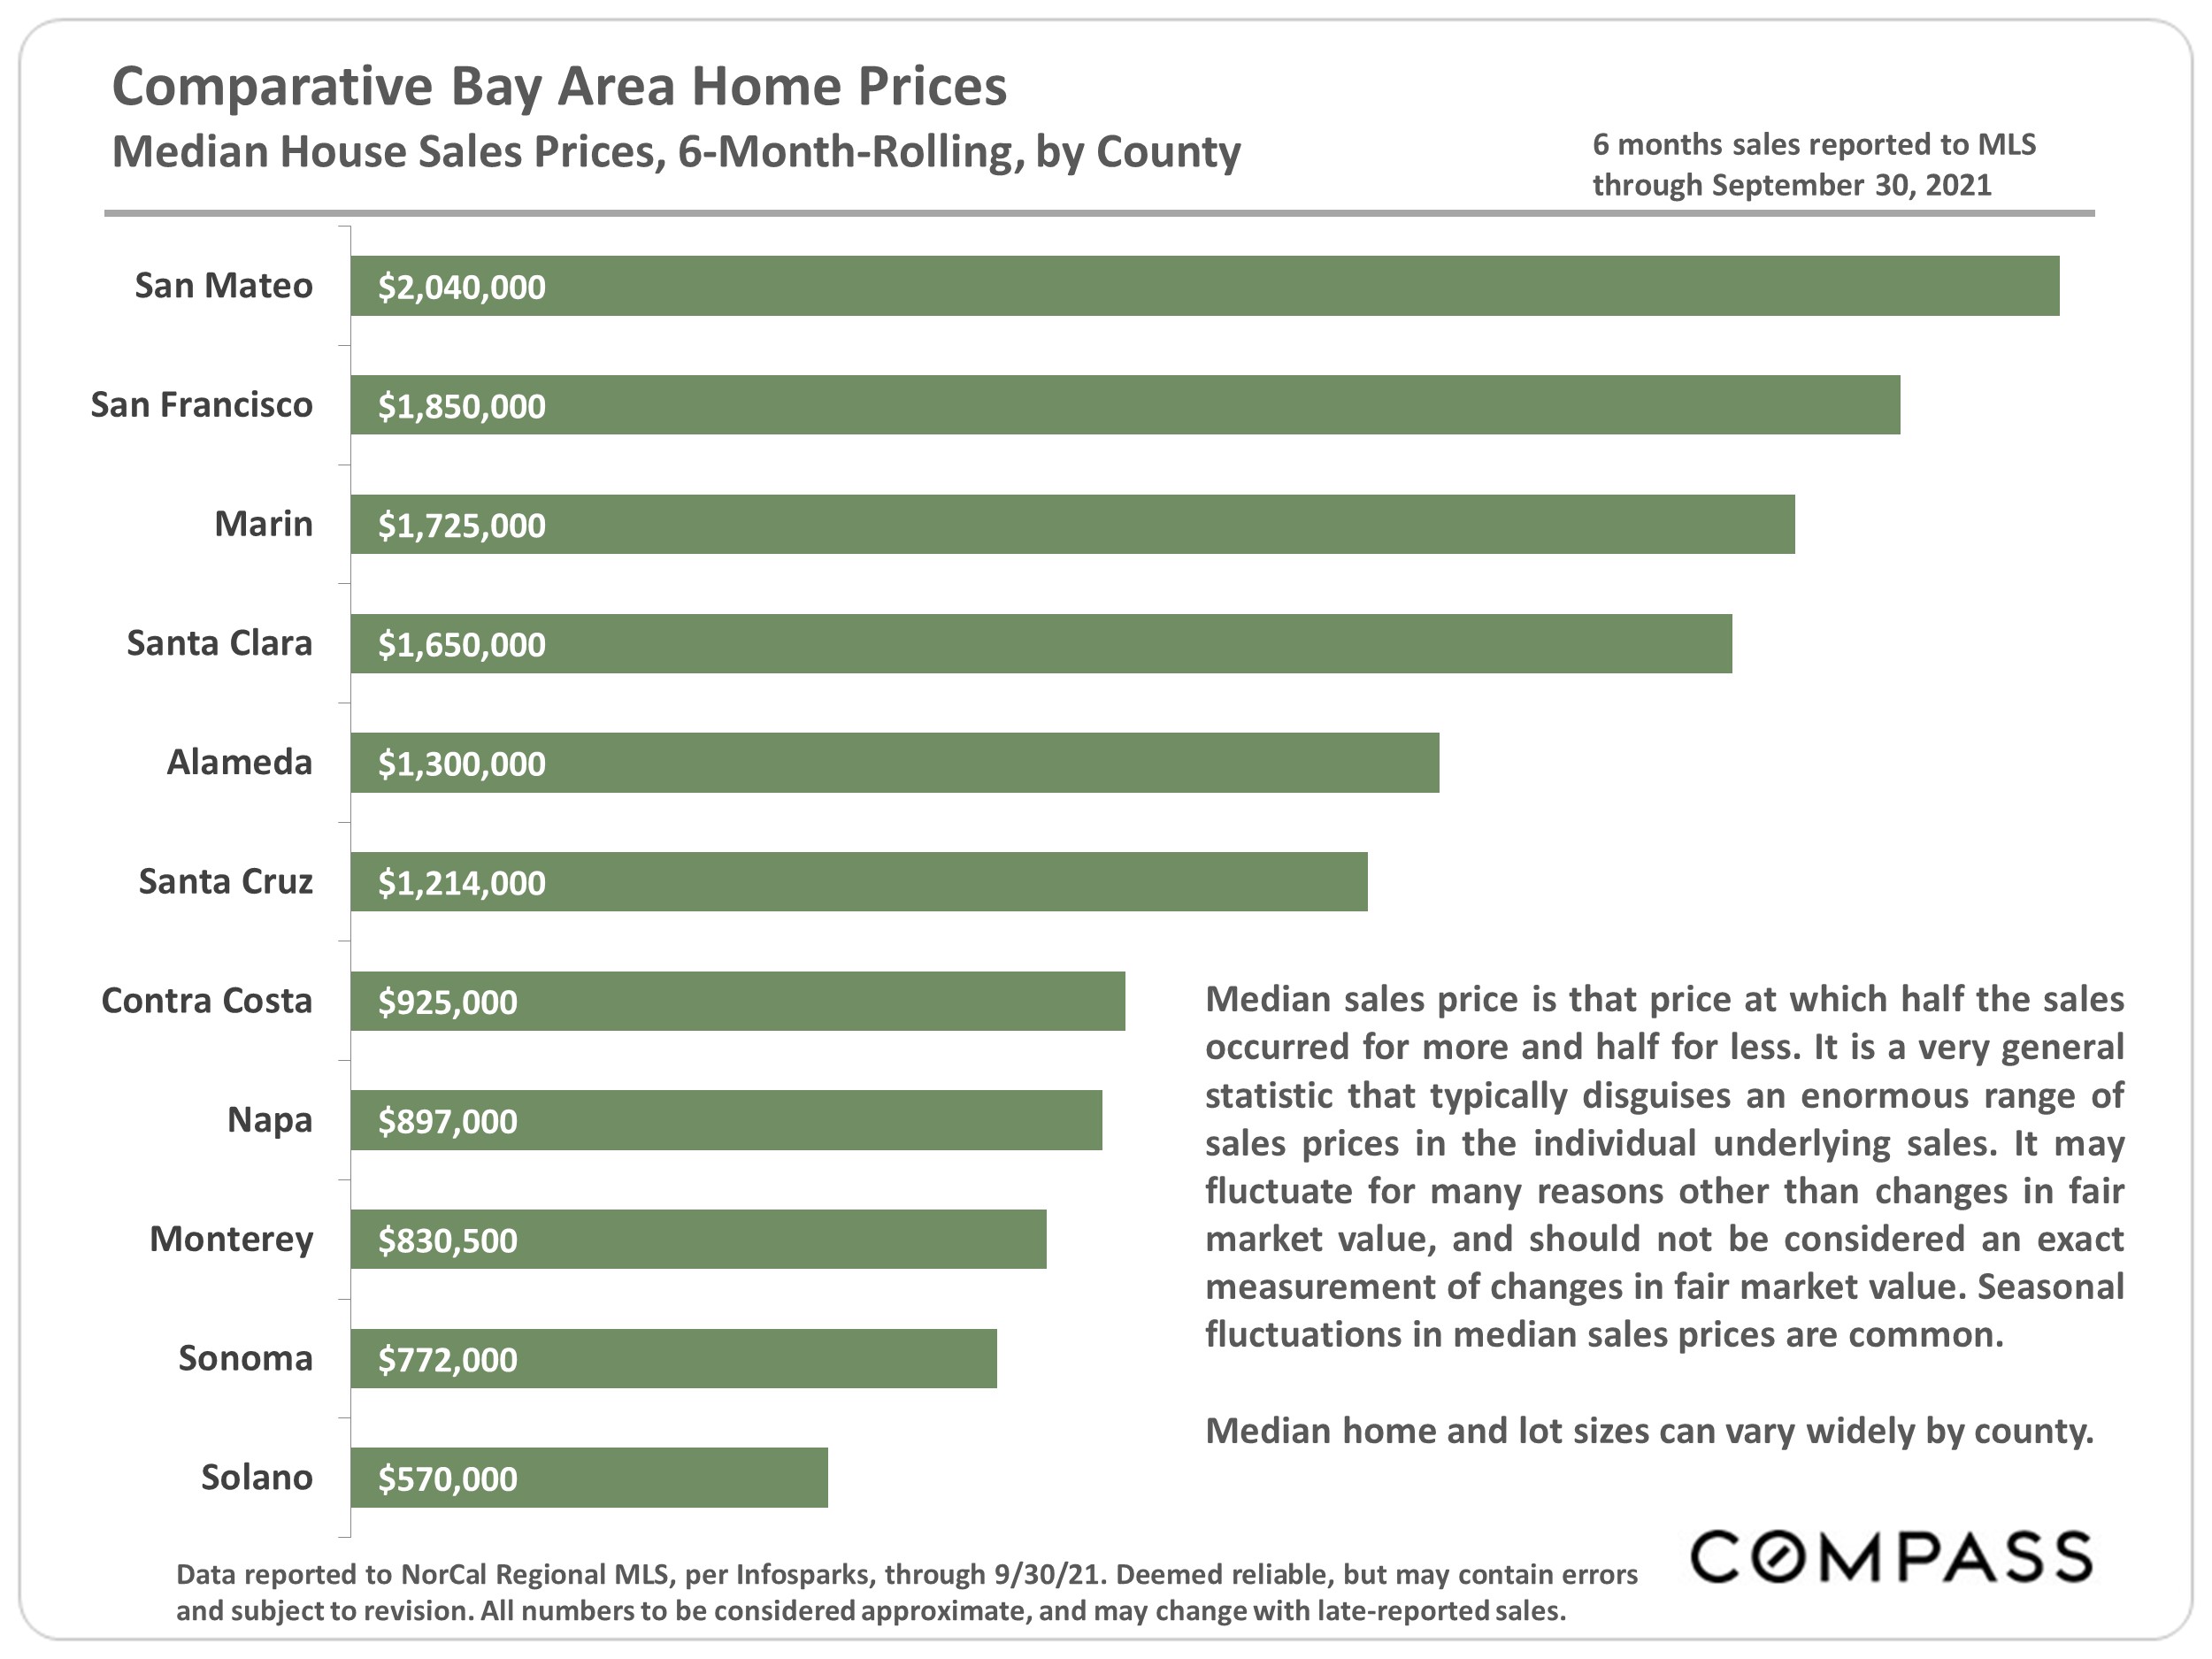
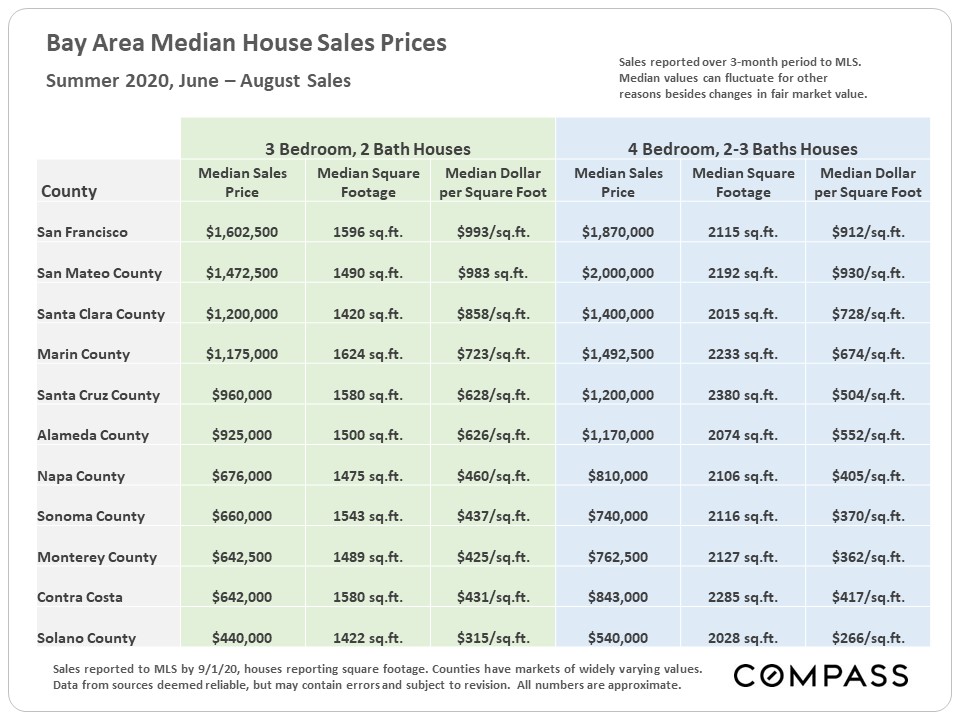
Below is a comparison of median house sales prices, sizes and dollar per square foot values around the Bay Area this past summer.
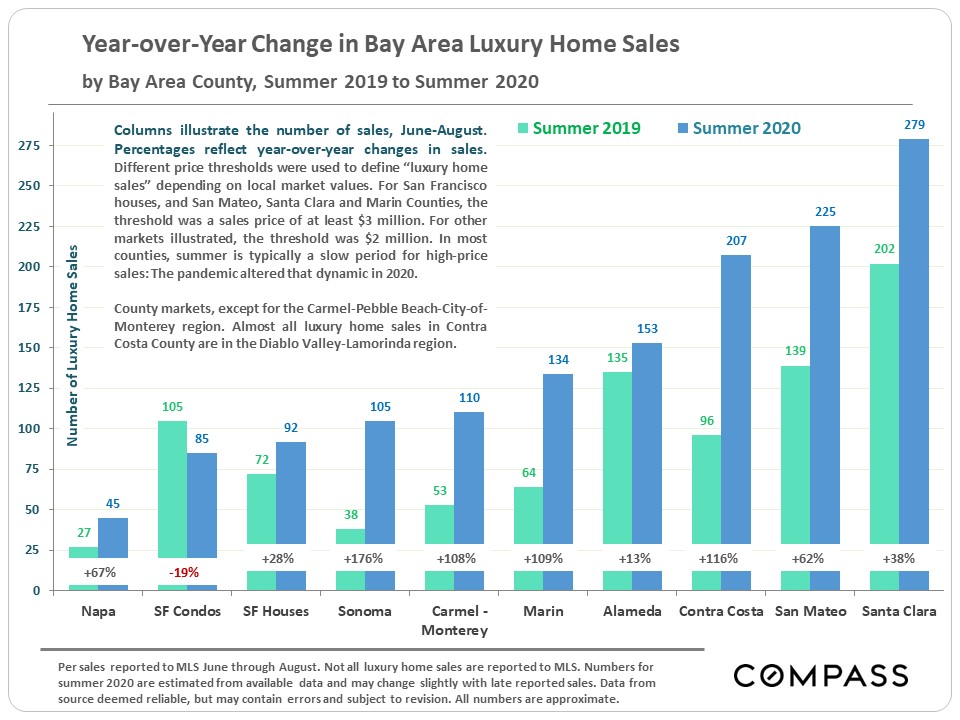
A review of year-over-year changes in the number of luxury home sales around the Bay Area this past summer. Some other counties have seen astounding increases. SF luxury house sales increased by a more modest percentage; SF luxury condo sales declined year over year.
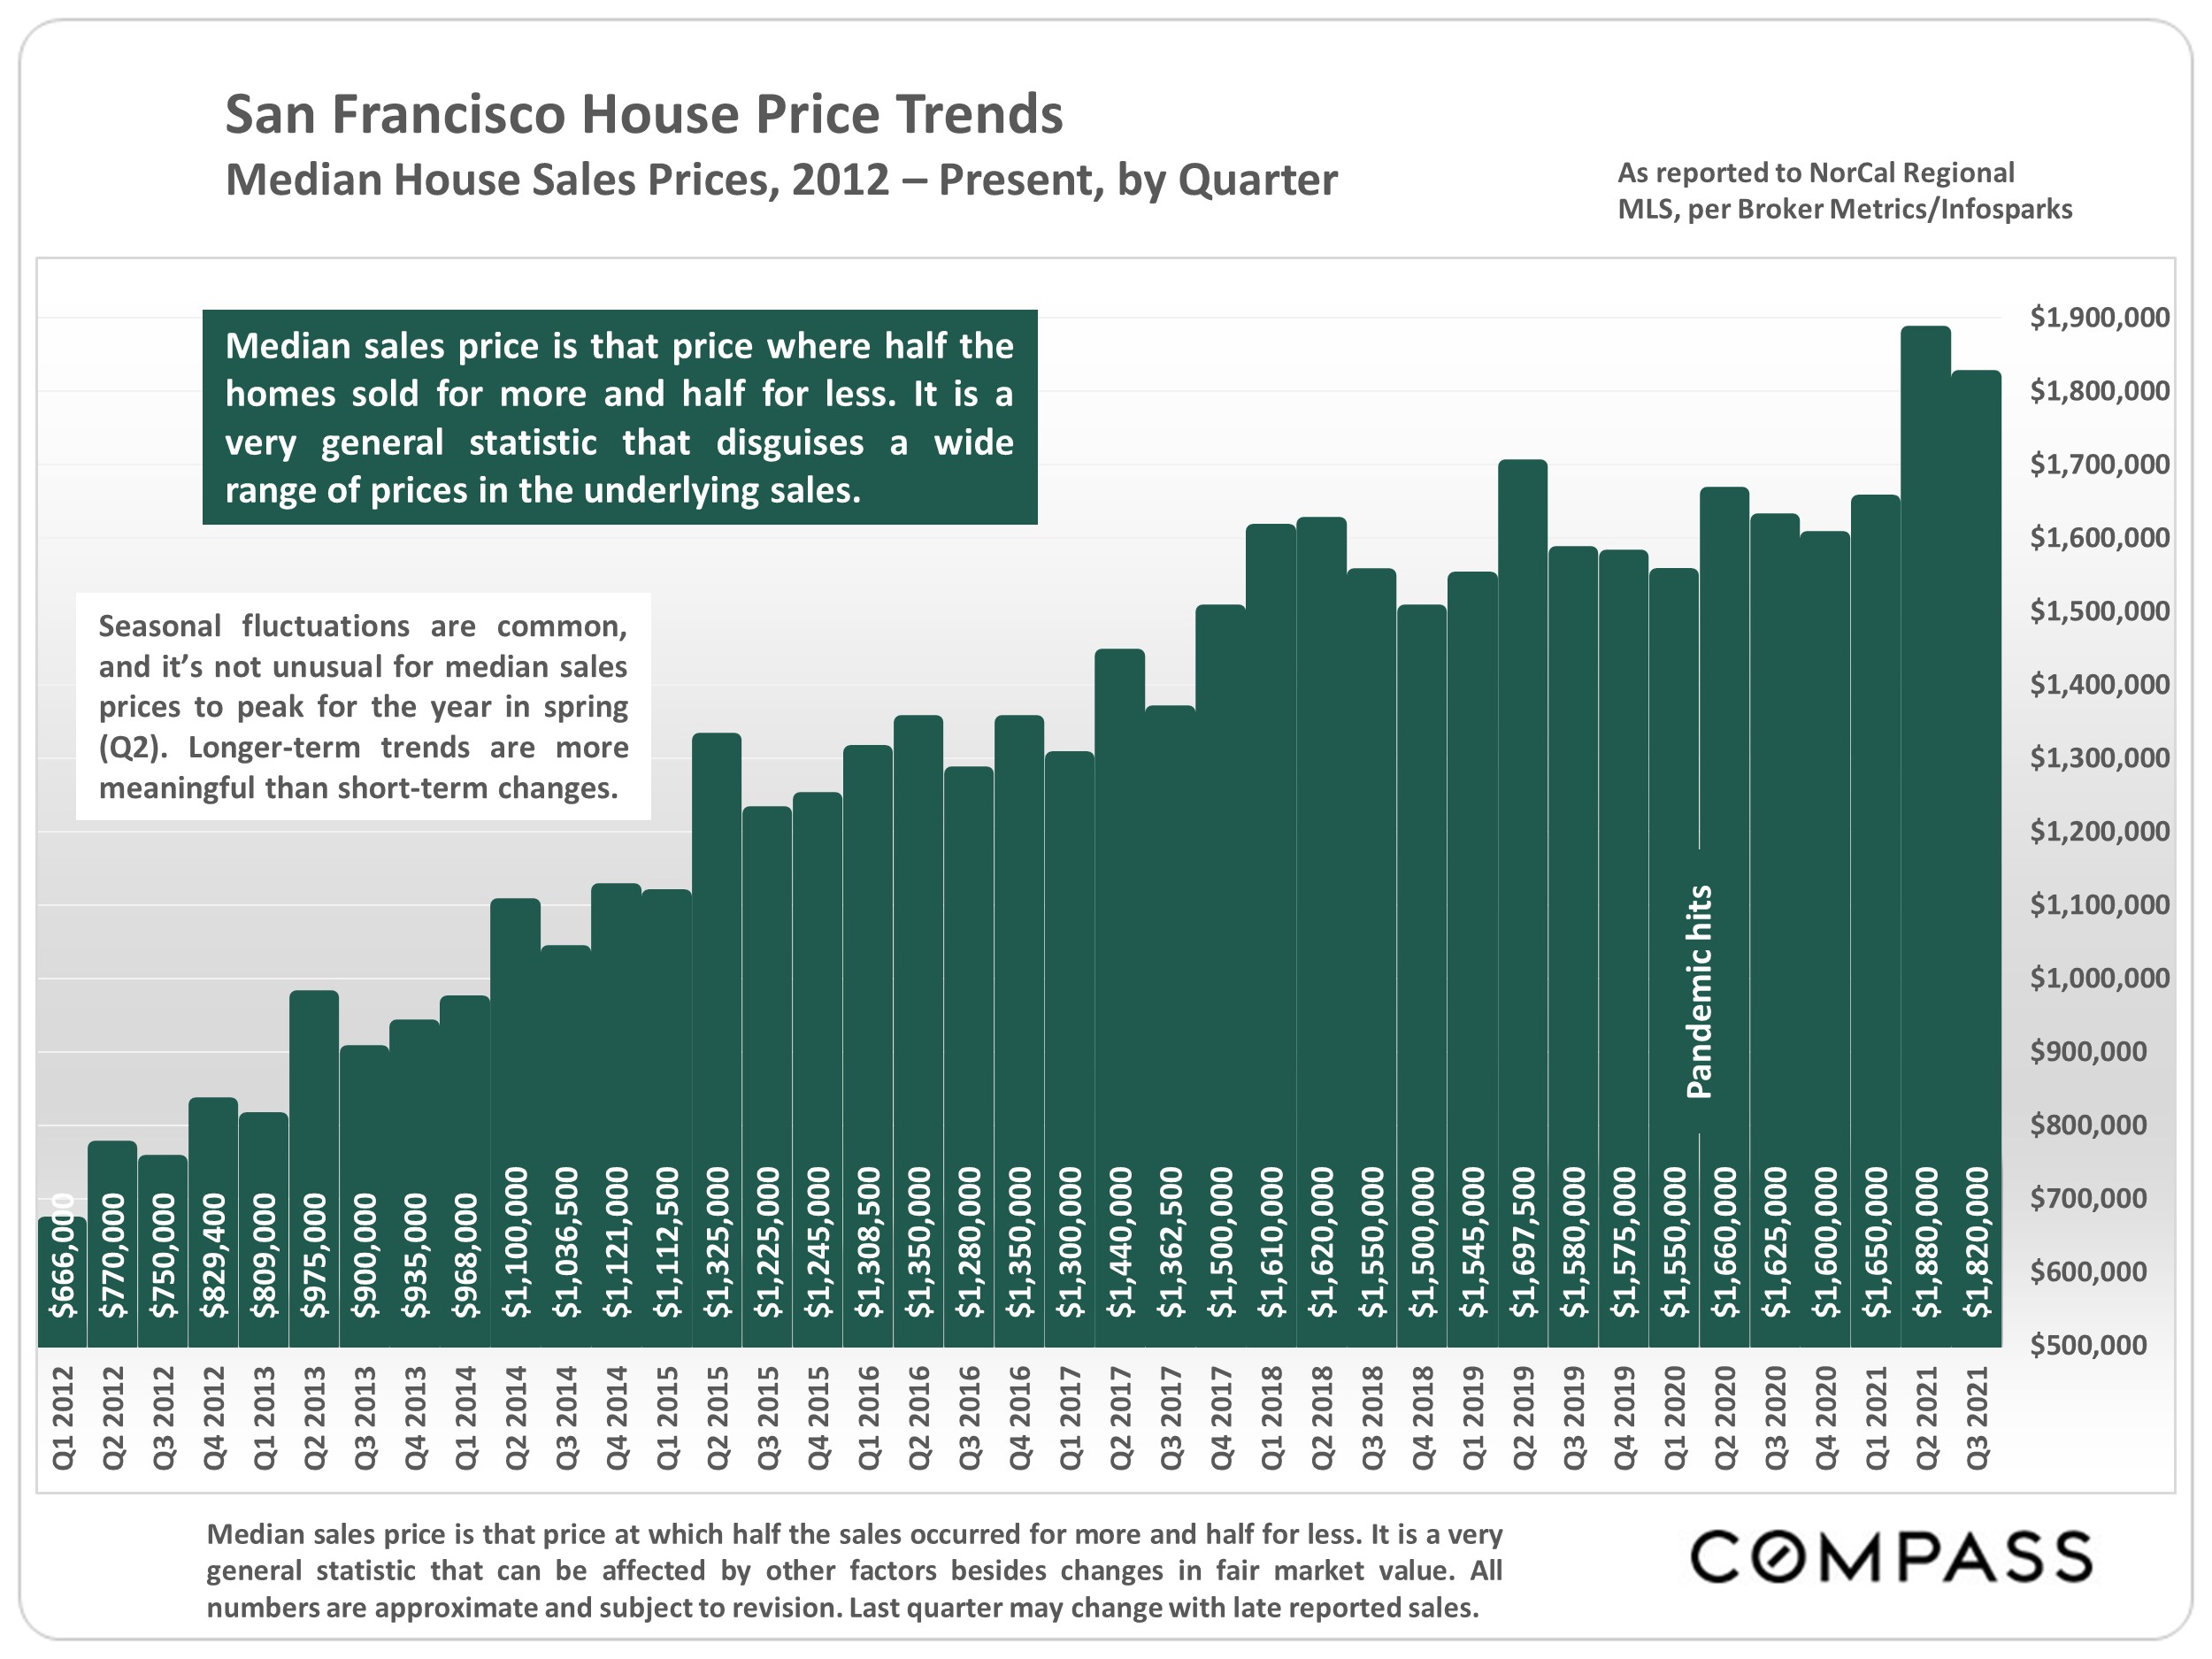
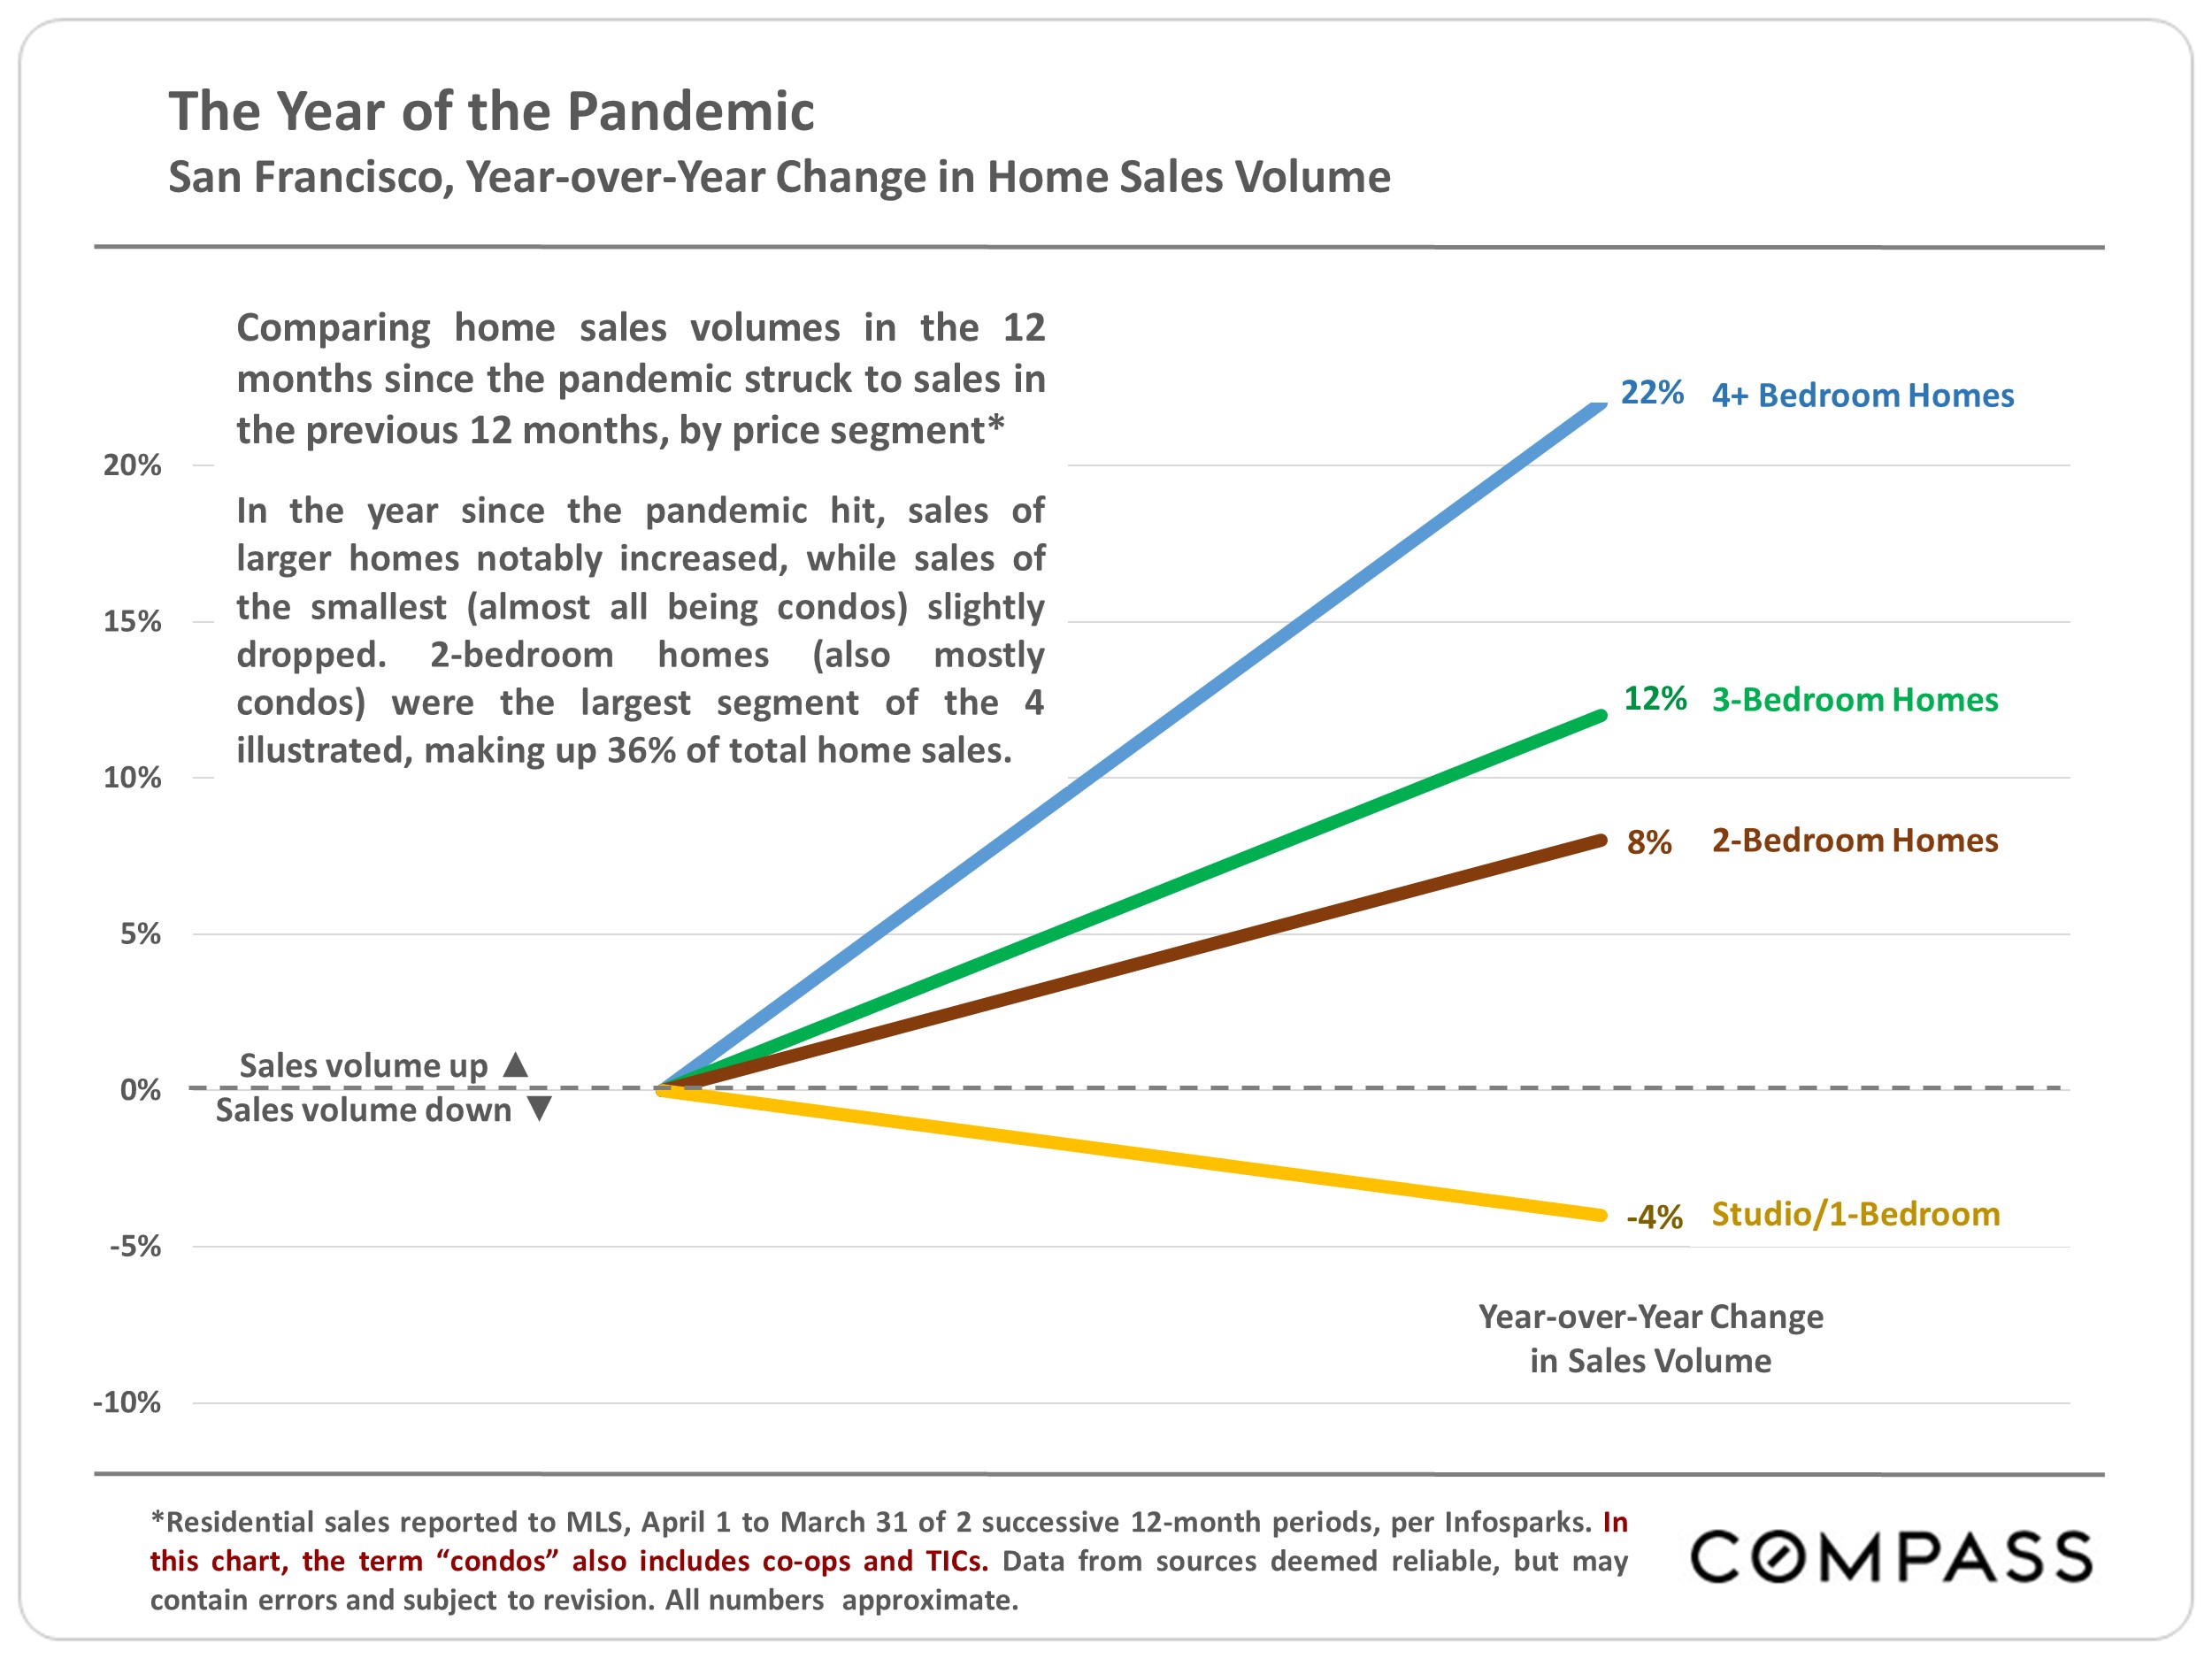
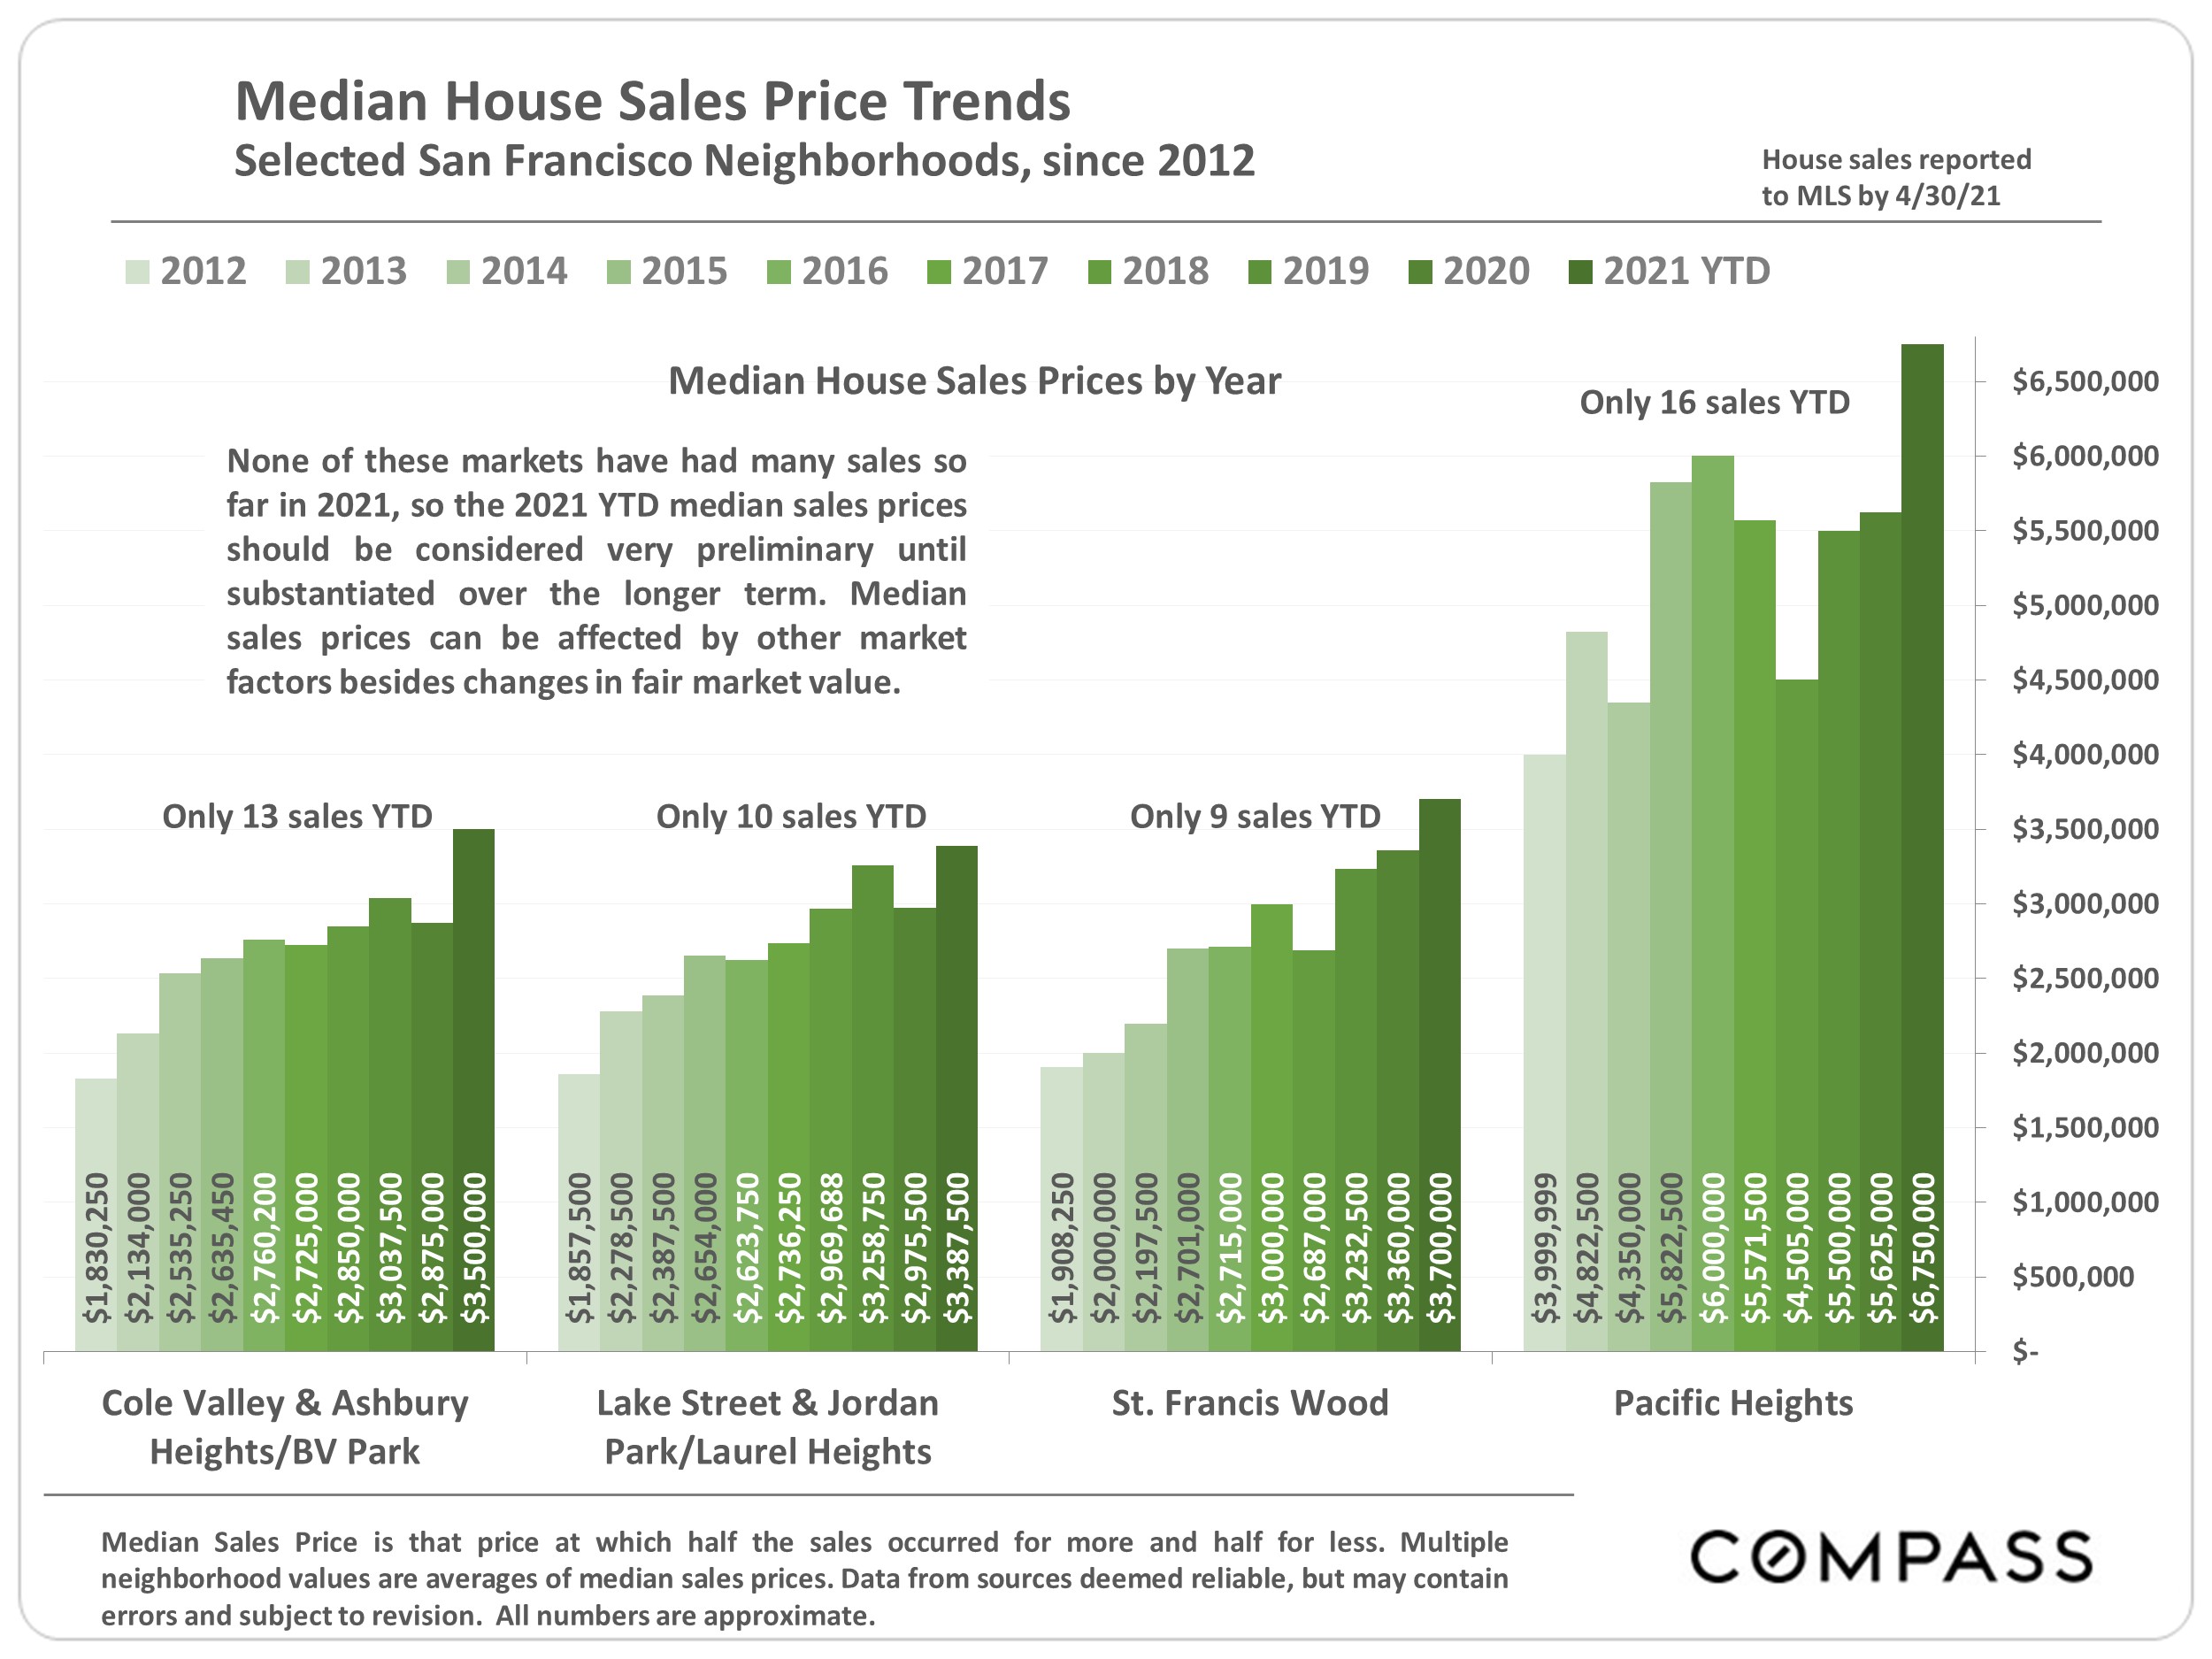
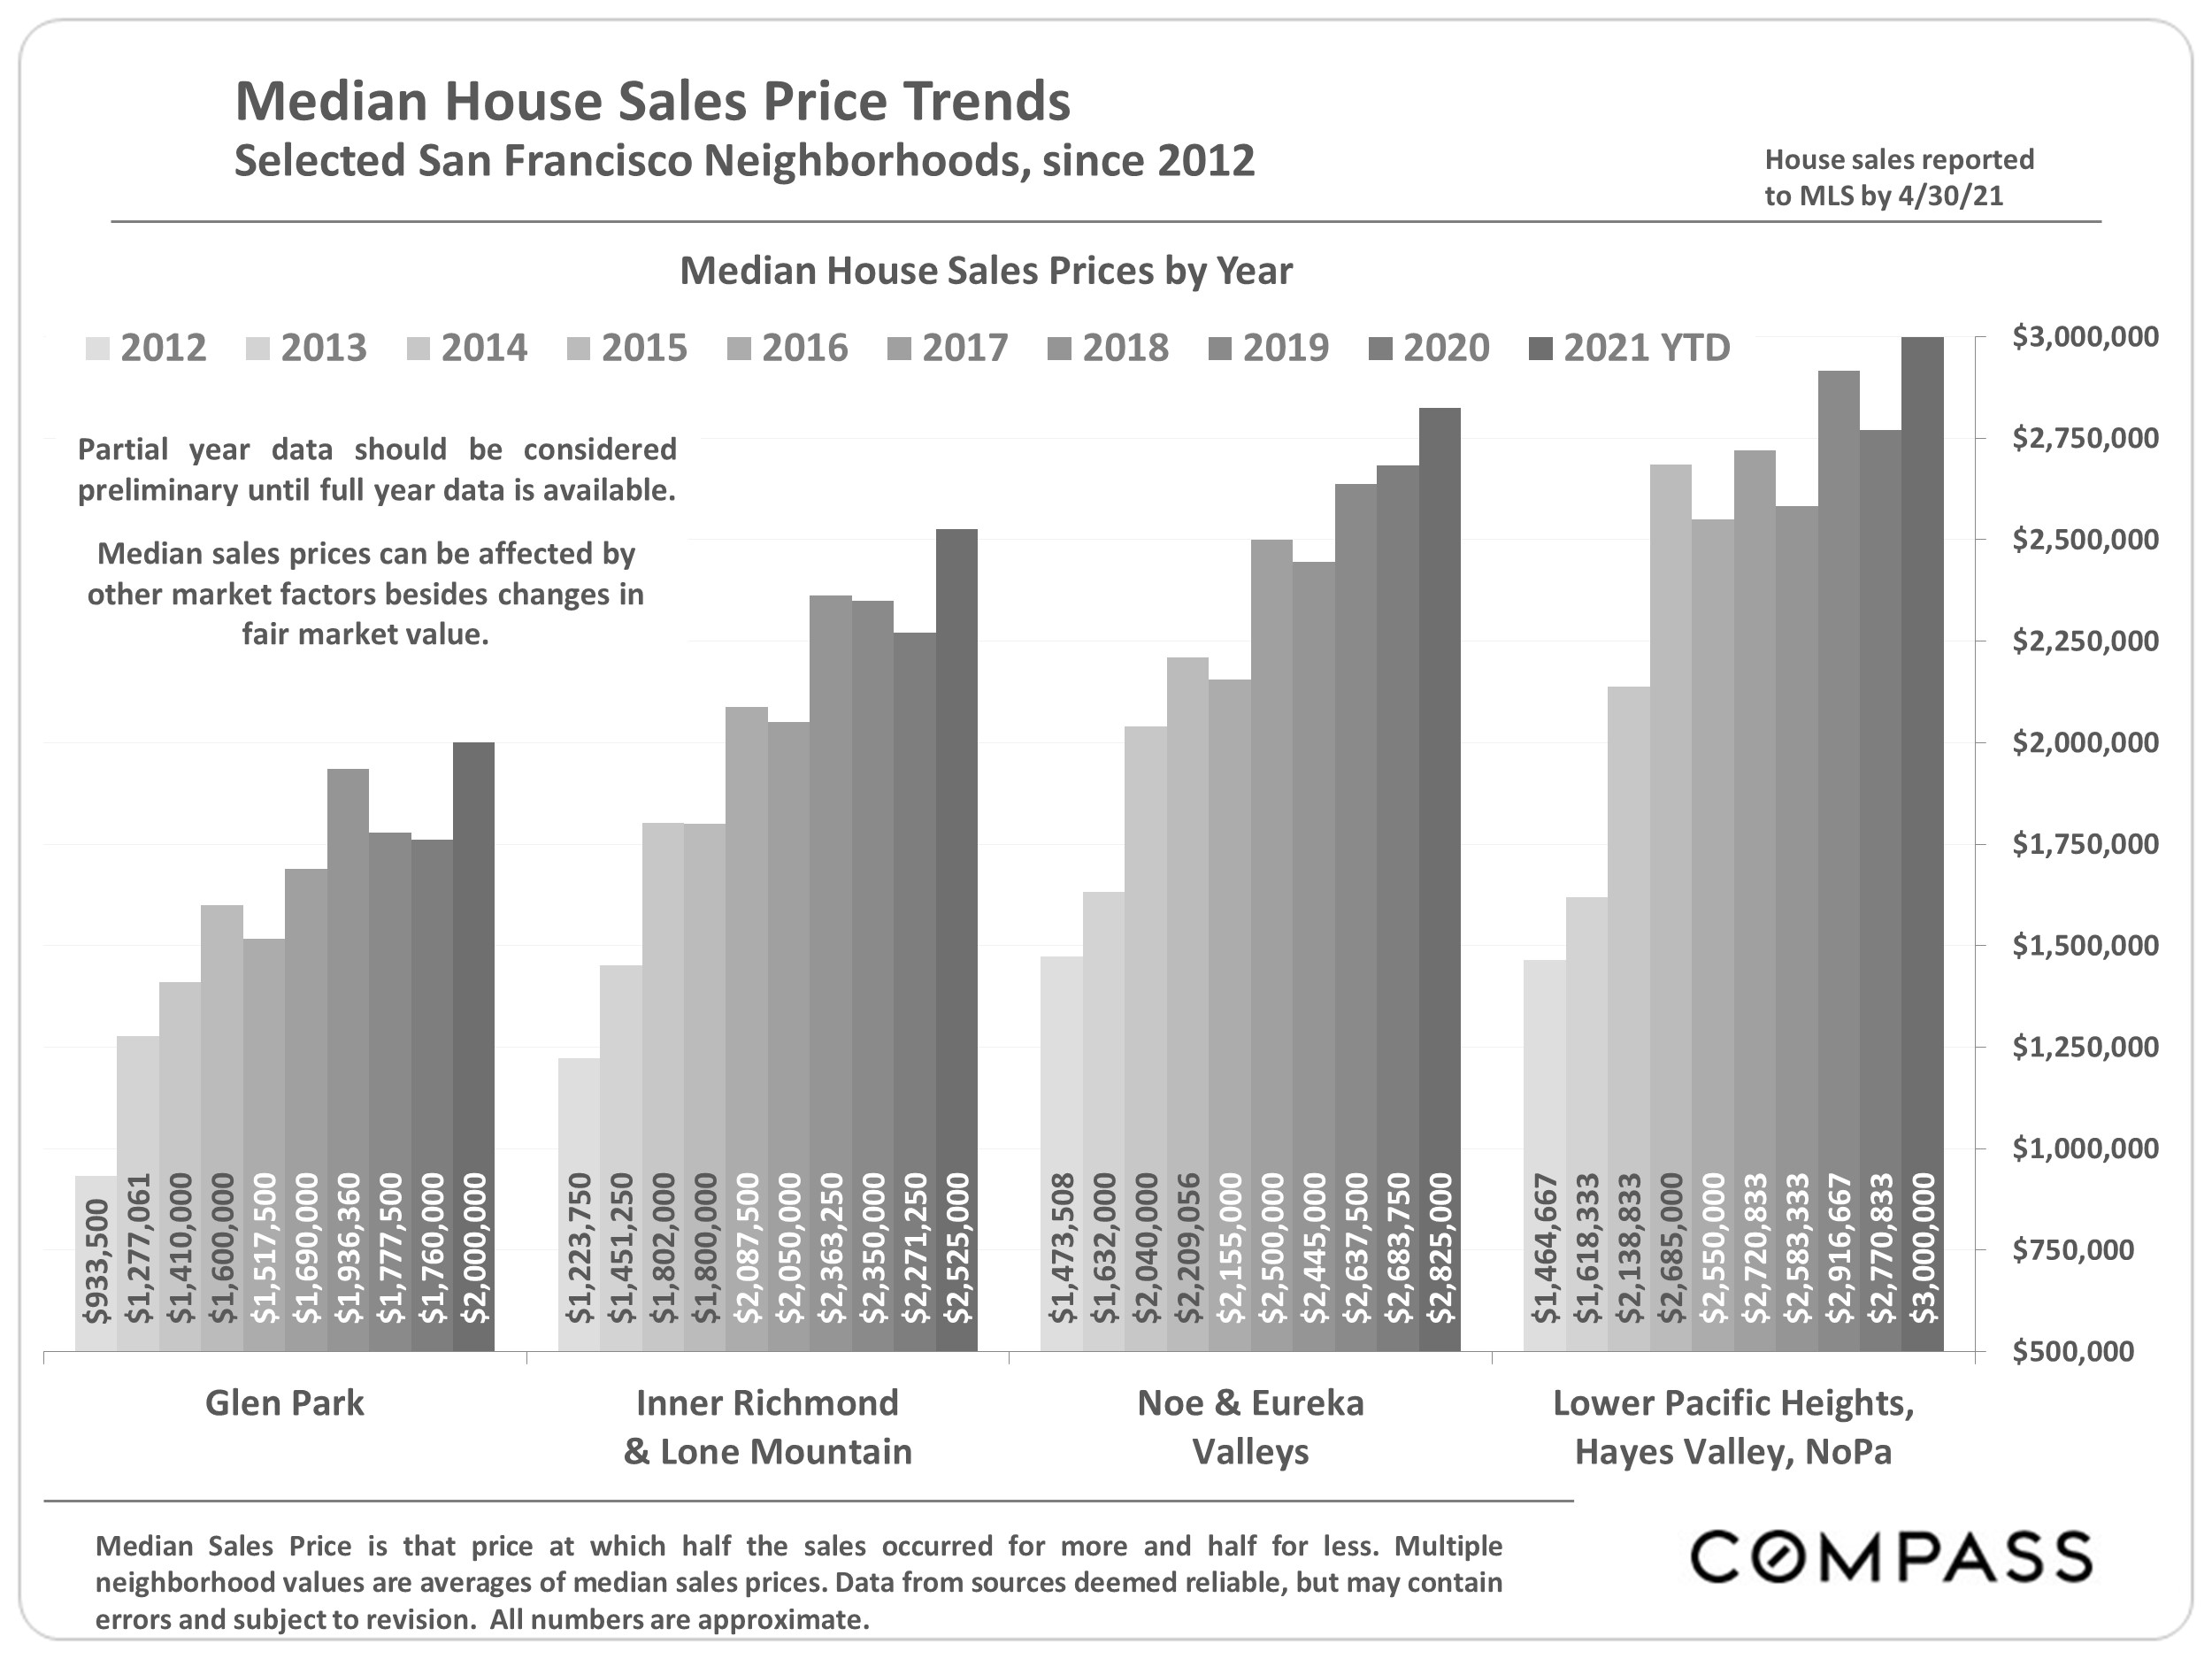
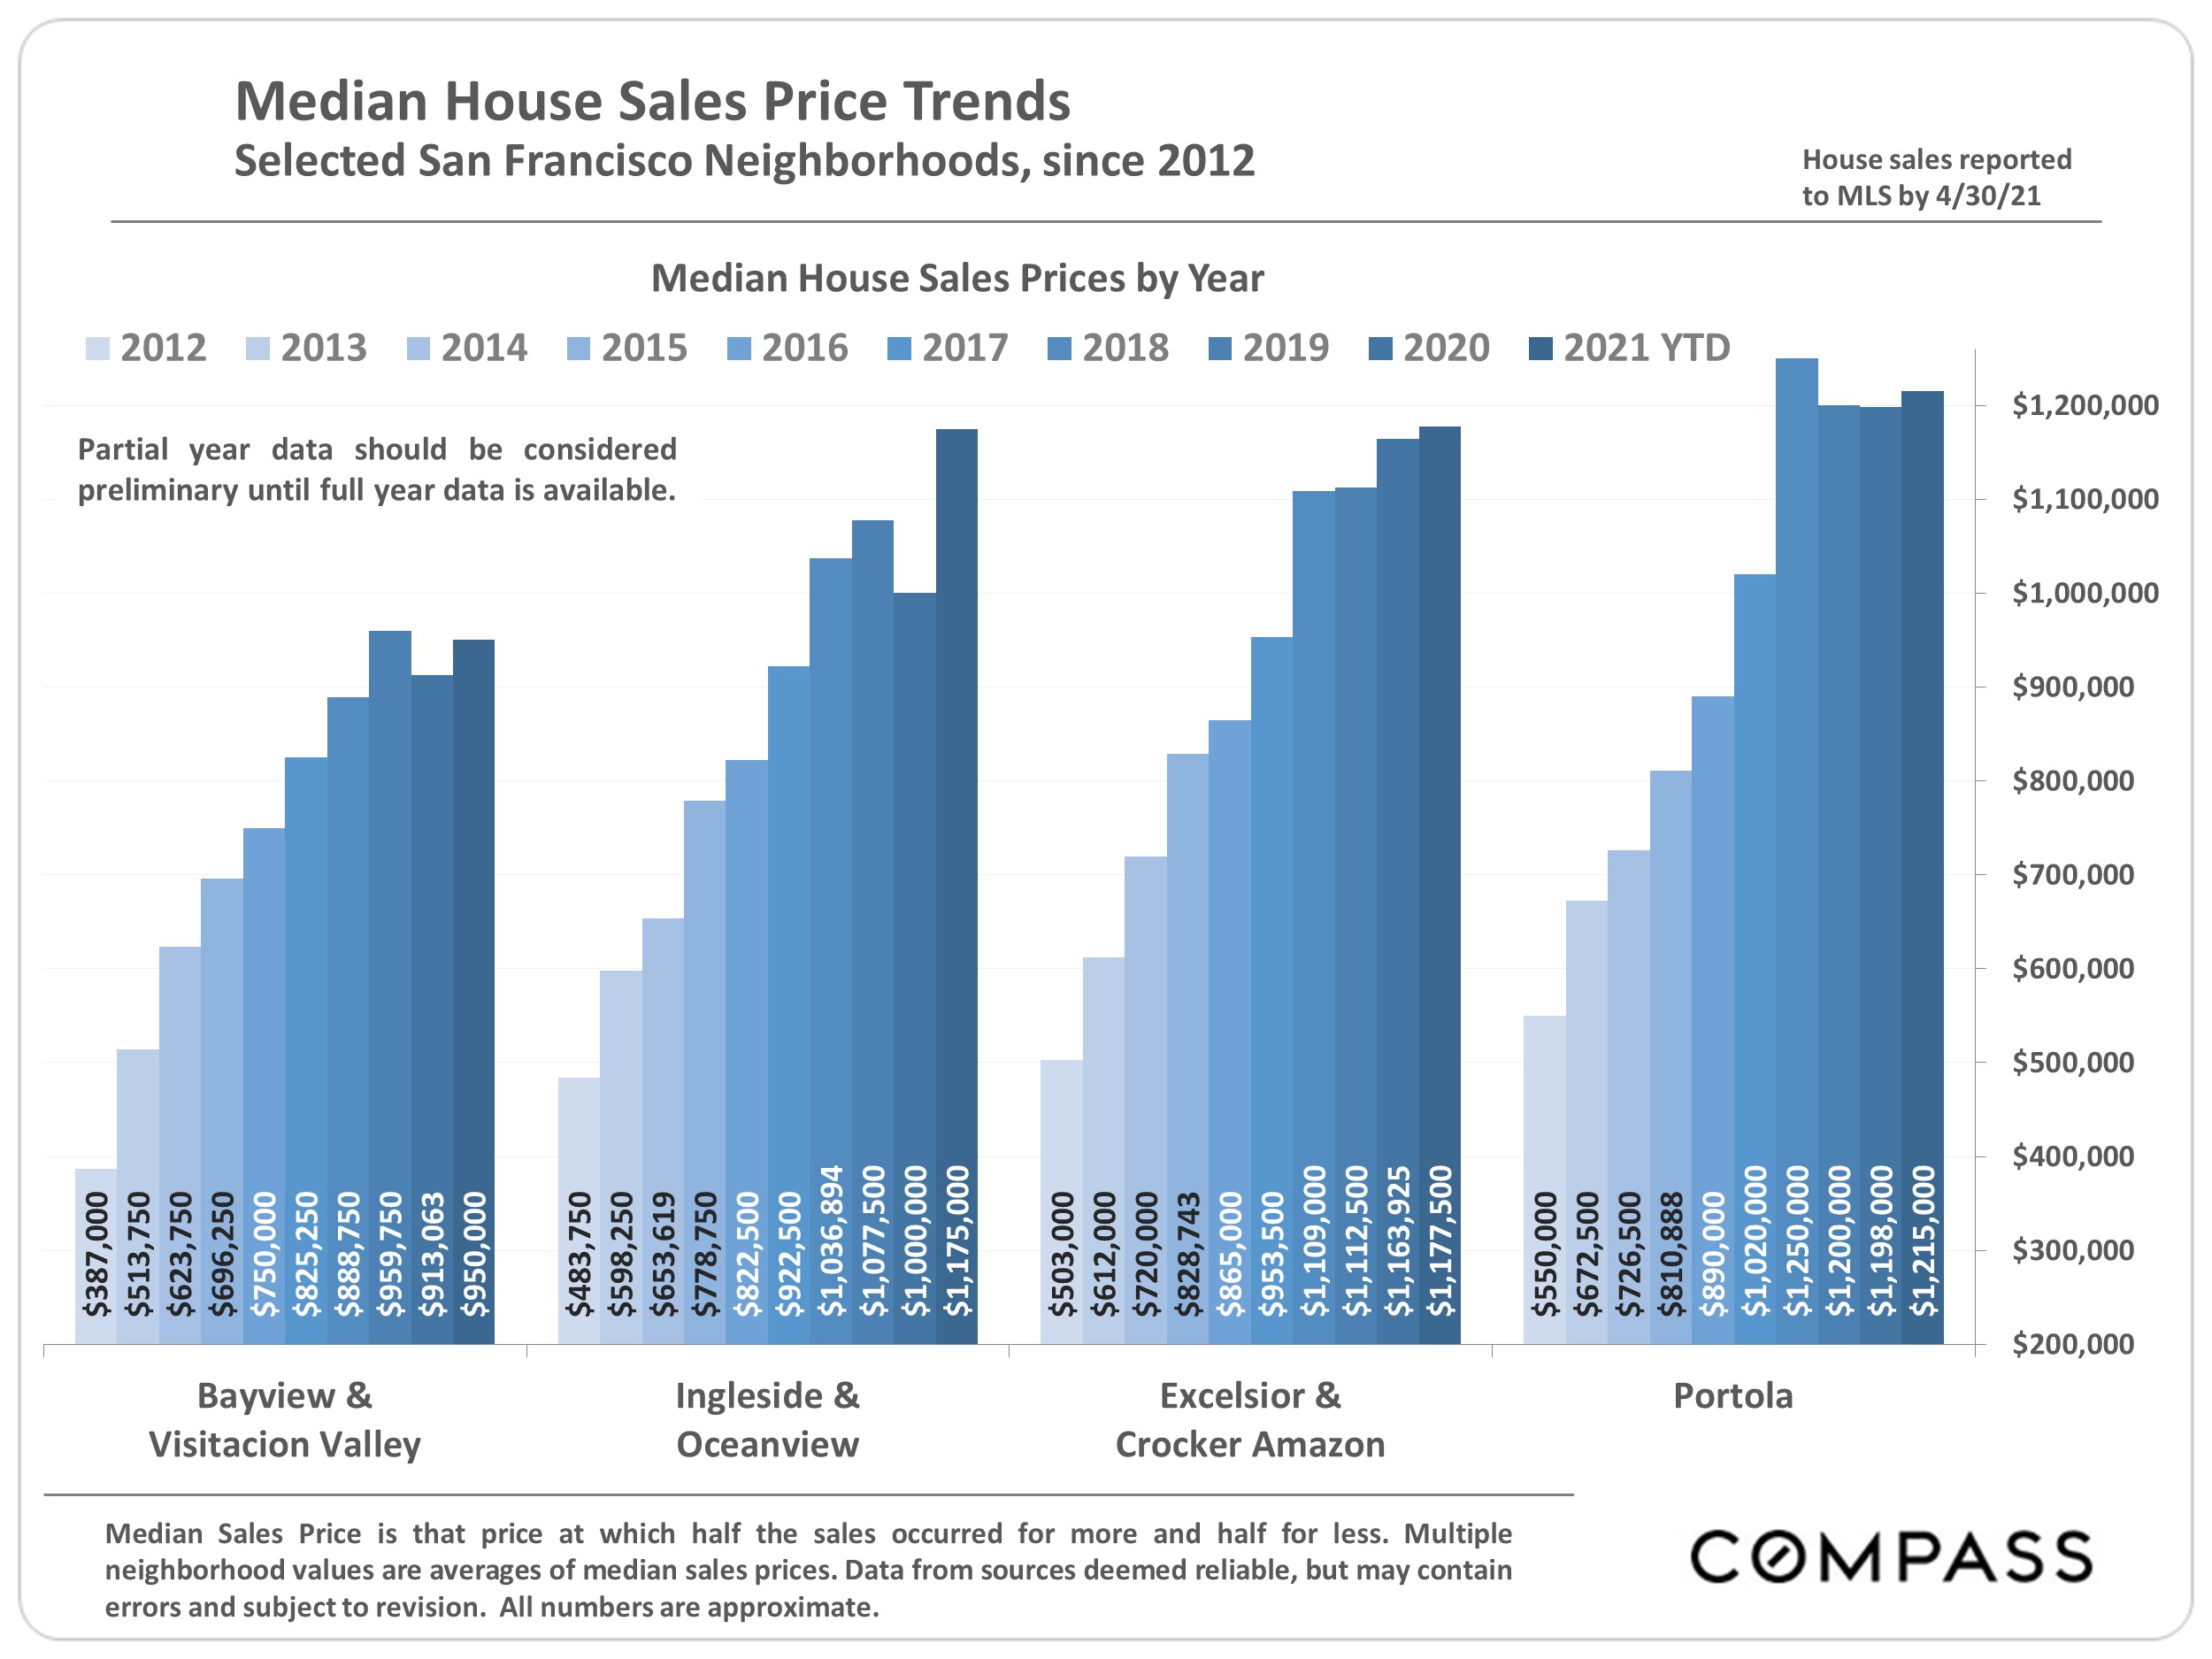
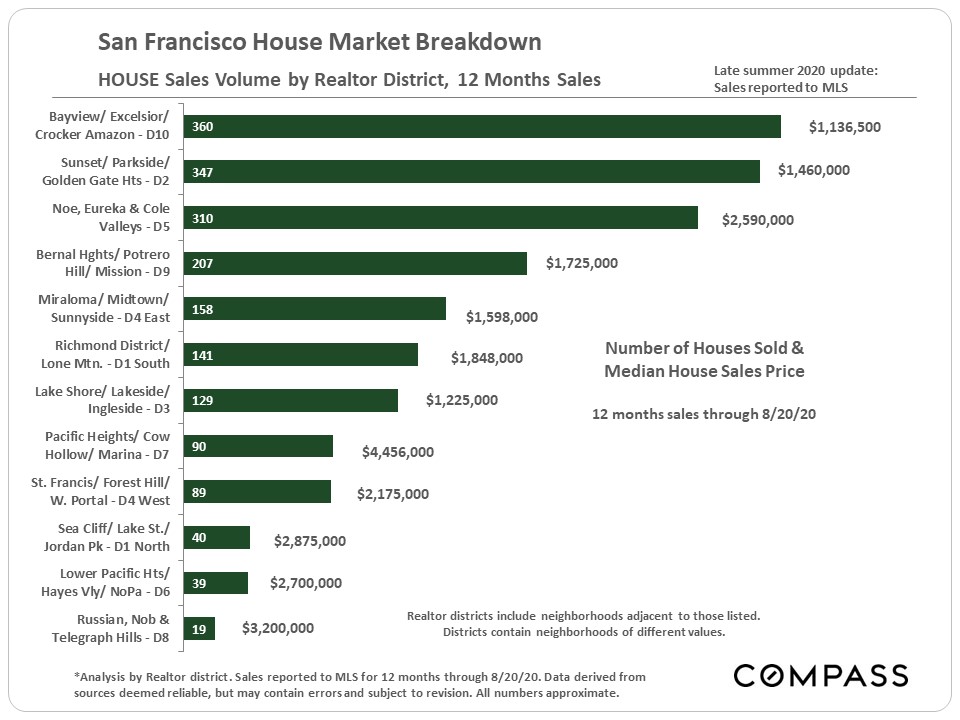
The following 3 charts illustrate aspects of the SF HOUSE market: Median house sales price trends by bedroom count; sales volumes and median sales prices by Realtor district; and the number of active house listings by Realtor district with an analysis of months supply of inventory.
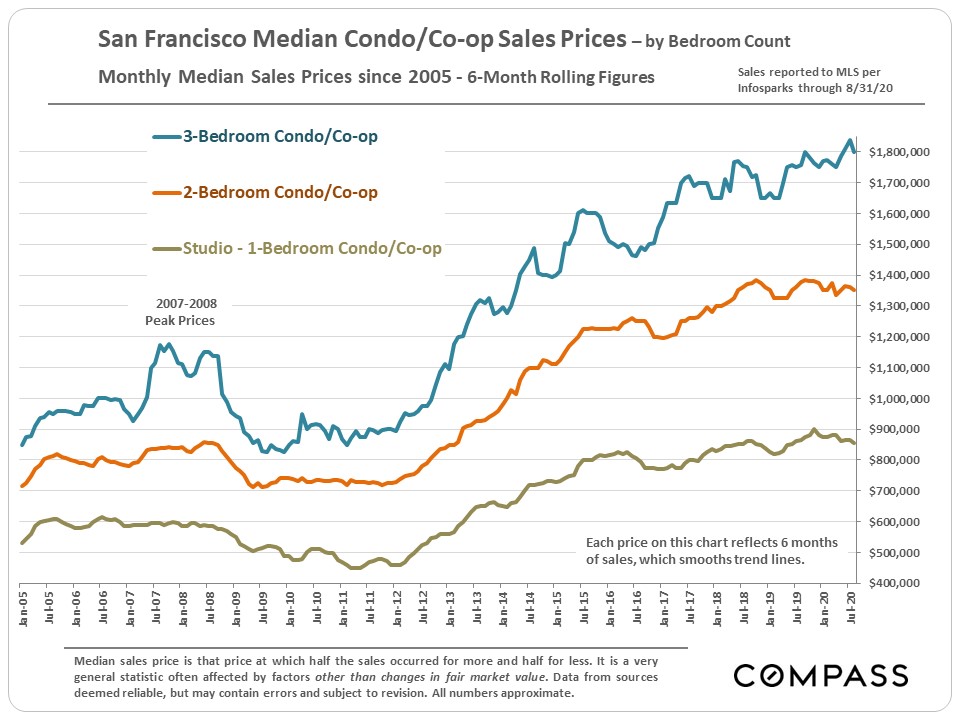
The following 3 charts illustrate aspects of the SF CONDO & CO-OP market: Median sales price trends by bedroom count; sales volumes and median sales prices by Realtor district; and the number of active listings by Realtor district with an analysis of months supply of inventory.
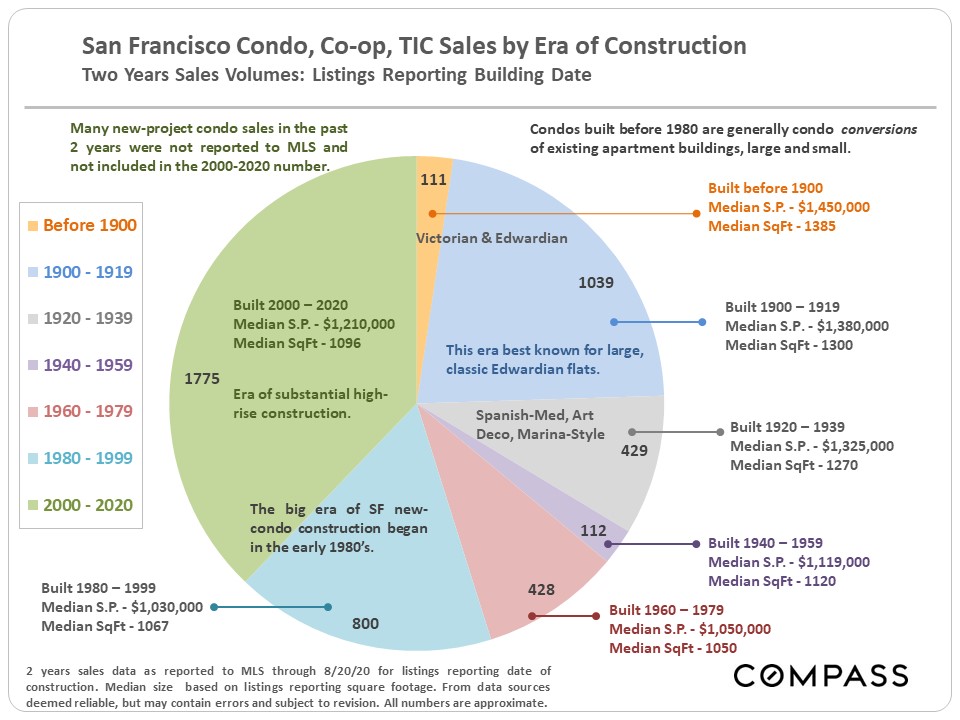
In last month's report, we looked at era of construction for the city's houses. The chart below does the same for the SF condo, co-op and TIC market.
Pota's Listing Corner
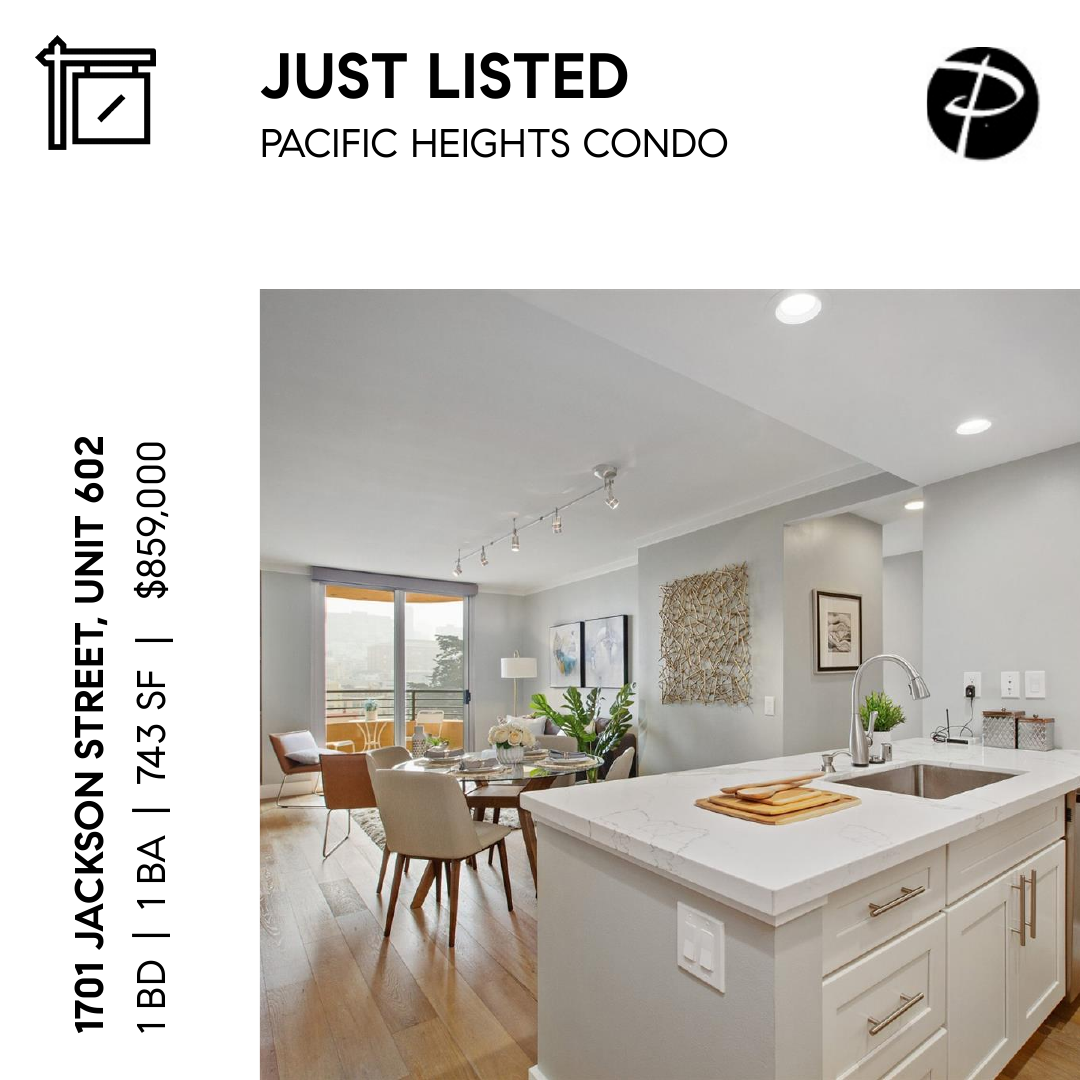
Just Listed
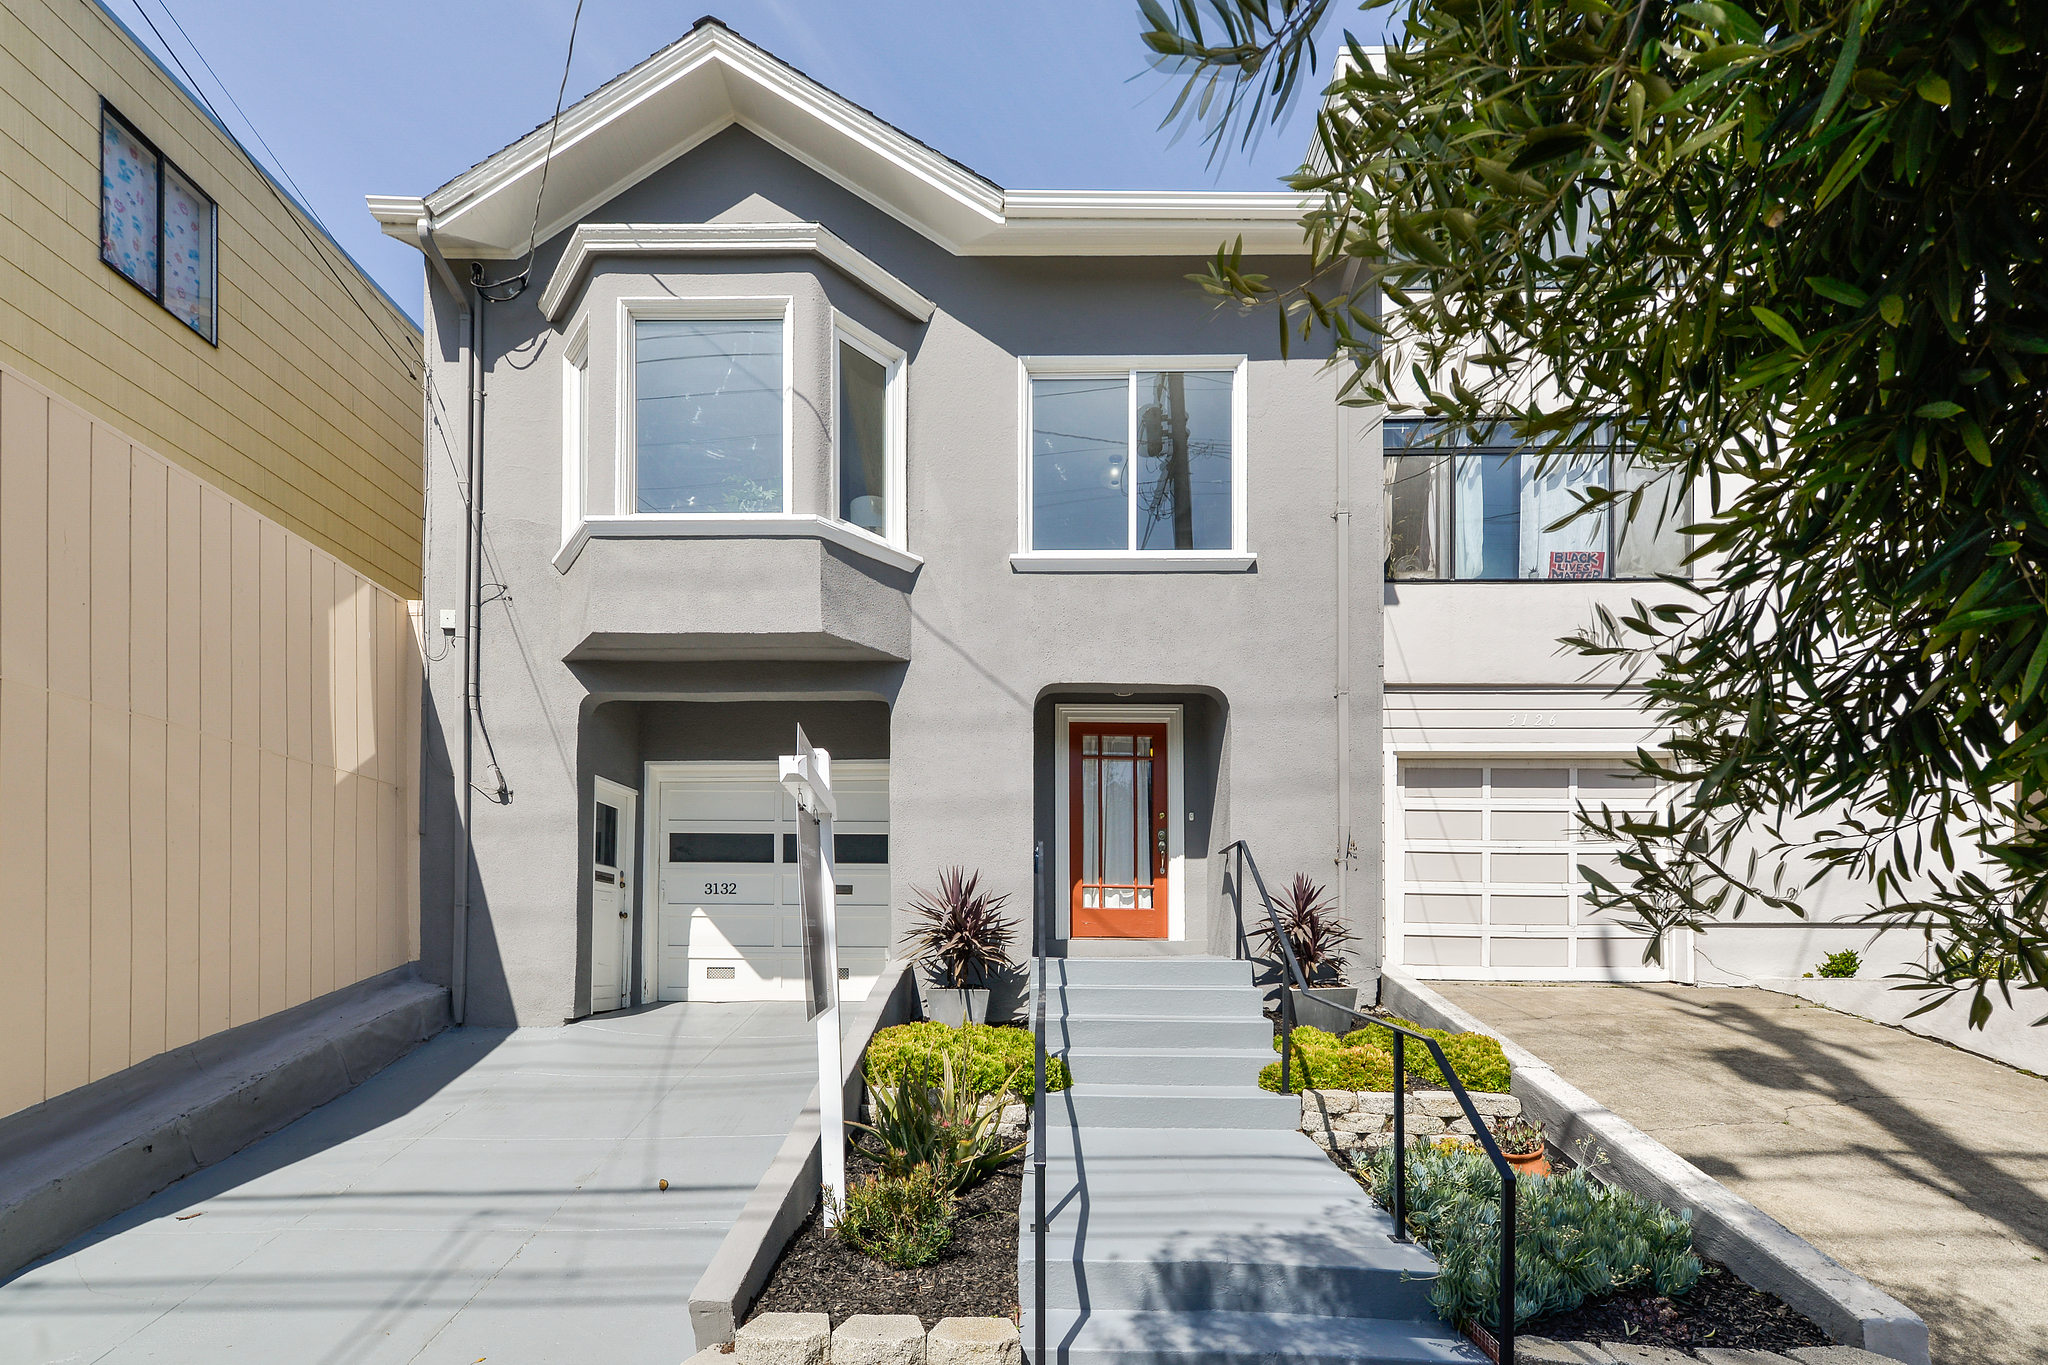
3132 Balboa Street
$1,535,000
Gorgeous period details; bay window, fireplace, hardwood floors throughout. Enjoy a family meal in the formal dining room, or opt for dining alfresco style on the deck or garden, both directly accessed from the kitchen. The wide and functional interior foyer has direct access to the garage & the stairs up to the main living areas. The bath upstairs was recently remodeled, and custom built-ins were added to the primary bedroom for additional storage and closet space. The 1 car garage has a w/d. Close to Balboa Village.
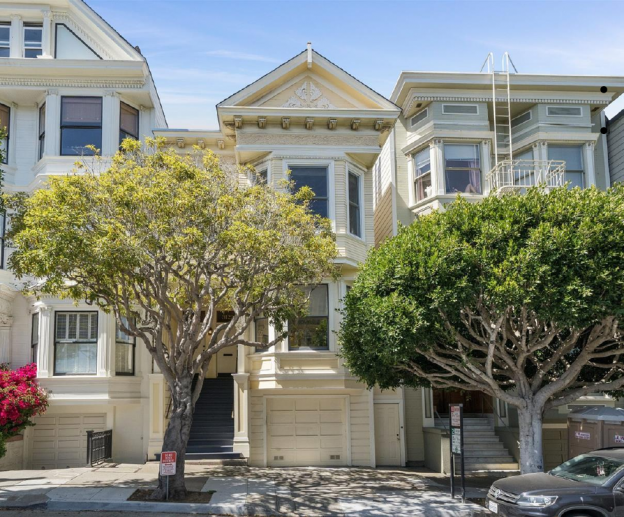
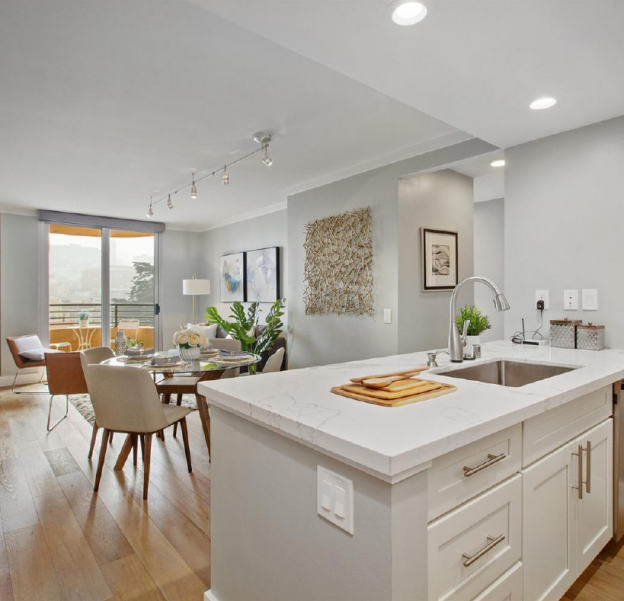
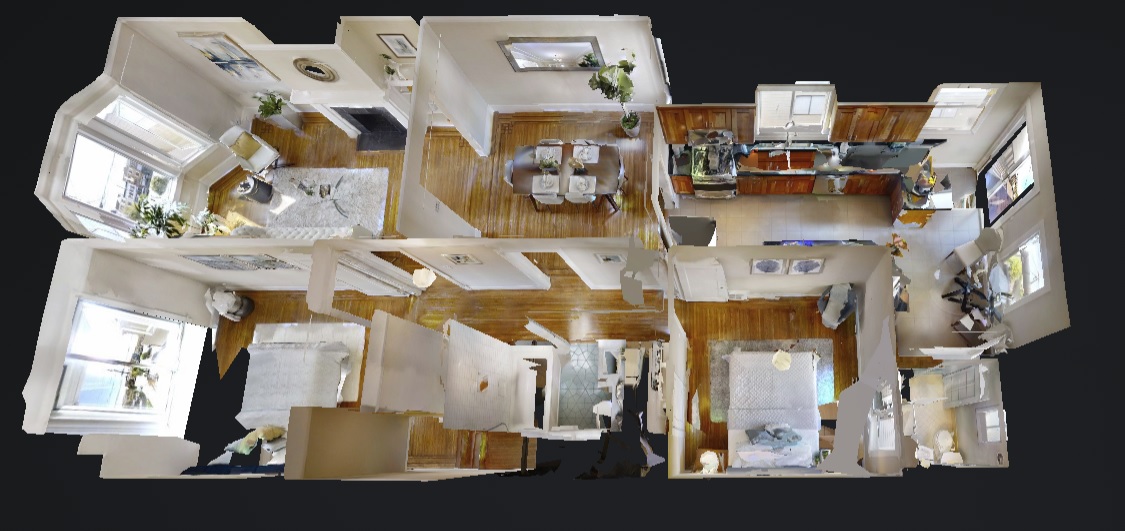
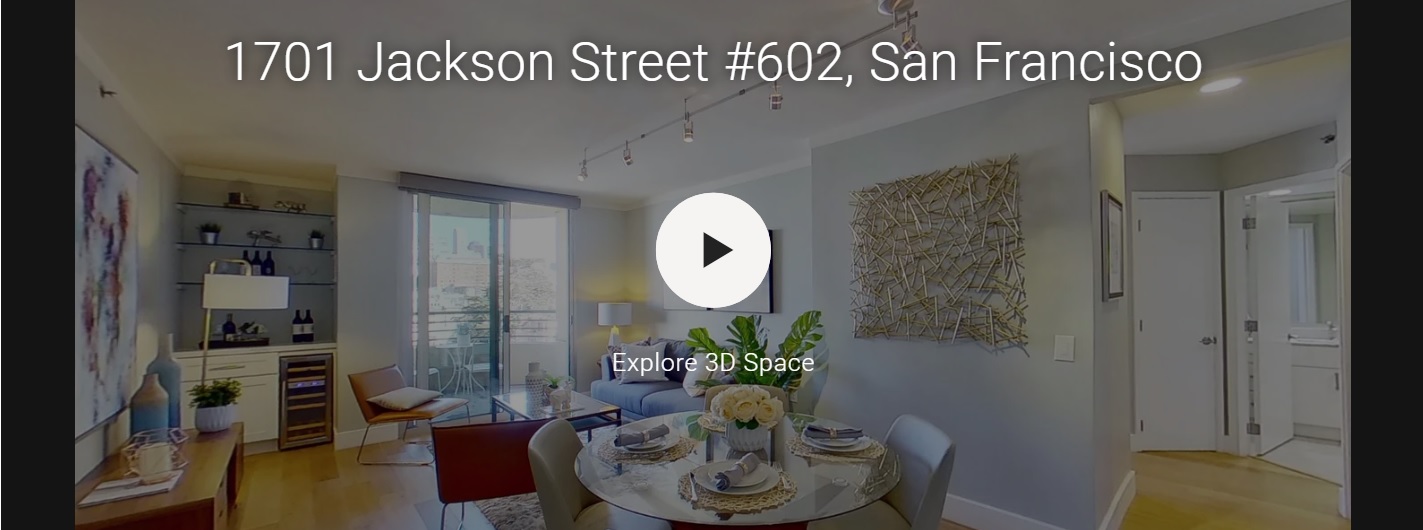
Luxury VIEW condo with private balcony – rarely available – thoughtful and tasteful remodeled kitchen, bath, bar area and wide planked flooring are perfect for the discerning buyer that wants a turnkey property. Den/office area, storage, walk-in closet, convenient in-unit washer & dryer and 1 car parking complete this bright, open and spacious residence at Pacific Heights' most coveted buildings, Pacific Place. Living/dining open concept floor plan designed to be inviting and have a nice flow from room to room. Unit includes a deeded parking & storage. Luxury amenities include a heated pool & spa, a beautiful common garden and a gym. Elevator building w/24 hour security. One car parking and additional storage. Excellent location! Walk to Whole Foods, Lafayette Park and dozens of restaurants and cafes on Polk and Union St. City living at its best – this checks all of the boxes. Call to schedule an appointment.
Compass is a real estate broker licensed by the State of California operating under
multiple entities. License Numbers 01991628, 1527235, 1527365, 1356742, 1443761, 1997075,
1935359, 1961027, 1842987, 1869607, 1866771, 1527205, 1079009, 1272467. All material presented
herein is intended for informational purposes only and is compiled from sources deemed reliable
but has not been verified. Changes in price, condition, sale or withdrawal may be made without
notice. No statement is made as to accuracy of any description. All measurements and square
footage are approximate. Equal Housing Opportunity.
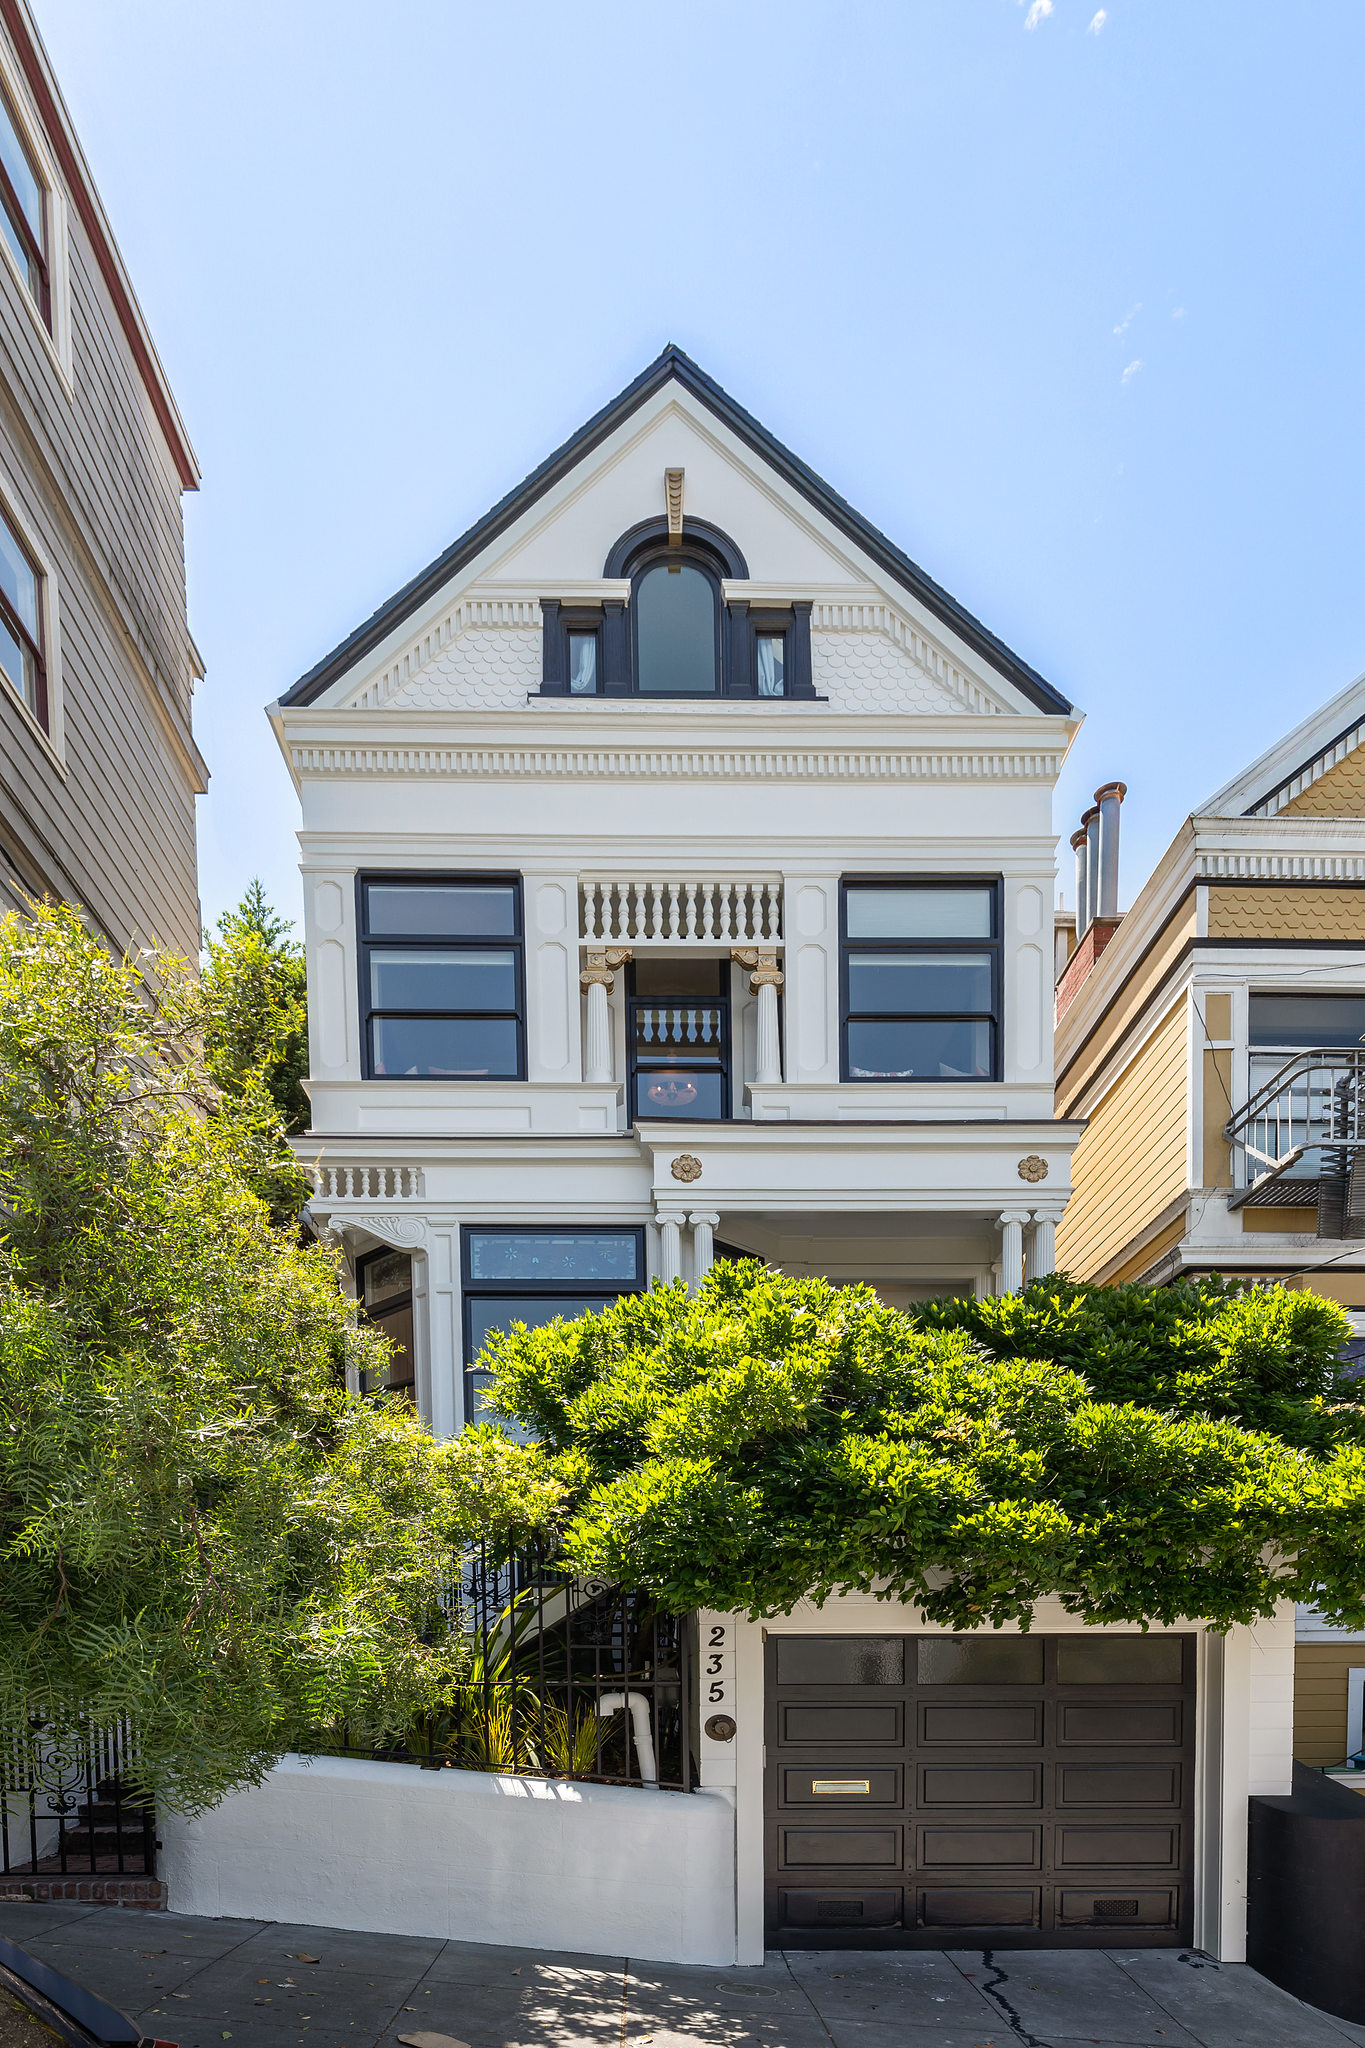
It's Opening Day
for this Grande Dame Queen Anne who takes center stage once again. Best
known for her classic role as the 2014 San
Francisco DREAM HOUSE with its innovative architecture, its
exquisite beauty, and eco-conscious design. Now her elegant and modern
new look cannot be missed – it€™s easy to understand why she€™s once
again the talk of the town in the Buena Vista North Historic
neighborhood.
This historic gem was extensively and thoughtfully renovated
honoring the past while transforming it for modern day living
with LEED Certification, custom finishes, high-end appliances
and artfully selected materials. Centrally situated between NOPA
and Haight Ashbury. This spacious residence, with four floors of
living space offers incredible versatility.
Dramatic ceiling height, natural light, warmth and flexibility
grace this 6-bedrooms, 4.5 bath home with indoor, outdoor living
space, solar panels, radiant heating and 3 car garage.
Compass is a
real estate broker licensed by the State of California
operating under
multiple entities. License Numbers 01991628, 1527235,
1527365, 1356742, 1443761, 1997075,
1935359, 1961027, 1842987, 1869607, 1866771, 1527205,
1079009, 1272467. All material presented
herein is intended for informational purposes only and is
compiled from sources deemed reliable
but has not been verified. Changes in price, condition, sale
or withdrawal may be made without
notice. No statement is made as to accuracy of any
description. All measurements and square
footage are approximate. Equal Housing Opportunity.
As we are half way into Week 4 (or what feels like 458) of Shelter in Place, I am thinking of you and want to know how you’re feeling! Are you healthy, sane, finding some silver linings? What are you cooking? What are you reading?
There are much more important things than real estate right now, but since some of my clients are trying to make decisions about buying and selling, I will continue to try to provide useful information on market trends and conditions as it is made available to us.
Many properties are on hold status (including mine, scroll down to the bottom for a look) to stay in the spirit of shelter in place because although real estate is considered ‘essential’ it’s with the caveat that showings be done virtually whenever feasible. Now that a few weeks have passed into the shutdown, we have a little more insight into the market and we are hearing of pent-up demand and pre-approvals happening while interest rates are still historically low.
The first thing to remember is that there is a time lag – usually 3 to 6+ weeks – between a new listing coming on market, an offer being negotiated and accepted, and when the transaction actually closes sale. This means that almost all of the sales price data we have, as of the first week of April, still reflects the market BEFORE the shelter-in-place rules went into effect. In virtually all Bay Area counties, first quarter and March median sales prices were quite strong.
This report will look at the effect of the crisis on supply and demand by reviewing week by week statistics, at sales price trends reflecting the market before the crisis, and longer-term trend data to give context to how the market typically performs at this time of year. Spring is usually the most active selling season and often sees the highest median sales prices of the calendar year, due to both the level of buyer demand and the seasonal surge in the luxury home market. (A higher percentage of luxury home sales pulls up the overall median sales price.)
We do not know how the crisis will ultimately play out, depending as it does on so many rapidly changing, socio-economic factors.
Median Sales Price Trends
These first 4 charts review median sales price trends in the short, medium and long-term. March and first quarter prices generally reflect the pre-crisis market.
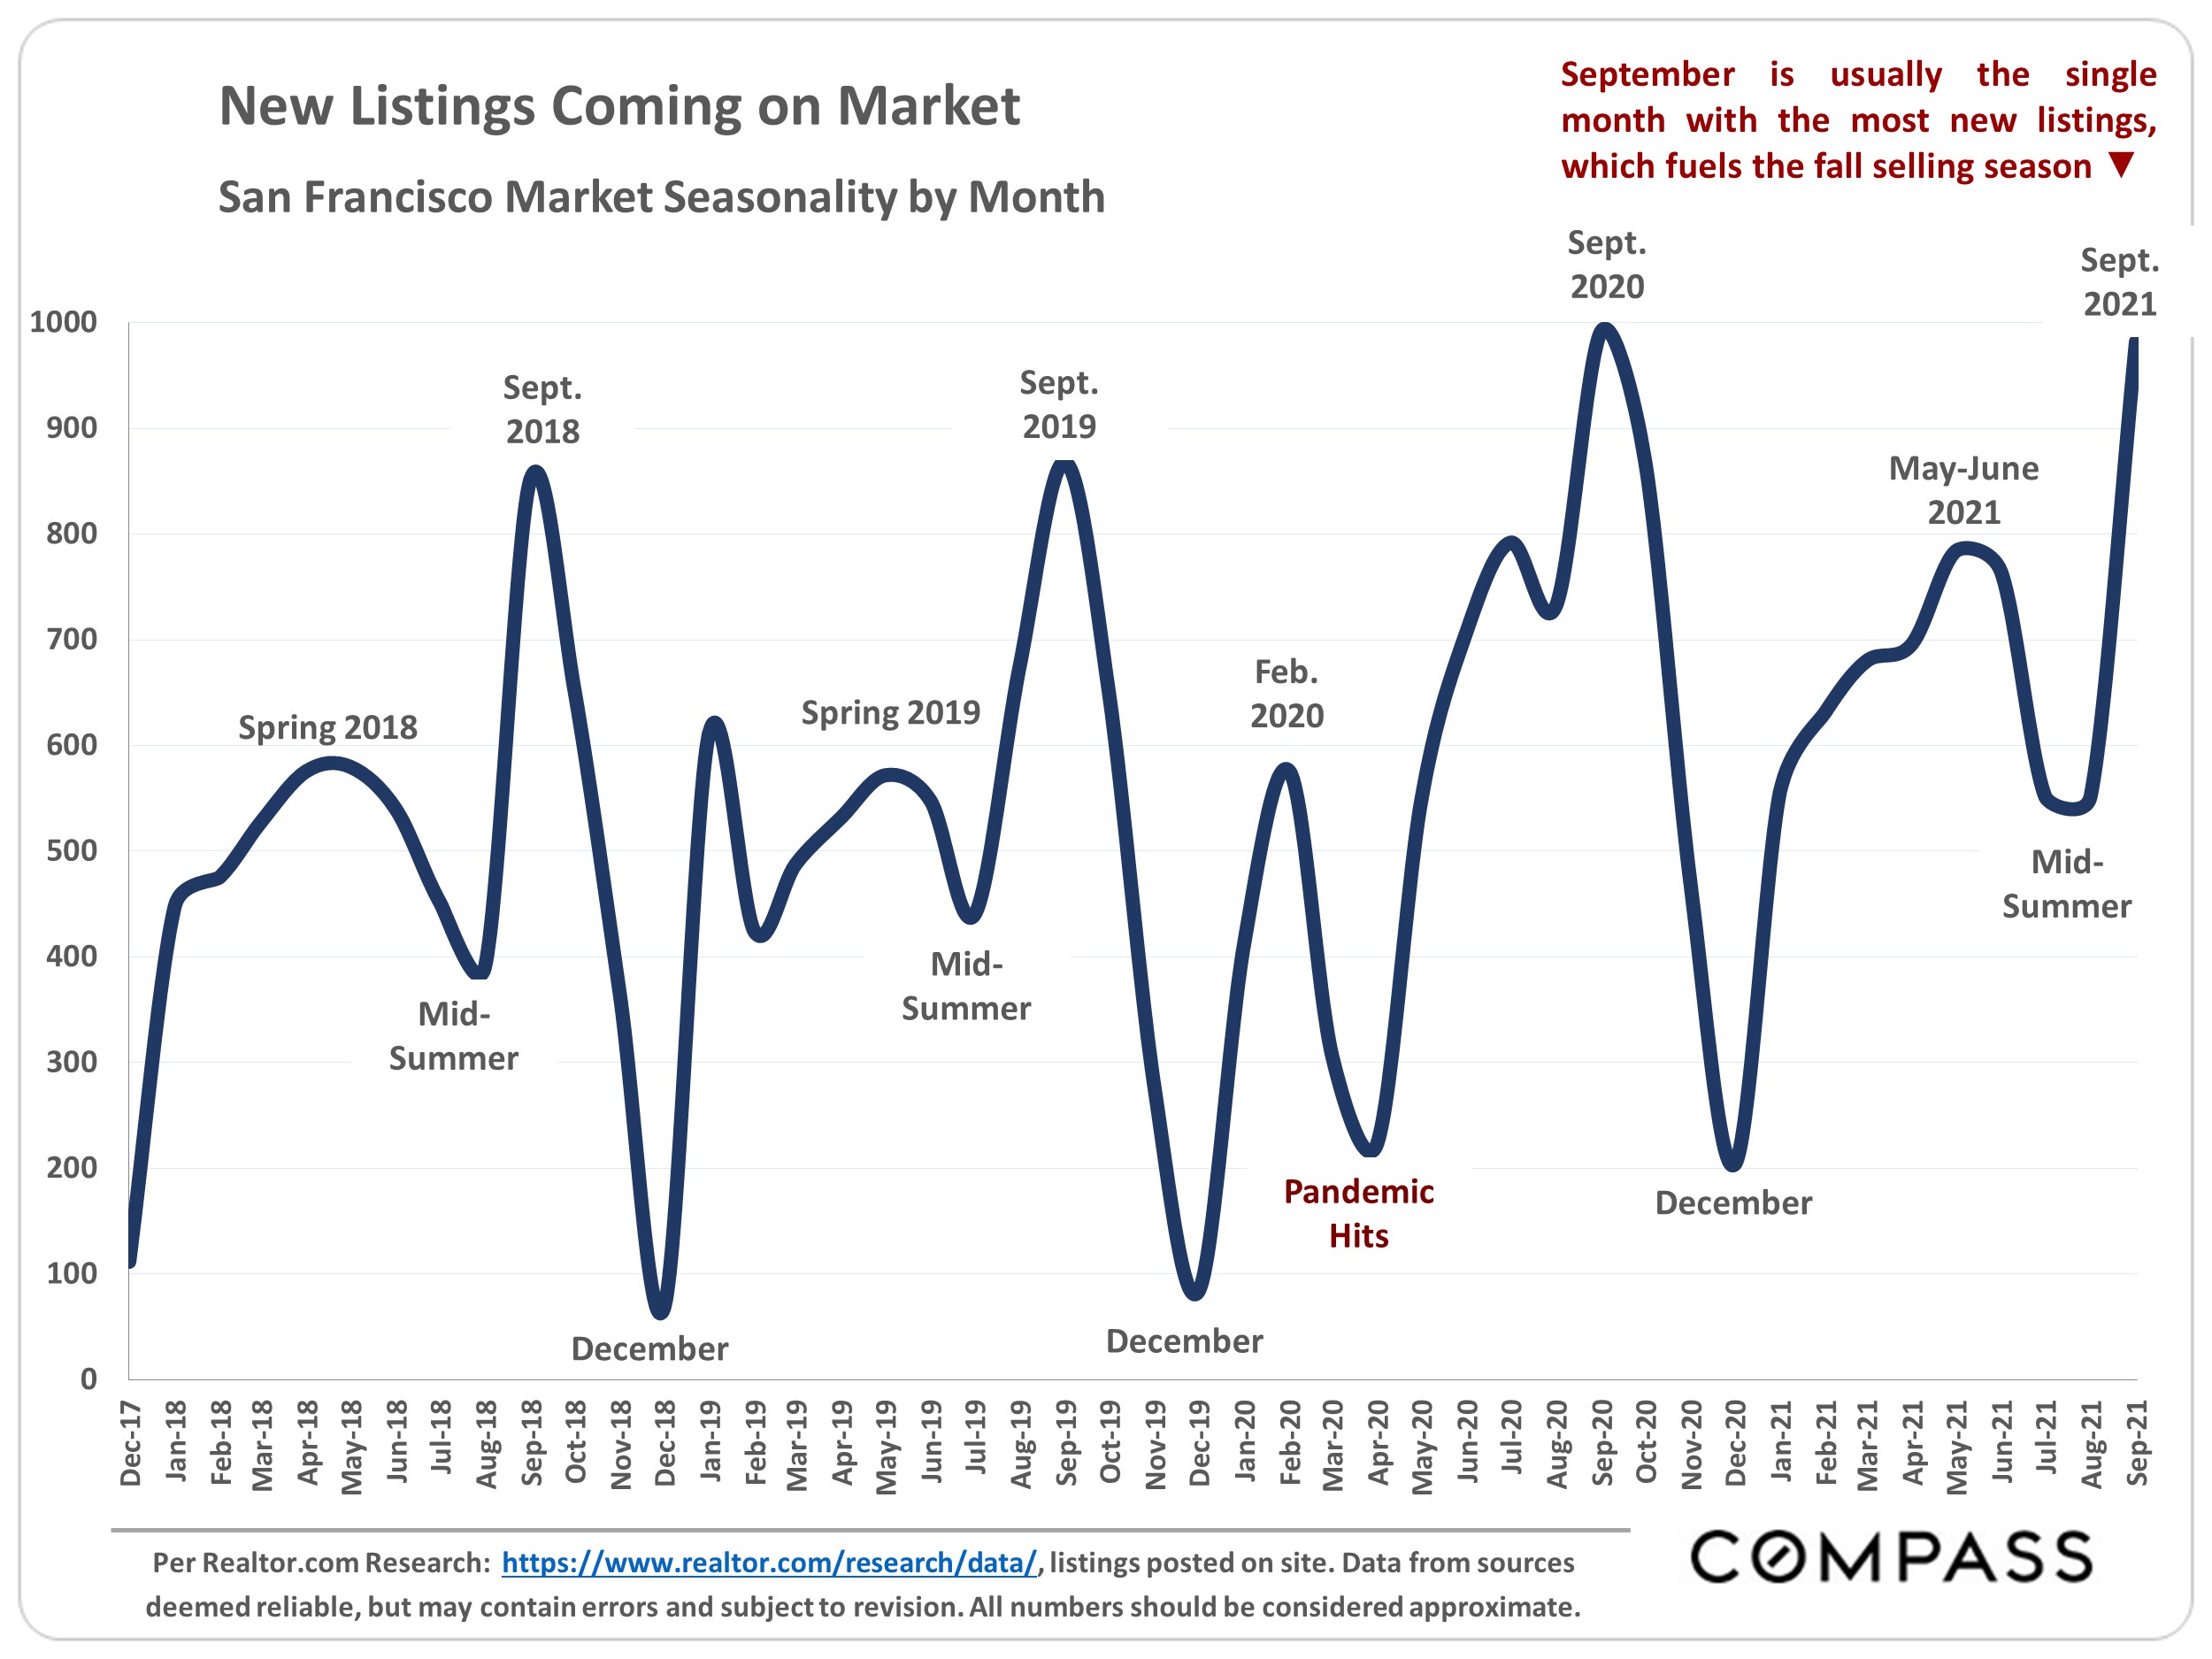
The following 4 charts detail the plunge in listing and accepted-offer activity, and the surge in listings being pulled off the market by sellers, over the past 4 weeks. Typically, at this time of year, the first 3 charts would be seeing steady climbs over February numbers, and the 4th chart would have a very low, flat trend line.
Though the numbers are way down, some listings have still been going into contract.
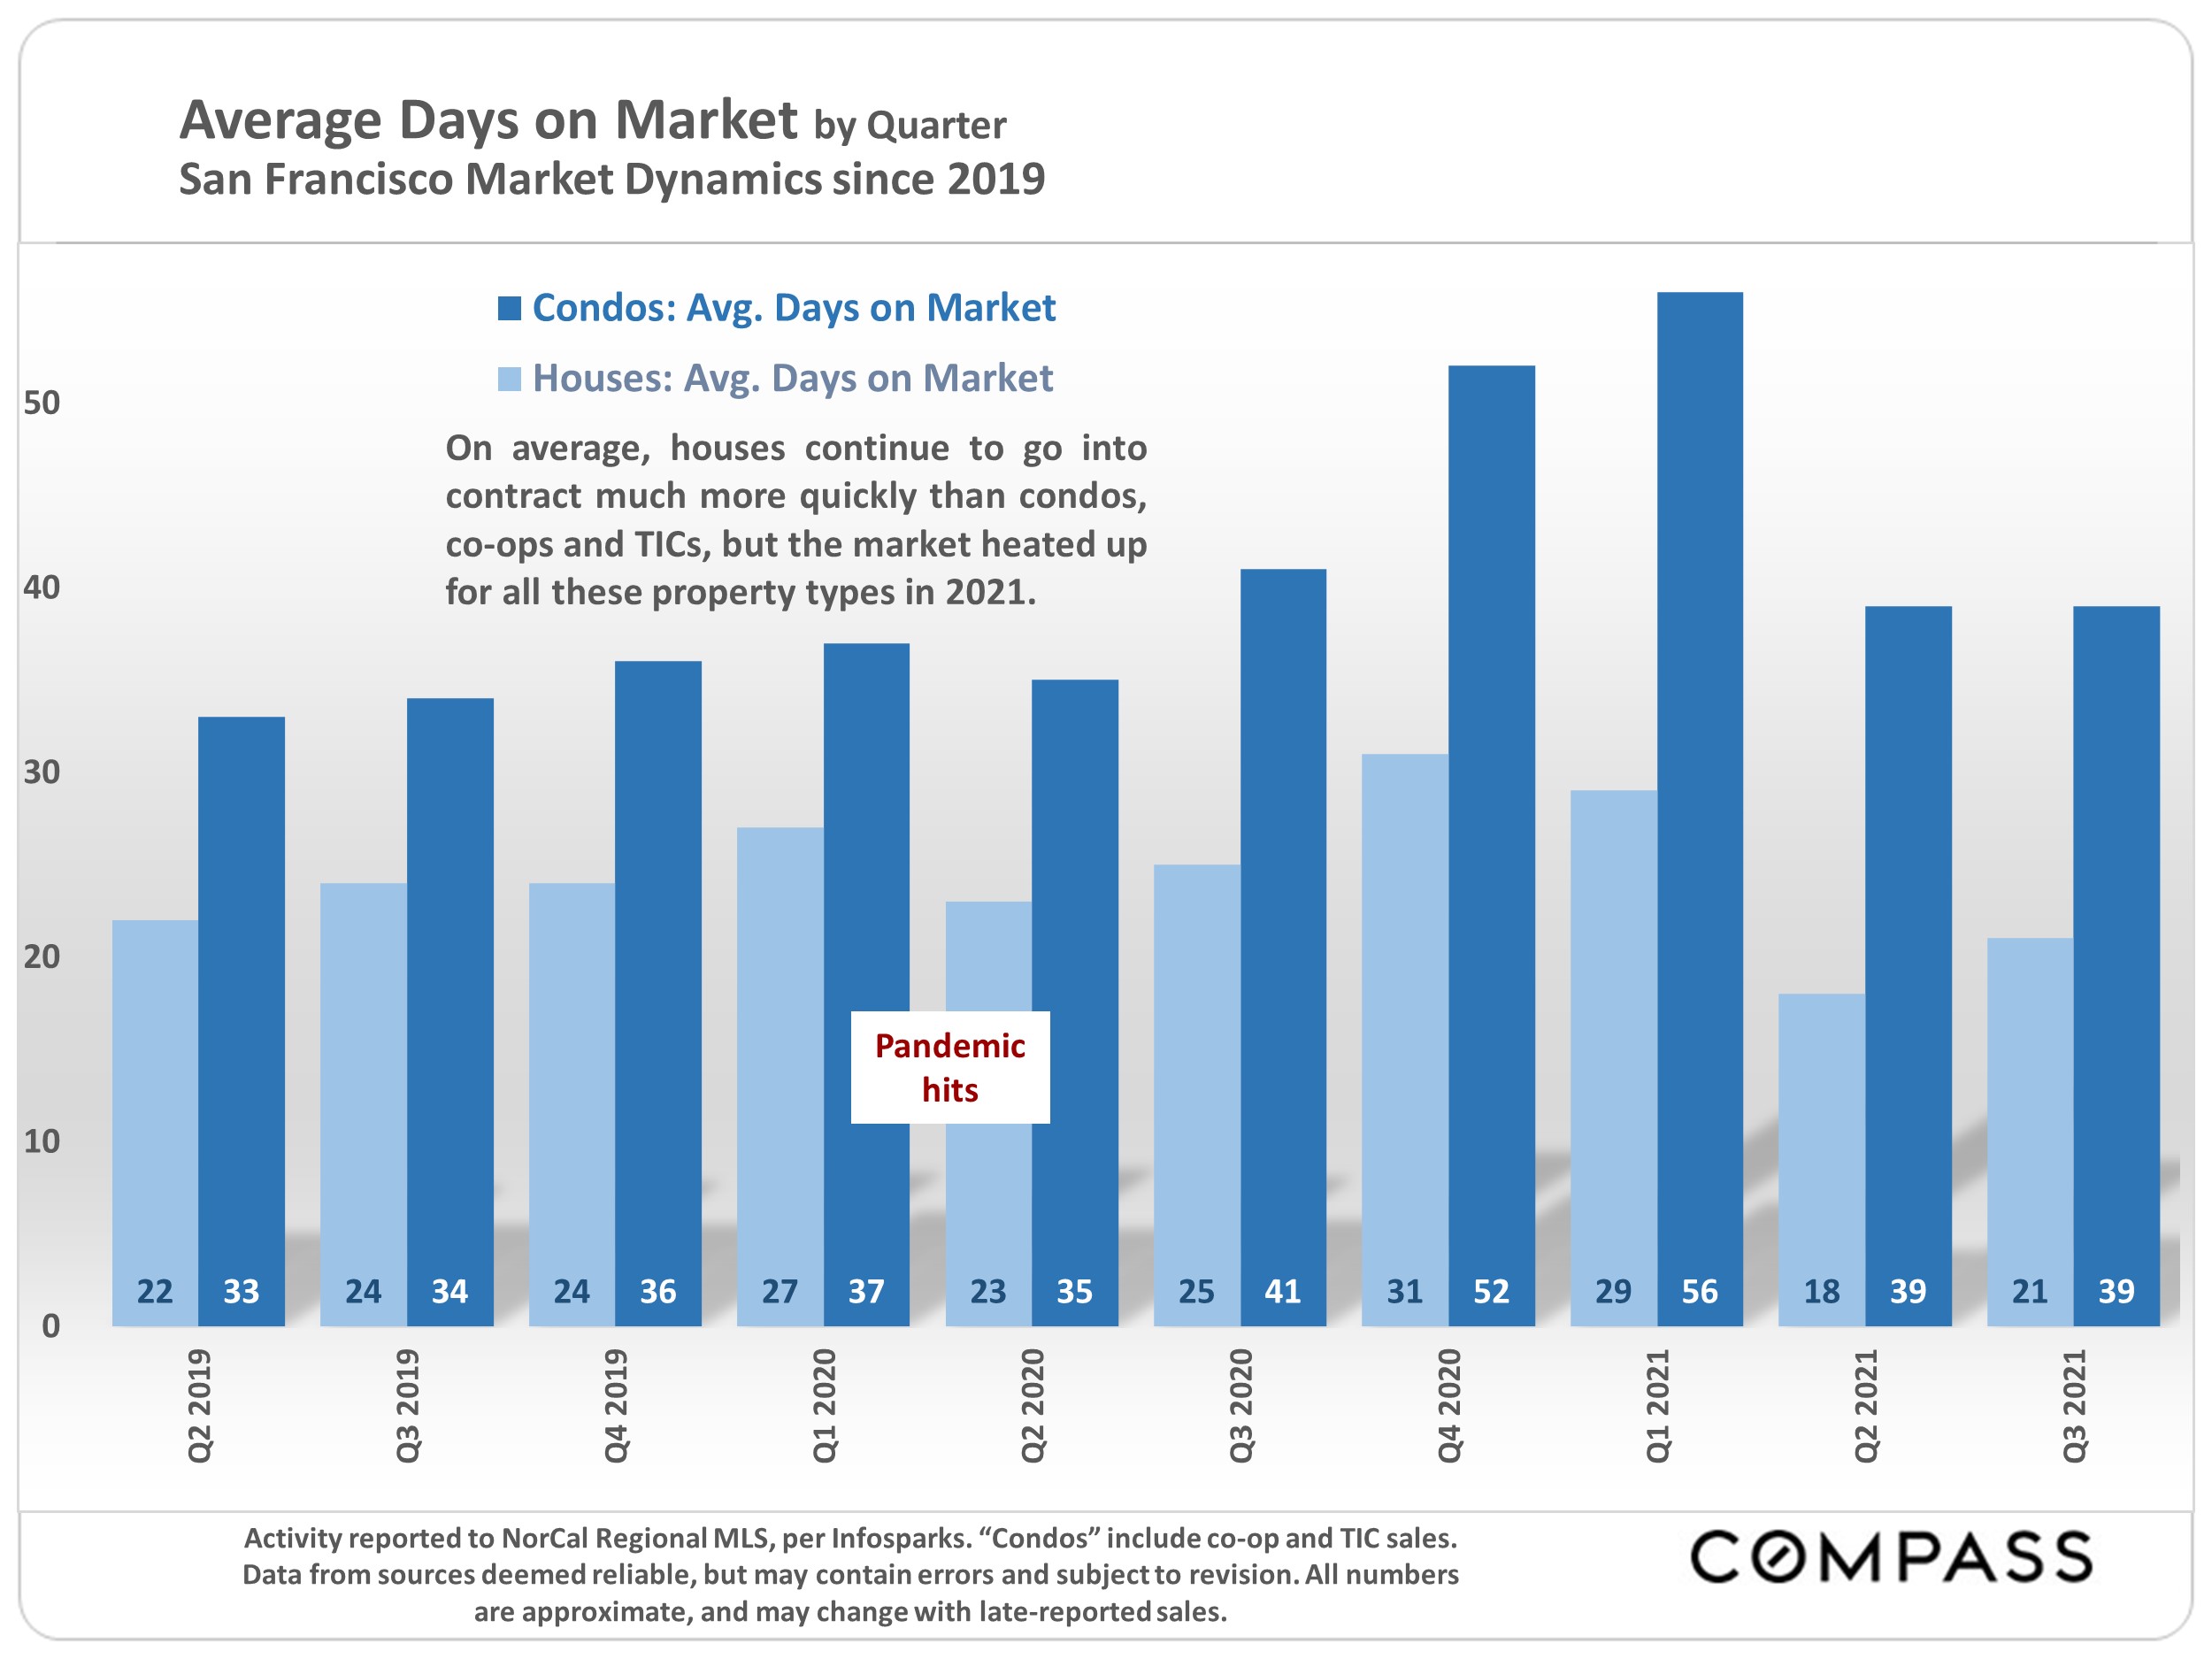
Average Days on Market by Month
Those listings that did go into contract in March – a much lower number than normal – apparently did so quite quickly after coming on market, presumably seizing the attention of buyers despite the crisis. Or the buyers and sellers may already have been in the midst of negotiations when shelter in place rules began.
The Luxury Home Market
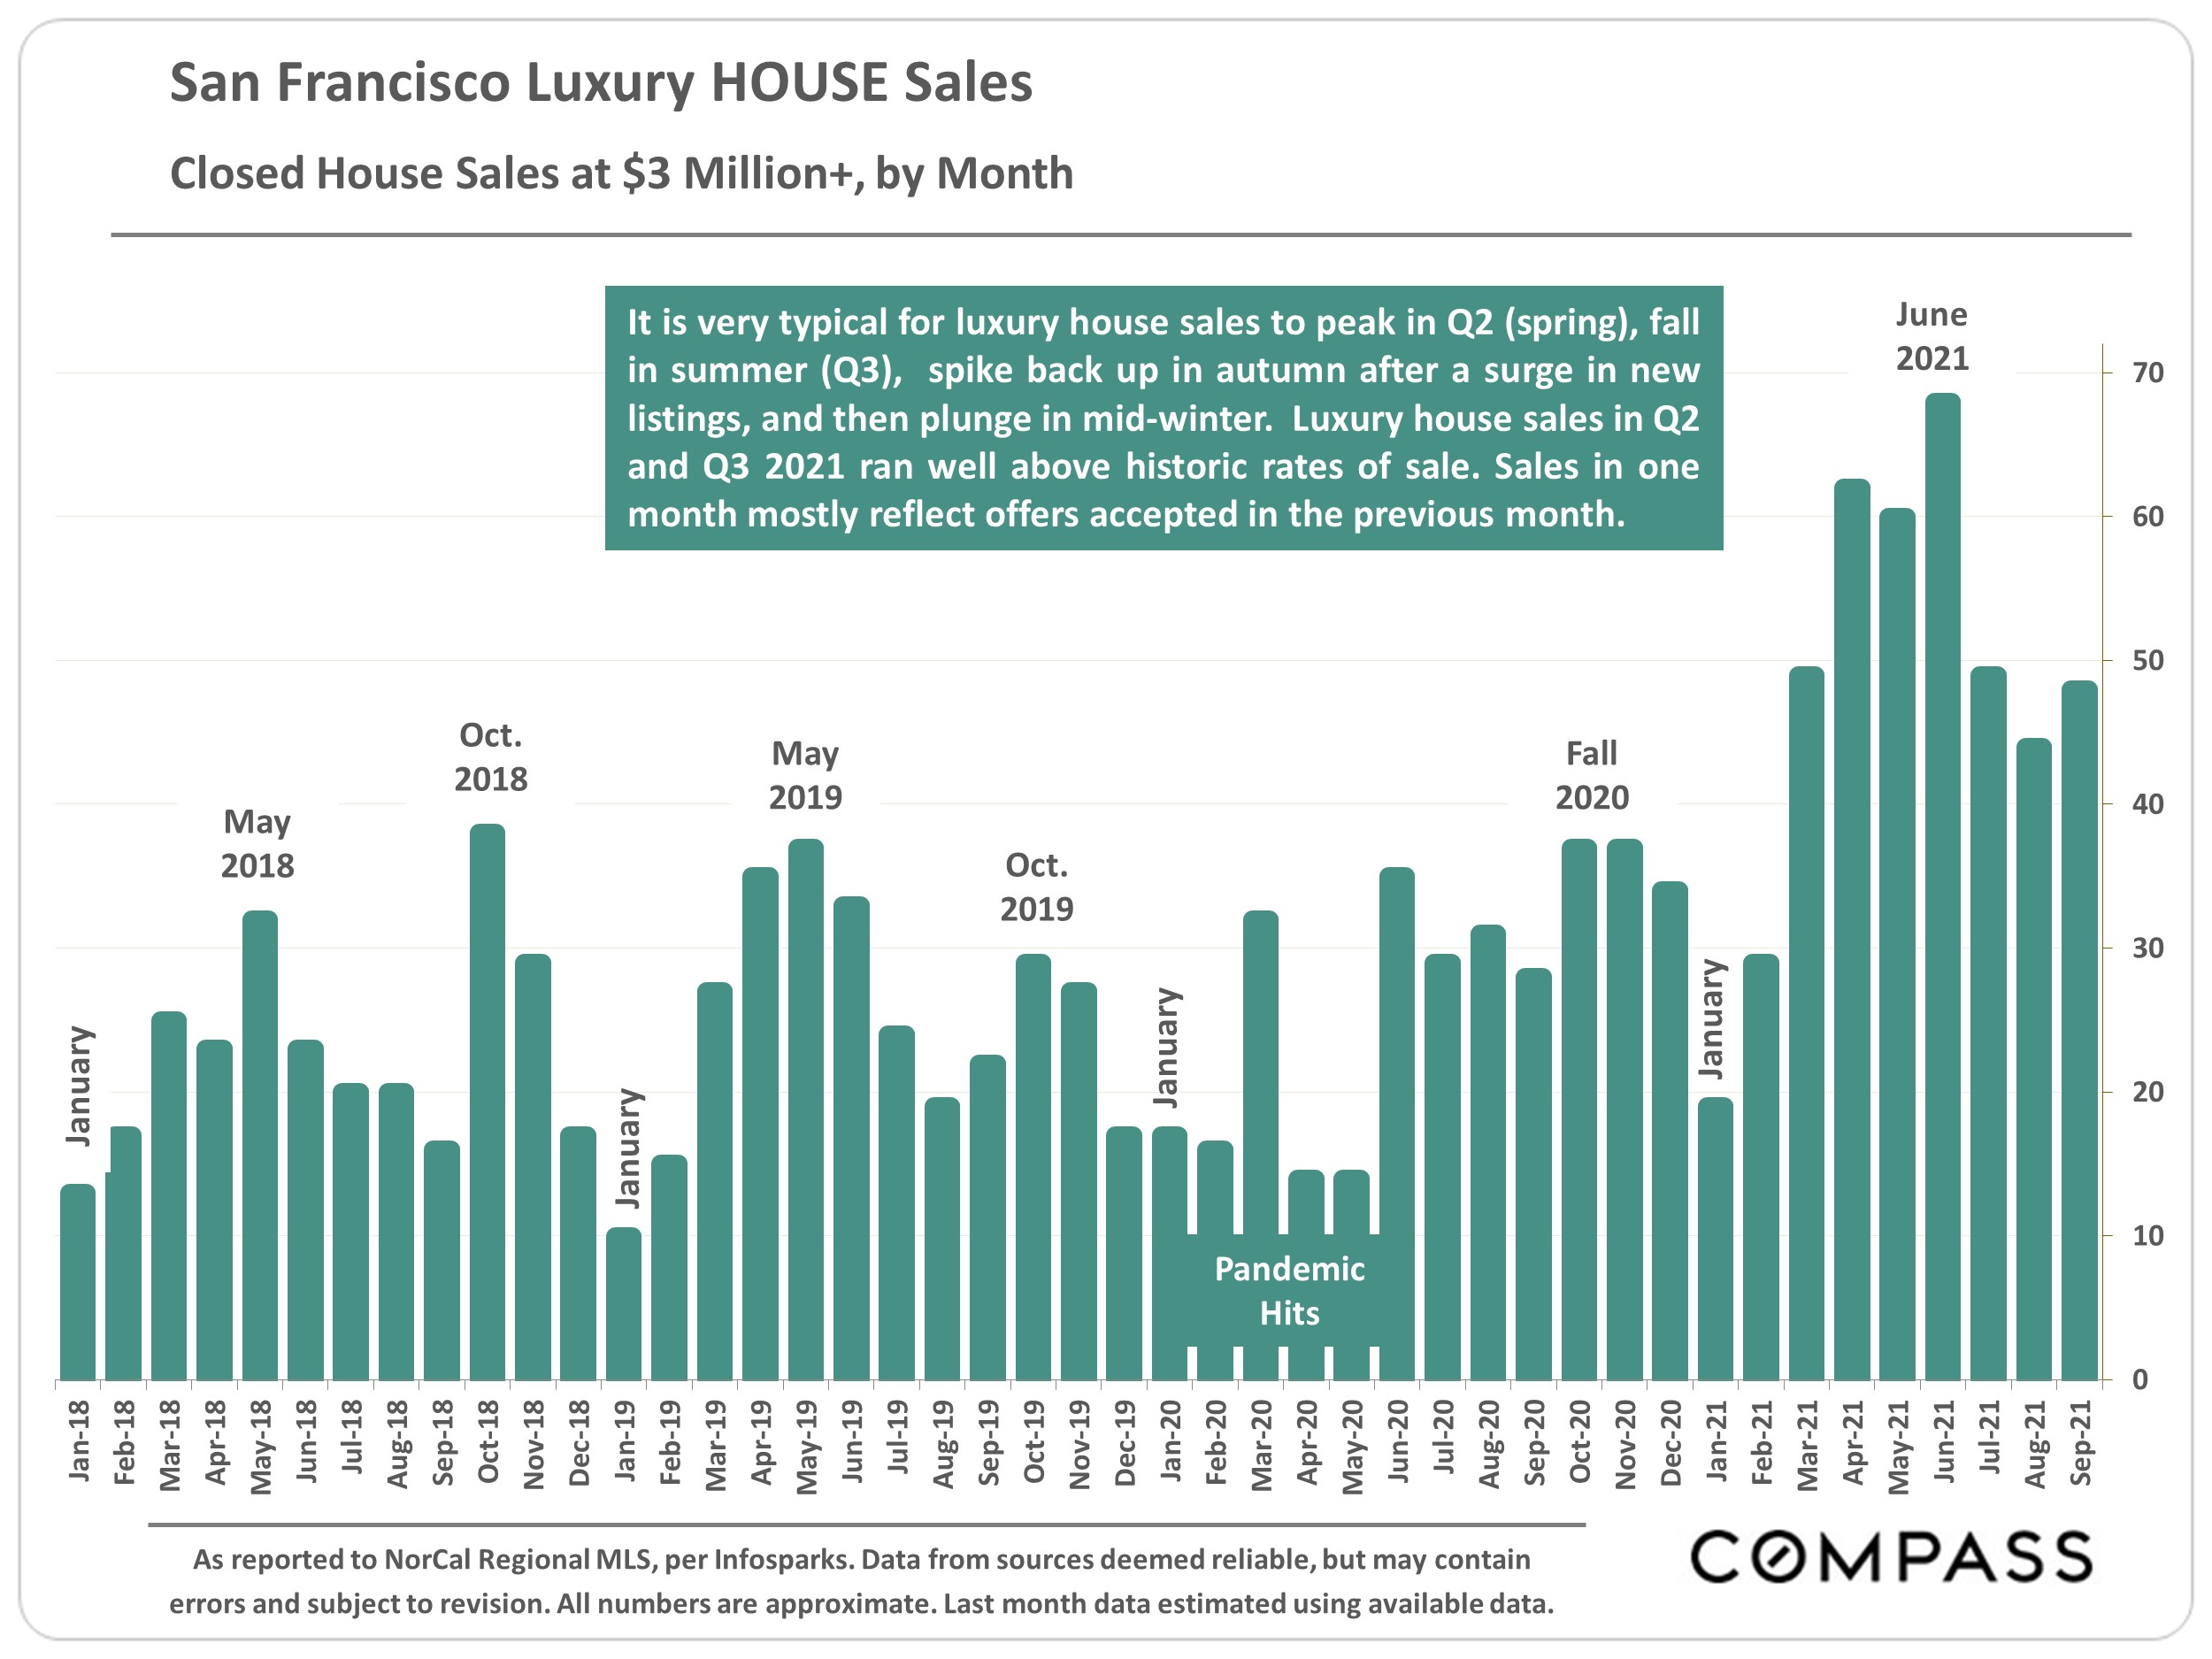
The luxury market is fiercely seasonal, and typically spring (Q2) sees the peak in annual sales volumes. Higher-price home sales are often more deeply affected by financial-market crises since affluent households tend to have more wealth tied up in the markets, and watch their movements more closely.
These next 2 charts look at weekly trends in the markets for homes of $2.5 million+ and of $5m+.
Normal Market Seasonality Trends
These 2 charts illustrate how seasonality typically affects supply and demand, both climbing rapidly from the beginning of the year through late spring.
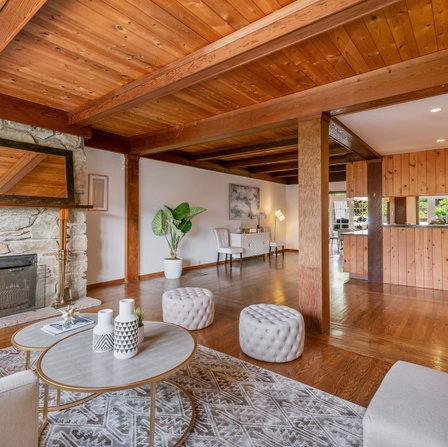
Handsome and well located, clean and stylishly renovated!
This house-like two level condominium offers a superbly designed open floor plan and exclusive use garden for contemporary living. Situated on a flat block in the hub of coveted NOPA. Three
Compass is a real estate broker licensed by the State of California operating under
multiple entities. License Numbers 01991628, 1527235, 1527365, 1356742, 1443761, 1997075,
1935359, 1961027, 1842987, 1869607, 1866771, 1527205, 1079009, 1272467. All material presented
herein is intended for informational purposes only and is compiled from sources deemed reliable
but has not been verified. Changes in price, condition, sale or withdrawal may be made without
notice. No statement is made as to accuracy of any description. All measurements and square
footage are approximate. Equal Housing Opportunity.
Pota Perimenis is committed to providing an accessible website. If you have difficulty accessing content, have difficulty viewing a file on the website, or notice any accessibility problems, please contact us at (415) 407-2595 to specify the nature of the accessibility issue and any assistive technology you use. We strive to provide the content you need in the format you require.