————————————————————
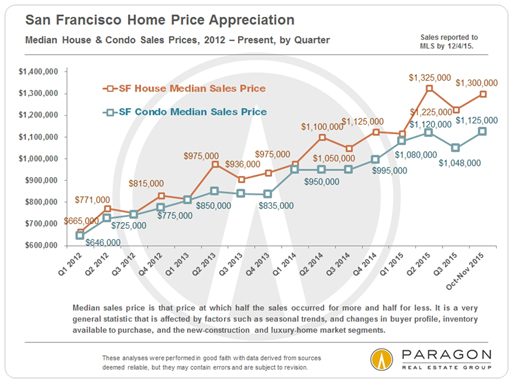
In recent months, there have been multiple reports in local media about Big Drops in San Francisco Home Prices! But, umm, we are not seeing it, neither on the ground in the hurly burly of buyers and sellers making deals, nor in the year-over-year quarterly statistics of supply and demand. News articles often make a big deal regarding the median sales price in a single month, but monthly data is often gravely deficient as an indicator, fluctuating up and down without much meaningfulness due to a number of factors. January and February are particularly bad months to draw conclusions from: The lowest sales volumes of the year, reflecting deals negotiated during the December-January market doldrums, with weather issues sometimes thrown in besides (for instance, in early 2017). Last but not least, the media often mixes property types to come up with a single median sales price, and that is generally not a good idea either.

Year-over-Year Comparisons of Q1 Statistics
 Chart 2: San Francisco Condo Market Overview
 ————————————————————
Annual Median House Sales Price Trends:
5 Selected San Francisco Neighborhoods, since 2004

Generally speaking, in higher priced areas, median house prices have been plateauing or dropping a little, while the more affordable neighborhoods have continued to appreciate: This is a relatively common dynamic around the Bay Area.
The only way to assess value or appreciation for a particular home is by performing a comparative market analysis tailored to its specific location, condition and circumstances. Of all the neighborhoods graphed above, the Marina has by far the fewest house sales and the widest range of individual home sales prices, so it is most susceptible to median price fluctuations caused by other factors besides changes in value – for example, a substantial change in the listings available to purchase in a given year. We do not believe that the same Marina house selling in 2015 would have sold for 15% less in 2016: something less, perhaps; 15% less, very unlikely. This is a good illustration of the dangers of making too much of median sales price changes.
If you would like median home price trends for another San Francisco neighborhood, please let us know.
Average Sales Price to Original List Price Percentage
By Month: House, Condo, Co-op, TIC & 2-4 Unit Building Sales
As seen in this chart, overbidding typically heats up as the market moves into spring. So far, this year has been no exception, though the overbidding percentages are somewhat lower than in recent years.

Annual Market Trends
For clarity and meaningfulness, we much prefer annual trend analyses, with their much bigger data sets, and have recently completed a comprehensive review of virtually every statistic we could think of on that basis. Doing so allows us to stand back to see the broader view of what is happening in the market, instead of getting obsessed by what happens to be in front of our shoe. Looking at annual trends, virtually all the market statistics illustrate the same general conclusion: The market became progressively stronger coming out of the 2009-2011 housing recession; the frenzy peaked in 2015; and the market cooled a bit in 2016, condos more so than houses. This is a generalization of the macro-trend: Different market segments have been going in somewhat different directions and speeds in the city and around the Bay Area in the past year or so.
Below are a few of the many analyses. The full review is here: Long-Term Annual Trends in San Francisco Real Estate
First 2 charts: The hotter the market, the greater the percentage of listings that sell quickly, and the more ferocious the competitive bidding on those listings.

Even with some cooling, the overbidding on appealing new listings has remained quite dramatic: Our current percentages over asking would stun anyone from almost any other market in the country. (However, underpricing has also become a more common strategy here than in other markets.)

Annual Trends Chart 3: As a market begins to cool, the number of listings that expire or are withdrawn without selling increases. This is typically due to increasing supply, softening demand, sellers looking for more money than buyers are willing to pay, or all three.

Annual Trends Charts 4 & 5: As new condos and new rental apartments came on the market in greater numbers in the past year, it cooled those two market segments, much more so than the house segment, of which hardly any are built new in the city anymore. (The more affordable house market in the city has remained remarkably hot.) The rental market was affected most as more new rental units came on market than at any time since WWII: Though SF still has the highest rents in the country, they have dropped from their peak in 2015.


Chart 6: To a large degree due to big changes in tenant eviction and condo conversion laws, the TIC market has gone through a large decline in sales volume. It is also true that after decades of turning multi-unit buildings into condos and TICs, the supply of such properties available to do so has declined. Generally speaking, TIC median sales prices plateaued from 2015 to 2016 at about 14% below the median condo price.

San Francisco Luxury Home Market
Three sample charts from our big report on the high-priced home segment. Generally speaking, the luxury market has cooled more than the more affordable segments, and the luxury condo market has cooled more than the luxury house market. This is mostly due to the recent surge of new-construction luxury condos onto the market in the city.
The first two charts below are snapshots of either the house or condo segment of the luxury market in two of our major districts.


This next chart illustrates one of the bigger changes in SF high-end home markets. Many more listings, resale luxury condos in particular, are expiring or being withdrawn from the market without selling.

Our full report is here: Luxury Home Market of San Francisco
Interest Rates
Constantly shifting economic and political factors continue to affect rates: Mortgage interest rates are significantly up since the election, fluctuating up and down since the year began, but still far below historical norms. This is a factor everyone is watching carefully because of its potential impact on affordability, already a big issue in the Bay Area.

Apartment Building (Multi-Unit Residential) Sales
We have also released our quarterly report on the multi-unit residential property markets of San Francisco, Marin and Alameda Counties: Bay Area Apartment Building Market. Below is one of its many analyses.

All our reports can be found on our redesigned website: Paragon Market Reports
Using, Understanding and Evaluating Real Estate Statistics
If you will forgive a little celebrating on our part: In the last two quarters, Paragon sold more San Francisco residential and multi-unit residential real estate than any other brokerage (as reported to MLS, per Broker Metrics), even though we have far fewer agents than many of our competitors.
If you have any questions or comments regarding this report, or if assistance can be provided in any other way, please call or email.
————————————————————
It is impossible to know how median and average value statistics apply to any particular home without a specific comparative market analysis, which we are happy to provide upon request.
These analyses were made in good faith with data from sources deemed reliable, but may contain errors and are subject to revision. It is not our intent to convince you of a particular position, but to attempt to provide straightforward data and analysis, so you can make your own informed decisions. Median and average statistics are enormous generalities: There are hundreds of different markets in San Francisco and the Bay Area, each with its own unique dynamics. Median prices and average dollar per square foot values can be and often are affected by other factors besides changes in fair market value. Longer term trends are much more meaningful than short-term.
© 2017 Paragon Real Estate Group
No one knows San Francisco real estate better than Paragon.
| Paragon Real Estate Group www.paragon-re.com/ |
|


