Category Archives: San Francisco Real Estate Blog

SF Real Estate Positive & Negative Factors

New Paragon Report: I am constantly asked how one development or another might affect San Francisco and Bay Area real estate markets – tax law changes, interest rates, soaring stock markets, climate change, migration trends, housing affordability, new home construction, and so on – but trying to evaluate one factor in isolation is often misleading because multiple factors often gang up to trigger a change, or 1 factor counteracts or ameliorates the effect of another. Or a single development has both positive and negative influences. This analysis was created in an attempt to get a wider view of the shifting factors that, I believe, apply to the market today:

https://www.paragon-re.com/trend/positive-negative-factors-in-sf-bay-area-real-estate

A link to this report shall be included in the February residential newsletters, which I hope to get out within the next week.

All Paragon’s reports can be found here: https://www.paragon-re.com/market_updates

SF Real Estate: Looking Back on 2017 & Forward to 2018


Paragon Real Estate Group
 

Paragon Real Estate Group

San Francisco Real Estate Market

Looking Back on 2017
& Forward to 2018

January 2018

————————————————————

The median SF house sales price in 2017 was $1,420,000 (up from $1,325,000 in 2016), and for condos, it was $1,150,000 (up from $1,095,000). Looking just at the 4th quarter, median prices were $1,500,000 for houses (up from $1,350,000 in Q4 2016) and $1,185,000 for condos (up from $1,078,000).


San Francisco, CA, National Home Price Trends

San Francisco Median Home Prices by Quarter


Additional chart: Bay Area Median Home Price Trends by County

The chart below, based on CoreLogic S&P Case-Shiller Index data, tracks general price appreciation trends of homes in the upper third of prices in the 5-county SF Metro Area. Case-Shiller does not base their calculations on median sales price changes but uses its own proprietary algorithm. This chart has been simplified to only reflect percentage increases and decreases from various points in real estate cycles. Since it covers 5 counties, it is a very generalized illustration.

Case-Shiller San Francisco Bay Area Home Price Trends

Link to our full report on the Case-Shiller Home Price Index

Link to our report on Bay Area real estate cycles

————————————————————


Moving into 2018, there are a lot of spinning plates in the air – local, state, national and international factors that could affect markets. 2017 saw real estate markets surge and financial markets soar. After some cooling from mid-2015 to mid-2016, the Bay Area high-tech economy surged back into high speed, with companies leasing enormous spaces in newly built office buildings – which they will presumably fill with new hires. Unemployment rates have flirted with historic lows, and 2018 may see some major local IPOs, which could create great quantities of new wealth. The Bay Area still has probably the most dynamic, innovation-fueled economy in the world and indisputably remains among the great metro areas on the planet – but there are also social, economic, political and environmental challenges looming as well.

Congress delivered an unpleasant holiday present to many Bay Area residents in the form of federal tax law changes limiting the deductibility of mortgage interest and state and local taxes. The effect of these changes make living in an already high cost-of-living area more costly for many residents, and also reduce some of the financial incentives of homeownership, especially for more expensive homes. Predictions on the effect of these tax changes on local housing markets and the business environment range from one extreme (economic devastation) to the other (shrug), and the state legislature is currently working on bills that might blunt the negative financial impacts. It is too early to guess how it will all play out. We live in interesting times.

This report will range far and wide looking at real estate, and some economic and demographic issues that impact it. Most of the charts are self-explanatory, so we have kept the text to a minimum. A review of annual, year-over-year, real estate market trends in San Francisco are at the end of this report.

————————————————————

San Francisco Home Sales by Property Type

San Francisco Probates Views Values

San Francisco New Home Listings Coming on Market


Link to our report on market seasonality

California Migration Trends in 2016


Link to our analysis of domestic and foreign migration trends

Link to our survey of SF and Bay Area demographics

San Francisco Employment Growth by Year

S&P 500 Index by Year

Annual Mortgage Rate Trends


Link to our report on economic context factors

San Francisco Housing Affordability Trends


Link to our report on Bay Area housing affordability

San Francisco Bay Area Rent Trends


Link to our report on the apartment building market

————————————————————

San Francisco Luxury Homes Market

San Francisco Luxury House Sales by Year

San Francisco Luxury House Sales by Neighborhood

San Francisco Luxury Condo Sales by Year

San Francisco Luxury Condo Sales by Neighborhood

————————————————————

SF Home Prices by Neighborhood


The following tables and charts are part of a larger survey, which can be provided upon request.

San Francisco Neighborhood & District Map

San Francisco houses under a million dollars

San Francisco 4-bedroom house prices

San Francisco 3-bedroom house prices

San Francisco 2-bedroom condo prices

San Francisco Condo Sales by Price Segment

————————————————————

Annual Market Trends


Most of these annual trend charts show the market heating up again in 2017 after some cooling in 2016. Very generally speaking, since 2015, the house market has been hotter than the condo market, and the more affordable neighborhoods hotter than the more expensive. But 2017 was a strong year across virtually all market segments.


San Francisco annual median house price percentage changes

 San Francisco annual condo price percentage changes

San Francisco Listings Selling Quickly

San Francisco Home Price Overbidding

San Francisco Days on Market by Year

San Francisco Months Supply of Inventory by Year

San Francisco Supply and Demand Trends


All our real estate analyses can be found here: Paragon Market Reports

Please let us know if you have questions or we can be of assistance in any other way. Information on neighborhoods not included in this report is readily available.

If you will forgive a little celebration on our part: In 2017, Paragon became the largest brokerage in San Francisco by dollar volume sales of residential and multi-unit residential real estate (as reported to MLS, per Broker Metrics). We opened our doors in 2004.


————————————————————

It is impossible to know how median and average value statistics apply to any particular home without a specific, tailored, comparative market analysis. In real estate, the devil is always in the details.

These analyses were made in good faith with data from sources deemed reliable, but may contain errors and are subject to revision. It is not our intent to convince you of a particular position, but to attempt to provide straightforward data and analysis, so you can make your own informed decisions. Median and average statistics are enormous generalities: There are hundreds of different markets in San Francisco and the Bay Area, each with its own unique dynamics. Median prices and average dollar per square foot values can be and often are affected by other factors besides changes in fair market value. Longer term trends are much more meaningful than short-term. Late-reported MLS activity may change certain statistics to some small degree.


© 2018 Paragon Real Estate Group
 
Pota Perimenis–helping you make the right moves in real estate.
Paragon Real Estate Group
www.paragon-re.com/

Pota Perimenis
Lic# 01117624
1400 Van Ness Avenue
San Francisco, CA 94109
Cell 415-407-2595
pperimenis@paragon-re.com
www.sfcityhomes.com

What You Do Not Know About San Francisco


Paragon Real Estate Group
 

Paragon Real Estate Group

What You Do Not Know about San Francisco
Who We Are; Where We Come From; What We Believe;
How We Live; What We Do; Money Earned & Money Spent

Selected San Francisco Demographics – Illustrated
December 2017 Report

While waiting for final data on the feverish 2017 real estate market to arrive, we thought to step back from homes and, instead, look at the people who live in them. There is no city and metropolitan area quite like San Francisco and the Bay Area, and here are some of the details. Compiled solely for your entertainment and, perhaps, mild edification.

Depending on data source, these analyses pertain to either San Francisco alone, or to a multi-county San Francisco Metro Area, as delineated on each chart.

Dozens of updated real estate analyses can still be found here: Paragon Market Reports

—————————————————————————————-

Ethnicity, Race, Ancestry & Language

Religious and Spiritual Practices & Beliefs

A Selection of Miscellaneous Data Points

Education, and Income by Education & Sex

Employment, Wages & Commuting

The Bureau of Labor statistics analyzes average annual wages for over 700 local
occupations in the SF metro area. Below is a sampling of approximately 50 of them.


Spending Money

Voting

A Selection of Miscellaneous Percentages

The Ages of San Francisco

Selected Statistics by San Francisco ZIP CODE

Income, Age, Education, Foreign Birth & Homeownership


Looking at this first chart below, you may wonder why neighborhoods like Pacific Heights and Russian Hill do not show up at the top of the income table, and why South Beach and the Presidio do. First of all, the zip codes for both Pacific Heights and Russian Hill include other, much less affluent neighborhoods: For example, the zip code for Russian Hill runs all the way into the Tenderloin, and that for Pacific Heights includes most of the Western Addition. Both zip codes also include many renters under long-term rent control. Both these situations skew their median household income figures lower.

On the other hand, the South Beach area is a recently built neighborhood, not long ago filled with parking lots and small commercial enterprises, but now filled with luxury condo buildings. The condos are quite expensive and since all the buildings have been built since 1990, there is no rent control, which means its renters generally pay high market rents. Whether owner or renter, one has to be earning a very substantial income to live there. The Presidio, and we are talking about the park (which contains rental housing), is under federal jurisdiction, so it too is exempt from rent control, and, of course, since it is right next to Pacific and Presidio Heights, its market rents are also quite high, which likewise affects income requirements accordingly.

Unsurprisingly, degree of education correlates strongly with household income figures.

How Americans Spend the Hours of Their Days

Unhappy Statistics about Crime

—————————————————————————————-


All our reports and articles can be found here: Paragon Market Reports

San Francisco Real Estate Market Report

Bay Area County Markets & Demographics

SF Neighborhood Home Price Tables

SF Luxury House Market Update

SF Luxury Condo Market Update

Bay Area Apartment Building Market Report

The data herein is from a wide variety of third party sources deemed reliable – much of it from national, state and local government data sources – but it may contain errors, and is subject to revision. When the term San Francisco Metro Area is used, it signifies that the data includes various nearby counties outside the city, however different organizations vary in which counties they include in that description. If different sources disagreed, we chose the data we thought most reasonable. Different analyses often pertain to somewhat different time periods. All data should be considered approximate or good-faith estimates.

© 2017 Paragon Real Estate Group

 
Pota Perimenis–helping you make the right moves in real estate.
Paragon Real Estate Group
www.paragon-re.com/

Pota Perimenis
Lic# 01117624
1400 Van Ness Avenue
San Francisco, CA 94109
Cell 415-407-2595
pperimenis@paragon-re.com
www.sfcityhomes.com

Huge Leap in October SF Median House Sales Price

Huge Leap in October SF Median House Sales Price
San Francisco Luxury House Sales Hit New High

The Hottest Real Estate Markets in San Francisco
12-Year Trends in Neighborhood Home Prices
Advantages to Buying during the Holiday Slowdown

November 2017 Report

————————————————————


San Francisco Monthly Median Home Price Trends

The October 2017 median house sales price in San Francisco surged over $100,000 above the previous peak in May to hit a new high at $1,588,000 (sales reported by 11/5/17). A major factor was that October was a record-breaking month for luxury house sales, and more sales of expensive homes pull up the median price. The median condo sales price, at $1,180,000, was a tad below the recent peak hit in August, and luxury condo sales reported to MLS were well below their peak sales volume reached this past June. The luxury market is covered further down in this report.

We prefer measuring median price trends by periods longer than 1 month (which are prone to fluctuate considerably without great meaningfulness), and the below chart illustrates rolling 3-month median price trends for houses ($1,415,000 for August, September, October) and condos ($1,175,000), and 6-month rolling median prices for TICs ($982,500). Remember that median price changes are not perfect measurements of changes in fair market value.


San Francisco 3-Month Rolling Median Home Price Trends


And this chart below based on CoreLogic S&P Case-Shiller data compares the appreciation of the more expensive Bay Area home markets (blue line) – such as most of SF, Marin, San Mateo and Diablo Valley – to the overall national trend (green line), going back to 1987. It is interesting to see where our local appreciation rates have diverged from national rates: The divergence since 2012 has been particularly striking.

Note that the numbers on this chart all refer to a January 2000 price of 100. So, the latest Bay Area reading of 238 means that home prices here have appreciated, according to Case-Shiller, by 138% since January 2000. National home prices appreciated by 95% during that period.


San Francisco vs National Home Price Appreciation

————————————————————

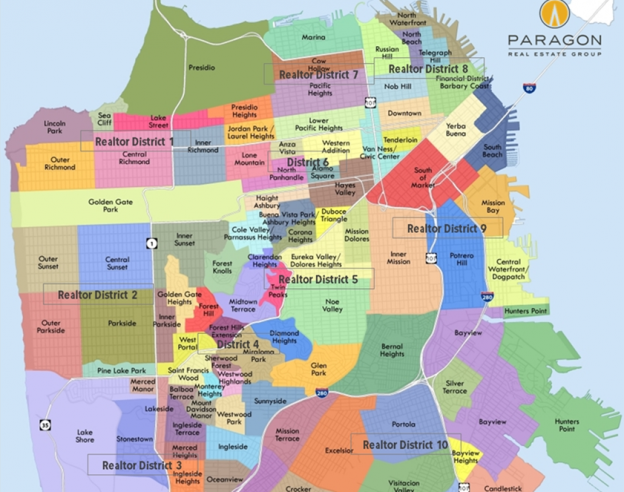
San Francisco Neighborhood & Realtor District Map

San Francisco Neighborhood & District Map

San Francisco Market Overviews

SF House, Condo & TIC Sales by Realtor District


Some districts are dominated by house sales and others by condo sales. The most balanced is the greater Noe, Eureka & Cole Valleys district with almost equal numbers of both. Condo sales now outnumber house sales in the city, a trend which will continue to accelerate with new construction. Looking at the horizontal columns below, the gray portion represents house sales, the teal, condo sales, and the green, TIC sales.

San Francisco House & Condo Sales by District

SF Home Sales by Price Segment

Home sales under $1m are dwindling, and 70% of those are condos or TICs.
The highest number of sales is now in the $1m to $1.5m price segment.

San Francisco Home Sales by Price Segment

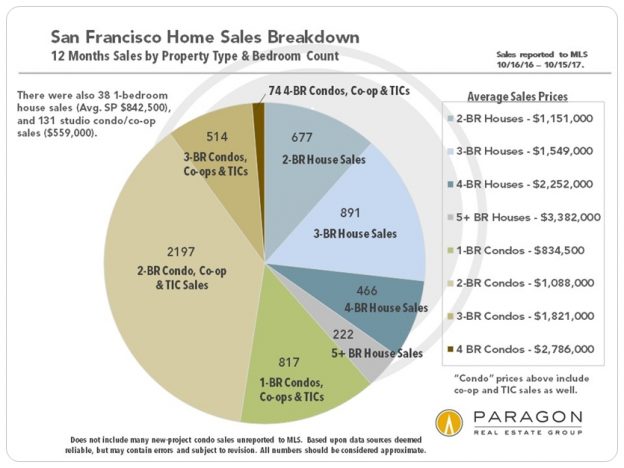
Sales by Property Type & Bedroom Count


Compared to other Bay Area markets, SF has more small, 2-bedroom houses and fewer
big, 5+ BR, house sales – and far more condo sales at much higher prices than in other counties. By far the most prevalent SF home sale now is a 2-bedroom condo.

San Francisco Average Sales Prices by Bedroom Count


Link to Chart: New Listings Trends since 2007

Link to Chart: Unit Sales Trends since 2007

————————————————————

San Francisco Luxury Homes Market


As mentioned before, luxury house sales hit a new high in October 2017: In recent years, October has become the biggest month for very expensive house sales. This is not the case for luxury condos, which typically peak in spring. Looking at broader trends in the second chart below, the luxury home market grew dramatically from 2012 through 2015, cooled significantly in 2016 (especially the luxury condo segment), and then surged back in 2017 to hit new highs. But then everything seems to be surging higher nowadays, from stock markets to homes to iPhone prices.

Luxury house sales in October were concentrated, highest to lowest numbers, in the Pacific Heights-Marina district (D7), the Noe, Eureka & Cole Valleys district (D5), and the Lake Street-Sea Cliff district (D1). These 3 districts contained about 80% of the sales. Other luxury house sales were scattered singly around the city: Russian Hill, Telegraph Hill, Inner Sunset, Potrero Hill, Mission, Bernal Heights, Hayes Valley and Lower Pacific Heights. The 3 districts that dominated luxury condo sales, with 9 to 11 sales each, were the Russian & Nob Hills district (D8), Pacific Heights-Marina (D7), and the South Beach-Mission district (D9). There were also a handful of sales in Noe-Eureka Valley (D5), and a couple in Lake Street-Richmond (D1). (Sales reported by 11/5/17.)


San Francisco Luxury House Sales by Month


Link to Chart: Luxury Condo Sales by Month

San Francisco Luxury Home Sales Trends

————————————————————

Median Home Price Trends by Neighborhood
2005 to Present


Following are 2 charts on houses and one on condos illustrating home price appreciation trends over the past 12 years in selected neighborhoods. We generally picked neighborhoods with greater quantities of sales, but please contact us if you would like information on one not included below. (The highest priced house neighborhoods like Pacific and Presidio Heights – with median prices in the $6m range – have relatively few sales and an enormous range in sales prices, which has a tendency to make the trend lines jump up and down somewhat erratically.)

Neighborhoods with current median house prices under $1.5m have generally
seen smooth, consistent appreciation since the recovery began in 2012.

San Francisco Neighborhood More Affordable Median House Price Trends

Neighborhoods with current median house prices of $1.5m to $3m:
Some of these saw median price dips in 2016, but recovered in 2017

San Francisco Median House Price Trends over $1,500,000

Two-Bedroom Condos – Median Sales Price Trends:
Some SF condo markets saw significant dips in 2016, but recovered in 2017


On the chart below, South Beach would ideally be divided into two distinct neighborhoods, with condos on lower floors of highrises in one, and condos on higher floors in another (distinctly more expensive). Since that is not easily possible, the median price below is a blend of both. To a large degree, all median sales prices are derived from a blend of a wide range of individual sales, but the highrise dynamic is concentrated in the greater South Beach area.

San Francisco Median 2-bedroom Condo Price Trends

————————————————————

SF Neighborhoods & Property Types: Hottest to Coolest Markets


The following charts looks at the various districts of the city by a number of standard statistical measures of supply and demand, or market heat. As has been the case for the last couple years, generally speaking, the greatest pressure of buyer demand has continued to be focused on the more affordable house neighborhoods (affordable by SF standards), such as those in the Sunset/Parkside District.

Note: These are general statistics and small differences between districts or market segments are not particularly significant.


Overbidding Asking Prices

First houses and then condos: The higher the %, the hotter the market.
Some of these percentages are staggeringly high.

San Francisco Neighborhood Overbidding House List Prices

Overbidding in the condo market is not quite as frantic as with houses.

San Francisco Neighborhood Overbidding Condo Prices

Months Supply of Inventory & Average Days on Market

First houses, then condos: The lower the statistics, the hotter the market.

San Francisco Houses - Months Supply of Inventory and Days on Market

San Francisco Inventory and Days on Market - Condos

————————————————————

Hottest to Coolest by Price Segment & Property Type


To a large degree, what is seen below dovetails with the analysis by district above: More affordable home segments are strongest, and the affordable house segment in particular has been crazy feverish. The ultra-luxury condo market is, by far, the softest: Part of this is certainly due to competition from new, luxury condo projects coming on market.

San Francisco Sales Prices to List Prices

San Francisco Market Absorption Rate

San Francisco MSI by Price Range

————————————————————

Seasonality & the SF Homes Market

Advantages to buying during the mid-November to mid-January slowdown


Just before Thanksgiving the market begins to rapidly subside until starting to revive about 7-8 weeks later. Many buyers simply check out during this period, but there are good reasons for staying engaged – mainly the possibility of getting a much better deal. Starting in October and extending into November, sellers begin reducing prices in large numbers as they try to capture the attention of disappearing buyers: Buyers should treat these as brand new listings and take a new look. Competition between buyers drops dramatically during the mid-winter period, and since competitive bidding is the biggest single factor behind higher prices, its decline can mean significant savings. Fewer buyers also means that sellers are often more willing to negotiate: Throw offers in at whatever price you feel is right and see where they go. It is true that the number of new listings coming on markets plunges, but there are still hundreds of listings to consider for those willing to stay in the game.

The dark red lines in the charts below illustrate these big, seasonal market shifts.

Price Reductions Soar in October/November

San Francisco Home Price Reductions

Overbidding Declines

San Francisco Overbidding Seasonality

San Francisco Seasonality Selling over List Price

Average Days on Market Increases
Making sellers more willing to negotiate

San Francisco Market Seasonality - Days on Market

Inventory Drops
But hundreds of listings remain on market

San Francisco Seasonality and Active Listings on Market

Median Home Prices Drop
due to a number of factors, including a reduction in demand

San Francisco Seasonality and Median home prices


All our real estate analyses can be found here: Paragon Market Reports

Link to SF Neighborhood Home Price Tables

Link to our SF luxury house market update

Link to our SF luxury condo market update

Link to our apartment building market report

Please let us know if you have questions or we can be of assistance in any other way. Information on neighborhoods not included in this report is readily available.


————————————————————

It is impossible to know how median and average value statistics apply to any particular home without a specific, tailored, comparative market analysis. In real estate, the devil is always in the details.

These analyses were made in good faith with data from sources deemed reliable, but may contain errors and are subject to revision. It is not our intent to convince you of a particular position, but to attempt to provide straightforward data and analysis, so you can make your own informed decisions. Median and average statistics are enormous generalities: There are hundreds of different markets in San Francisco and the Bay Area, each with its own unique dynamics. Median prices and average dollar per square foot values can be and often are affected by other factors besides changes in fair market value. Longer term trends are much more meaningful than short-term. Late-reported MLS activity may change the statistics for the last month in some charts.


© 2017 Paragon Real Estate Group
  Pota Perimenis–helping you make the right moves in real estate.
Paragon Real Estate Group
www.paragon-re.com/

Pota Perimenis
Lic# 01117624
1400 Van Ness Avenue
San Francisco, CA 94109
Cell 415-407-2595
pperimenis@paragon-re.com
www.sfcityhomes.com


This email was sent to *|EMAIL|*

why did I get this?    unsubscribe from this list    update subscription preferences

*|LIST:ADDRESSLINE|*

*|REWARDS|*

Haunted Spots of the Bay


  Pota Perimenis–helping you make the right moves in real estate.
Paragon Real Estate Group
www.paragon-re.com/

Pota Perimenis
Lic# 01117624
1400 Van Ness Avenue
San Francisco, CA 94109
Cell 415-407-2595
pperimenis@paragon-re.com
www.sfcityhomes.com


This email was sent to *|EMAIL|*

why did I get this?    unsubscribe from this list    update subscription preferences

*|LIST:ADDRESSLINE|*

*|REWARDS|*

Extremely Low Inventory + Continuing Strong Demand = High-Pressure Q3 San Francisco Real Estate Market


Paragon Real Estate Group
 

Paragon Real Estate Group

Extremely Low Inventory + Continuing Strong Demand =
High-Pressure Q3 San Francisco Real Estate Market

October 2017, Q3 Review

————————————————————

Year-over-year, a low inventory homes market dropped even lower, while buyer demand increased to keep the pot boiling in San Francisco through the third quarter, when activity typically cools down between the spring and autumn selling seasons. Since closed sales in each month mostly reflect the market heat in the previous month, when the offers are actually negotiated, we will not have hard data on September until October sales data becomes available in November. One thing we do know is that the number of new listings coming on market in September, which is usually the month of the year with the highest number of new listings, is down considerably from last year – but the number of listings accepting offers increased: Less inventory, but more demand.


Q3 SF Median Home Sales Price Changes
since 2005

San Francisco Q3 Median Home Price Trends


The Q3 SF median house sales price was $1,365,000 and the median SF condo sales price was $1,175,000, considerable year-over-year increases over Q3 2016 prices: 7% and 11% respectively. It is not unusual for median prices to drop from Q2 to Q3, to a large degree due to the seasonal decline in luxury home sales, as well as the typical overall market cooling during the summer, and this occurred for houses, which dropped $75,000 from Q2, similar to drops in previous years. But condos bucked this trend and increased $40,000 quarter to quarter. (Q2 to Q3 change is not illustrated on this chart.) However, while the house inventory in the city has been relatively unchanged for 60+ years, tens of thousands of new condos have come into the market over recent decades, which means that comparing the basket of sales in different periods is not always apples to apples.

————————————————————

Q3 San Francisco Market Trends since 2005
Comparing Q3 statistics for the past 12 years

Q3 New Listings Coming on Market since 2005


New listings hitting the market dropped appreciably year-over-year, doing no favors for buyers competing for homes in Q3 overall, and in September specifically.

San Francisco Q3 New Home Listings on Market

Months Supply of Inventory (MSI), Q3 since 2005


MSI compares demand to supply in one statistic: The lower the MSI, the higher the demand vs. the number of listings available to purchase. The MSI for the SF house market in Q3 2017 was as low as in any Q3 during the past 12 years. For San Francisco condos, the MSI was somewhat higher, but still historically low (but does not include the substantial inventory of new-project condo listings, not listed in MLS). Both are down significantly from Q3 of 2016: 2016 was a cooler market between two very hot markets in 2015 and 2017.

San Francisco Q3 Months Supply of Inventory

Average Days on Market, Q3 since 2005

San Francisco Q3 Days on Market

————————————————————

Overbidding List Prices
by Month since December 2015


In the last 6 years, overbidding percentages have usually declined from the Q2 spring selling season to the quieter Q3 summer market. But not this year: This year overbidding increased in July and September to their highest points since mid-2015.

San Francisco Overbidding Home Prices

————————————————————

Context Economic Factors to Bay Area Housing Markets


We recently completed a report placing the Bay Area housing market within the context of a wide variety of other economic and demographic dynamics, such as population growth, employment and hiring, the stock and the IPO markets, consumer confidence, interest rates, commercial lease rates, , aging homeowners (who sell less frequently), housing affordability and new housing construction. Because conditions, trends and cycles seen among them are, more often than not, closely interrelated. The full report is online here: Economic Context Report.


————————————————————

San Francisco Luxury House & Condo Markets


In September, we issued 2 detailed reports on the San Francisco luxury house market, and the SF luxury condo, co-op and TIC market. Above are 2 of many updated analyses. The complete reports can be found here:

Link to our SF luxury house market update

Link to our SF luxury condo and co-op market update


————————————————————

San Francisco Investment Property Market


After dropping in 2016, SF residential rents appear to be making a small recovery, though the data is still very short-term, and there are thousands of new apartments in the new construction pipeline in the city. This chart is from our latest report on the San Francisco, Alameda and Marin multi-unit residential markets:

Link to our apartment building market report


————————————————————

Trends in Selected San Francisco Neighborhoods


We have dozens of analyses of appreciation trends within specific SF neighborhoods and districts, and below is a sampling, some by median sales price and others by average dollar per square foot value. Some city neighborhoods plateaued or saw declines in values in 2016, when segments of the market distinctly cooled: Generally speaking, these were more expensive home segments, and condo markets most impacted by new-project condos coming on market with major new supply. Affordable house markets largely continued to appreciate in 2016. In 2017 to date, most areas of the city have experienced further appreciation.

Changes in these statistics do not necessarily correspond exactly to changes in fair market value, as they can be affected by a variety of factors. Neighborhoods with relatively few sales and broader ranges in individual sales prices are most prone to fluctuations unrelated to changes in fair market value. Longer-term trends are always more meaningful than shorter term. If you are interested in a neighborhood not included below, please let us know.


Please let us know if you have questions or we can be of assistance in any other way. Information on neighborhoods not included in this report is readily available.

SF neighborhood home price tables: Median Sales Prices by Bedroom Count

All our real estate analyses can be found here: Paragon Market Reports

Over the past 12 months, Paragon sold more San Francisco residential and multi-unit residential real estate than any other brokerage. (Dollar volume sales reported to MLS per Broker Metrics.)


————————————————————

It is impossible to know how median and average value statistics apply to any particular home without a specific, tailored, comparative market analysis. In real estate, the devil is always in the details.

These analyses were made in good faith with data from sources deemed reliable, but may contain errors and are subject to revision. It is not our intent to convince you of a particular position, but to attempt to provide straightforward data and analysis, so you can make your own informed decisions. Median and average statistics are enormous generalities: There are hundreds of different markets in San Francisco and the Bay Area, each with its own unique dynamics. Median prices and average dollar per square foot values can be and often are affected by other factors besides changes in fair market value. Longer term trends are much more meaningful than short-term.


© 2017 Paragon Real Estate Group
 
Pota Perimenis–helping you make the right moves in real estate.
Paragon Real Estate Group
www.paragon-re.com/

Pota Perimenis
Lic# 01117624
1400 Van Ness Avenue
San Francisco, CA 94109
Cell 415-407-2595
pperimenis@paragon-re.com
www.sfcityhomes.com

This email was sent to *|EMAIL|*

why did I get this?    unsubscribe from this list    update subscription preferences

*|LIST:ADDRESSLINE|*

*|REWARDS|*

Is Now A Good Time To Buy?

Typically, the purchase of a new home is one of the largest financial transactions and investments of one’s life. Whatever home you purchase should work for you now—fulfilling your basic housing requirements at an affordable monthly cost.

Ideally, it goes beyond the basics and even beyond being an investment: it is a home you love.


Historically, though it is very difficult to predict cycles, San Francisco real estate has proven to be an excellent investment over the longer term. This is due to the advantages of leverage (the ability to finance much of the purchase); the significant tax benefits of home ownership; economic, demographic and geographic conditions in the city (growing economy and population while the city’s size stays the same); and long-term appreciation trends. Real estate is usually considered one of the best hedges against inflation.


And if one doesn’t “refinance out” increasing home equity (over-encumbering the property with debt), home ownership – as you pay down the principal balance on your mortgage month by month – typically acts as a “forced” savings account that can help build very significant household wealth. In addition, the $250,000/$500,000 tax exemption on home appreciation capital gains can supercharge the financial return when you do sell.

Here are some questions to consider:


  • How long do you plan to own the home you wish to purchase? Buying and selling in the short term always entails more risk, while longer-term ownership (5+ years) typically allows one to ride out a downturn, if one occurs. Looking at any 10 year period over the past 40+ years, it is hard to find one in which substantial appreciation did not occur in San Francisco.  However, if one has to sell during a downturn, the result can be painful.
  • Are current interest rates advantageous for buyers? Low interest rates on a long-term fixed-rate loan make an enormous difference in the ongoing costs of housing (and your ultimate return on investment).


It’s worth noting that with a fixed rate mortgage, one’s housing costs stay relatively stable for the entire period of the loan, while rents typically increase, sometimes very significantly, over time. As the years pass, this can add substantially to the benefit of buying.


  • How important is it to you to own the home you live in, with all that implies—security, control, pride of ownership, the ability to make changes and improvements according to your own tastes and needs?


Any investment has both potential risks and rewards—which only you can weigh according to your financial circumstances and plans, your timeline, and your projection of future economic trends. It is also recommended that you consult with your own financial adviser or CPA. Tax law is subject to change.