Category Archives: San Francisco Real Estate Blog

San Francisco Home Price Appreciation

San Francisco Home Price Appreciation

San Francisco Home Price Appreciation


Paragon Real Estate Group

Paragon Real Estate Group
San Francisco Home Price Appreciation
2011 to 2015, by City Neighborhood


A Paragon Special Report

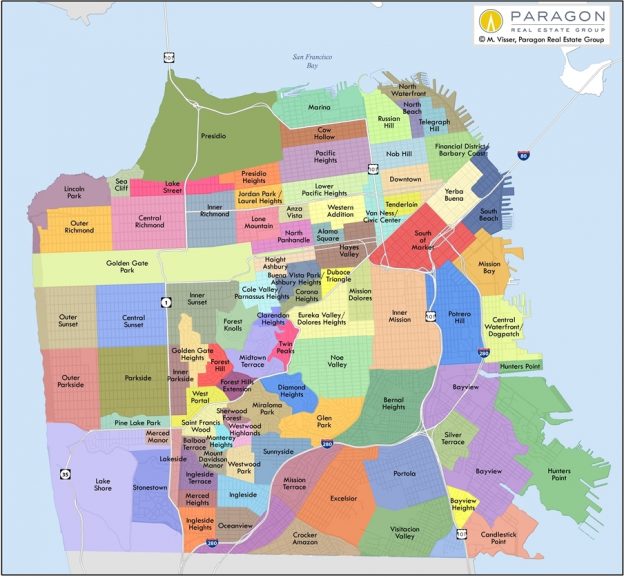
While waiting for the 2016 real estate market to really wake up and start generating useful statistical data, below is a look at San Francisco house and condo values over the past 5 years, broken out by neighborhood. In most districts, the market bottomed out in 2011, and the current market recovery began in 2012. At the bottom of this report is a map of San Francisco neighborhoods.

Important context: Median sales price is a general statistic, often concealing an enormous variety of values in the underlying individual sales. It can be and often is affected by other factors besides changes in fair market value, such as major changes in the distressed property, luxury home, or new-home construction segments. Sometimes median prices fluctuate without great significance: Substantially different groups of homes (larger, smaller, older, newer, etc.) simply sold in the periods being compared. Assessing appreciation by changes in dollar per square foot values, instead of by changes in median sales prices, can sometimes deliver significantly different appreciation rates.


San Francisco HOUSE Price Changes
2011 to 2015


Our full report on SF house price appreciation, which includes a table of every neighborhood with a significant number of sales is here. Scroll down past the charts for the complete table: San Francisco House Price Appreciation


San Francisco CONDO Price Changes
2011 to 2015


Our full report on SF condo price appreciation is here. Scroll down past the charts for the complete table: San Francisco Condo Price Appreciation

We have also updated dozens of charts pertinent to home sales and values in various San Francisco districts. Below is a small sample. If you would like information on a specific neighborhood not included below, please call or email.


Our general survey of the 2015 San Francisco real estate market:
San Francisco Homes Market in 2015

Our recent report on the residential investment property market:
San Francisco Multi-Unit Building Sales


————————————————————————-
These analyses were performed in good faith with data derived from sources deemed reliable, but they may contain errors and are subject to revision. All numbers should be considered approximate.

© 2016, Paragon Real Estate Group
No one knows San Francisco real estate better than Paragon.
Paragon Real Estate Group
www.paragon-re.com/

Pota Perimenis
Lic# 01117624
1400 Van Ness Avenue
San Francisco, CA 94109
Direct 415-738-7075
Cell 415-407-2595
pperimenis@paragon-re.com
www.sfcityhomes.com


To stage or not to stage?


Sellers often ask me this question.

It’s a very understandable question to ask.   Does it really make a difference to buyers if a perfectly nice property is furnished? There is an old adage: “Buyers know what they see, not the way it’s going to be.”  If this is true then staging is recommended.

The idea behind furnishing for marketing purposes is that the furnishings are intended to evoke an emotional response to the property from both buyers and Realtors.  I want to believe that I, a professional who has seen thousands of homes in all kinds of conditions, can appreciate a space and its full potential  when it’s clean, freshly painted, and with nice flooring.   But even I react emotionally to a nicely furnished ‘home’ (staged) compared to a vacant ‘unit’ (unstaged).

My current listing at 500 Masonic #2 allowed me to compare both conditions: staged and unstaged. The unit itself has all the bells and whistles like 2 car parking, a view roof deck, a well laid out, spacious floor plan. It was recently painted, new lighting fixtures installed, new flooring installed, and cleaned from top to bottom.  If any property can look good unstaged, it’s this one.  And it does. It looks great unfurnished!

The sellers and I then had to decide whether  to stage or not.  We reviewed the pros and cons:
Staging takes time and money. Will the furniture make the space look smaller?  Is it necessary to spend thousands of dollars to furnish when it looks perfectly fine in its current condition? etc.

We decided to stage.  I would like to share with you the  before and afters for the living room, master bedroom, and dining area.  Which do you think looks better?  If you have an opinion I’d love to hear it.  Please email me at pperimenis@paragon-re.com


Before and after photos

2018

500Masonic2 lr3

Living room

2029

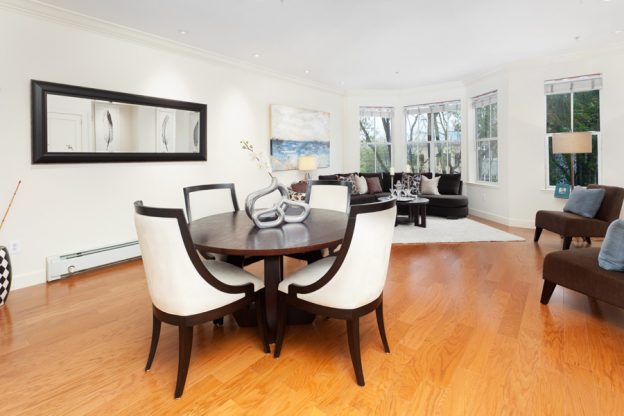
500Masonic2 dr

Dining Room

2031

500Masonic2 2br

Bedroom
2015_Median-SFD-Condo_1993-Present

San Francisco Real Estate Market – 2015

The San Francisco Real Estate Market in 2015

Happy New Year!

Our amazing analyst at Paragon has put together over 20 charts in order to provide an understanding of the SF Market from multiple perspectives.  Unless you are really into charts, it’s a lot of information.  Some of the conclusions to be drawn include:

  • Although there was a slight uptick in interest rates, historically speaking they are super low.
  • The luxury market (over $2 million) is slower than the market under $2 million, as indicated by the lower percentage of listings going into contract (i.e. there are fewer buyers competing for the available inventory).  The chart about SF Market heat by season illustrates this point.
  • Spring remains the best time to sell, based on past market trends.  This is because although there is an increase in supply, the increase in demand usually outpaces it.
  • The average dollar per square foot house and condo values by neighborhood are interesting.

Although I don’t have a chart to illustrate it, I have had several clients thank  me in the past few months for helping them buy their property 10, 15, and sometimes 20 years ago.  They tell me it was the best investment they ever made–either because they can stay in their home into retirement (and in San Francisco), or because they can sell and use the equity built up over the years for their next chapter.  I thank them profusely for sharing their feelings with me.  It is stories like these that give my job meaning and make me feel like I am helping people, which is hugely important to me.  Thank you!


Paragon Real Estate Group

Paragon Real Estate Group
 

The San Francisco Real Estate Market in 2015


Illustrating the Year in 20+ Charts


Architecture, views, probates, penthouses, lofts, TICs, luxury homes, mortgage rates, sales prices, market cycles, and everything else we could think of in a look back on 2015.

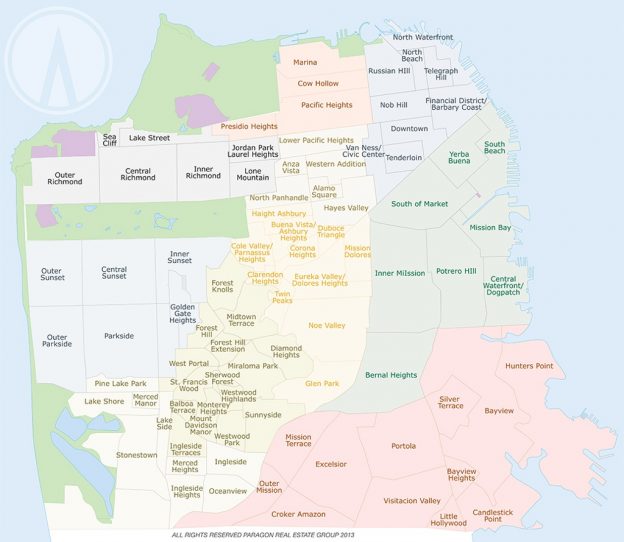
A neighborhood map of San Francisco is included at the bottom of this report for your convenience.


Quarterly Median Price Chart & Monthly Case-Shiller Chart

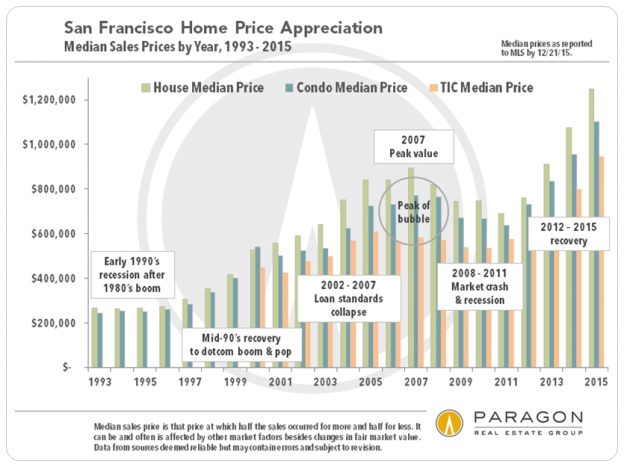
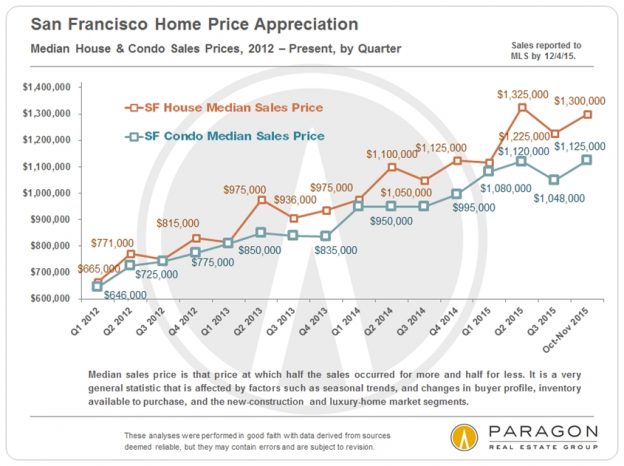
Despite anxiety about interest rates, financial markets, housing affordability, unending international crises, and possibly over-valued high-tech unicorns, the Q4 2015 San Francisco median house sales price, at $1,250,000, is up about 11% from Q4 2014. That dovetails nicely with the S&P Case-Shiller Home Price Index for the Bay Area, which measures appreciation in a different way, but also calculated 11% annual appreciation (through October, its last report). The Q4 condo median price, at $1,125,000, is up 13% year over year, but that is influenced by the greater percentage of more recently built, and more expensive, units in the sales mix.

We have also updated our popular price maps of San Francisco neighborhoods and the greater Bay Area: Home Price Maps

——————————————————————–


San Francisco has seen 3 extended periods of home construction: The first ran from the Gold Rush to the 1906 earthquake, when 28,000 buildings were destroyed. The second went from the post-quake rebuilding, with the construction of thousands of Edwardian houses and multi-unit buildings, through the big WWII population surge. Many districts such as the Marina and Sunset/Parkside were built out in the period from 1920 to 1950, with Spanish Mediterranean (in many variations), Marina-style and Art Deco being common architectural styles.

The city population then went into major decline during the subsequent 3 decades and construction plunged. The third era of homebuilding is all about new condo construction, which began around 1980, ebbed and flowed dramatically with the economy, and is currently booming once again.

——————————————————————–


A look at a few of the distinctive niches of the market.

——————————————————————–


San Francisco is famously a city of gorgeous views. For the simple reason of verticality, more condos have views and, generally speaking, more panoramic and spectacular views, than houses. Of course, many other lovely views add to SF home value as well: sweeping city views; park views; marina views; views of Alcatraz, Marin and Mt. Tamalpais; and of the East Bay and Mt. Diablo. A few lucky (typically, very affluent) condo owners have sensational views from the windows on all 4 sides of their high altitude units.

——————————————————————–


After being bludgeoned in 2015 by thousands of articles, predictions and warnings regarding interest rates, here is a look at how much they actually changed over the course of the year: Approximately one seventh of one percent. Per recent signals from the Fed, presumably mortgage rates will rise in 2016, but expectations over the last 6 years have been confounded far too often to be sure. Significant increases would certainly worsen the affordability equation for homebuyers financing their purchases.

——————————————————————–

Seasonality: Waiting for Spring


The 2 charts above illustrate the extreme seasonality of the market, both in the numbers of new listings coming on market, and the percentage of listings that accept offers (a measurement of supply vs. demand). The second chart also shows that the market for homes under $2 million has been hotter than the luxury home market: There are fewer buyers at the very high end, and luxury homes are also most prone to significant overpricing.

The spring selling season, which actually started in February last year, is typically the most feverish, and this is especially true for luxury homes: Notice, in the 2nd chart, the huge spike in demand for luxury homes last spring.

——————————————————————–

Average Dollar per Square Foot Values

——————————————————————–


Luxury home sales hit new peaks in spring 2015, but with the stock market volatility in late August and September, the market softened, inventory grew (to its highest point ever) and sales dropped by about 17% in October, year over year. (Affluent buyers and sellers are most influenced by financial market volatility.) However, the stock market then recovered and stabilized in October and buyer confidence improved, which is reflected in the year over year increase in sales that occurred in November and December.

Remember that sales in one month generally reflect the state of the market 3 to 6 weeks earlier, when the sale terms were negotiated: Stock market angst in September meant a weaker luxury home market in October; the stock market recovery in October brought about a stronger real estate market in November and December. Q4 2015 sales ultimately ended slightly up from Q4 2014.

Charts: Luxury House Sales by District & Luxury Condo Sales by District

——————————————————————–

Details, Amenities & Size


The above details are as described in MLS by listing agents, so the numbers are very approximate. Also note that what most people might see as a unit above a laundromat, an enthusiastic listing agent might see as a rarely available luxury penthouse.


One of the reasons the Pacific Heights district has by far the highest house prices in the city is that its average house size is so much larger. However, its mansions also command a very high dollar per square foot value, as seen in one of the earlier charts.


——————————————————————–

The sales of condo shall continue to make up a larger and larger share of overall home sales in San Francisco, as new condo construction continues apace. (Condos also turn over more often than houses.) Very few new houses are built in the city and they are usually big, high-tech, beautiful and costly.

——————————————————————–

Where the Most Home Sales Occur

——————————————————————–


San Francisco is very much a boutique market for multi-unit buildings: Our apartment buildings are generally much smaller, older and, for that matter, more gracious than those found in the suburbs. These properties are often at the heart of fierce controversies pertaining to rent control, tenants’ rights, tenant evictions, and condo conversion rules. There has been an immense increase in market rate rents over recent years (SF is the most expensive rental market in the country), though rules restrict increases for existing tenants of buildings built before 1979 (i.e. almost all of our apartment buildings).


The tenancy-in-common unit with an exclusive right to occupy, aka the TIC, is a property type rarely found outside of San Francisco. It was originally created as a way for sellers of multi-unit properties to get significantly more money: The individual unit sales adding up to more than the purchase of the entire building by one buyer. However, they also provided a lower cost alternative for homebuyers, since TICs typically cost 10% to 15% less than comparable condos. (The TIC phenomenon also generated significant legal fees for the lawyers who came up with the idea.) Because of changes in tenant eviction law and condo conversion rules, financing and other issues, the number of TIC sales has plunged since its peak in 2007. On the other hand, some TIC units are now selling for jaw-dropping prices: In 2015, 4 sold for over $5 million. The median TIC sales price last year was $947,000.

Map of San Francisco Neighborhoods

Please call or email if you have any questions.

————————————————————————–


Some 2015 totals are projections based on MLS data available within the month of December. These analyses were performed in good faith with data derived from sources deemed reliable, but they may contain errors and are subject to revision. All numbers should be considered approximate.

© 2015-2016, Paragon Real Estate Group
Wishing you and yours a safe, healthy, prosperous and happy New Year.
Paragon Real Estate Group
www.paragon-re.com/

Pota Perimenis
Lic# 01117624
1400 Van Ness Avenue
San Francisco, CA 94109
Direct 415-738-7075
Cell 415-407-2595
pperimenis@paragon-re.com
www.sfcityhomes.com


December San Francisco Market Update


Paragon Real Estate Group

Paragon Real Estate Group
 

San Francisco Real Estate Report


Heading into the Holiday Slowdown
after an Interesting Autumn Market


December 2015 Update, including 11 custom charts

Median home prices, over-bidding, housing affordability,
luxury home sales, the new-home construction pipeline,
and comparing the Shanghai and S&P 500 stock indices

————————————————————


Median sales prices in October and November jumped back up to levels similar to the spring peak selling season. It’s important to remember that median prices are not a perfect reflection of changes in fair market value: They often fluctuate due to seasonal inventory and buyer-profile trends, as well as issues such as an influx of new-construction listings. It is the longer-term trend that is most meaningful – however we can say with confidence that there was clearly no significant “crash” in prices this past autumn.


One indication of the heat of the market is the extent to which sales prices are bid up over asking prices. As is not untypical, the market becomes less competitive in November as it heads into the winter holidays. Still, an average sales price 6% over asking price would be considered crazy-hot in any other market in the country (though one also has to adjust for the fact that serious underpricing has become a not uncommon listing strategy in the SF market).


This chart based on S&P Case Shiller Home Price Index data illustrates the seasonality of home price appreciation in the past 4 years: surging in our feverish spring selling seasons, and then generally plateauing through the rest of the year. Note that Case-Shiller looks at home prices in a totally different way than median sales price trends, and probably reflects changes in fair market value more accurately. Case-Shiller Index numbers refer back to a January 2000 value of 100, thus the current Index reading for higher-priced Bay Area homes of 217 signifies home prices 117% above January 2000.

As we enter the winter holiday market slowdown, the next real indication of the direction of the market will come in the first quarter of 2016. Will spring 2016 repeat the overheated, high demand/ low supply frenzies of previous springs or has the market finally reached a longer term plateau or even an affordability inflection point? We shall soon know more.

Our full report is here: S&P Case-Shiller Index for SF Metro Area 


In 2015 YTD, the dominant price segment for home sales in San Francisco was $1,000,000 to $1,499,000. As seen in the first chart above, the median sales prices for both condos and houses fall within this range. Note the change from just two years ago.

————————————————————

San Francisco Luxury Home Market


The high-end home market is the most seasonal segment in the city (as well as the most sensitive to sudden, large, negative movements in the financial markets). Market activity starts to plunge in November, hits its nadir in December, begins to pick up in the first quarter and then usually hits its peak in spring. Much of the center of gravity in the luxury market has been shifting in recent years from the city’s prestige northern neighborhoods to other districts of the city, such as the greater Noe Valley area and the South Beach/Yerba Buena district. This is not to say that the northern districts are not still both very expensive and considered highly desirable, and the greater Pacific Heights area still dominates the market for the most expensive houses in the city, i.e. those selling for $5m and more.

————————————————————


After the semi-hysteria – already half forgotten – that erupted in late August and September regarding the Chinese stock market and its impact on the U.S. stock market and economy, and possibly the Bay Area housing market, we thought it interesting to take a look back at how it has played out so far.

————————————————————


It is widely expected that the Fed will raise interest rates in December, probably by some minimal increment, but for the time being, as of the first week of December, rates have remained below 4%.

————————————————————


In November, we issued two mini-reports, one on Bay Area housing affordability and another on San Francisco new housing construction. Below are the featured charts and links to the full articles.


Bay Area Housing Affordability & Market Corrections

San Francisco New-Housing Pipeline Update


Information regarding San Francisco neighborhood prices and trends can be found here: San Francisco Neighborhood Values

————————————————————


These analyses were made in good faith with data from sources deemed reliable, but they may contain errors and are subject to revision. Statistics are generalities and all numbers should be considered approximate. How any median or average statistic applies to a particular home is unknown without a specific comparative market analysis. Sales statistics of one month generally reflect offers negotiated 3 – 6 weeks earlier. Short-term fluctuations are much less meaningful than longer-term trends.

© 2015 Paragon Real Estate Group
No one knows San Francisco real estate better than Paragon.
Paragon Real Estate Group
www.paragon-re.com/

Pota Perimenis
Lic# 01117624
1400 Van Ness Avenue
San Francisco, CA 94109
Direct 415-738-7075
Cell 415-407-2595
pperimenis@paragon-re.com
www.sfcityhomes.com


Luxury Homes Cool. Affordable still hot. November 2015 market report


Paragon Real Estate Group

Paragon Real Estate Group
 

San Francisco Real Estate

Luxury Home Segment Cools Down

“Affordable” Homes Market Remains Competitive


November 2015 Report
including 11 Custom Charts

————————————————————

San Francisco led the Bay Area and the nation when its real estate recovery began in early 2012. Within the city itself, the more affluent neighborhoods led the rebound from the 2008 – 2011 recession and saw the highest rates of home price appreciation. That dynamic began to shift in 2014, when the more affordable neighborhoods began to take the lead in demand and in appreciation. All price segments in San Francisco have cooled off from the overheated frenzy of the spring 2015 selling season – this cooling is a common seasonal phenomenon – but while lower and mid-priced homes in the city have continued to remain solidly in “seller’s market” territory, in the luxury home segment, the dynamic between buyers and sellers has fundamentally shifted, at least for the time being.

A number of reasons may explain this: Firstly, the affluent are much more invested in the stock market than other groups, and the volatility of late August, early September may have encouraged more wealthy homeowners to sell (before things might possibly get worse), and more wealthy homebuyers to postpone buying until things clarified. As of very early November, the S&P 500 has regained its lost ground from August, so this effect may fade. Secondly, it’s certainly possible that sellers and listing agents have finally pushed the envelope on prices a little too far: San Francisco’s high prices have clearly motivated some buyers to look at options outside the city (which has helped pressurize the markets of other counties). Last but not least, more and more luxury condos are being built in San Francisco: Growing supply not only gives buyers more options and more negotiating room, but it decreases the urgency to write strong offers quickly or the motivation to compete with other buyers.

However, the luxury home market hasn’t “crashed”: there are still high-end homes selling very quickly for very high prices amid competitive bidding. But it has markedly cooled and the number of luxury home listings in San Francisco hit a new high in October, so correct pricing has becomes increasingly vital. It remains to see if this change is just a transitory market blip – such blips are not uncommon in financial or real estate markets – or the beginning of a longer term reality.

————————————————————

Median Sales Price by Month


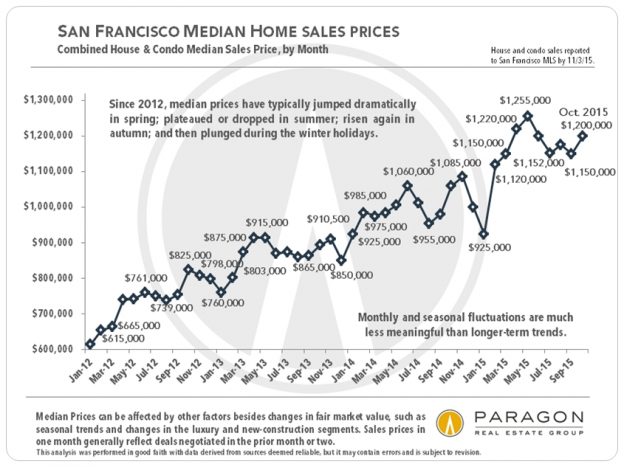
Even with the general cooling in the market since spring and the significant slowdown in higher end home sales, the overall median sales price for houses and condos bounced back up to $1,200,000 in October. Median prices are impacted by seasonal trends: typically peaking in the spring, dropping in the summer, up again in the autumn and then plunging during the winter holidays. This has more to do with inventory than with changes in fair market value. Short-term fluctuations are not particularly meaningful: It is the longer-term trend that gives a sense of what’s going on in the market.

For houses alone, the median sales price in October was $1,300,000 and for condos, it was $1,100,000.

————————————————————

Supply & Demand Statistics

by Price Segment, October 2015


Months Supply of Inventory (MSI) is a classic measurement of supply and demand, calculating the time it would take to sell the existing inventory of homes for sale at the current rate of market activity. The lower the MSI, the greater the demand as compared to the supply, i.e. the hotter the market. The house market in San Francisco has been stronger than the condo market since the recovery began – though the condo market has been crazy hot as well – because the supply of houses is more limited and is dwindling as a percentage of sales because virtually no new houses are being added to inventory. However, new condos are being built in quantity. This chart above illustrates the dramatic difference in the markets for homes up to the median price ($1.3 million for houses, $1.1 million for condos) and in the next price segment higher, versus the luxury home segment, defined here as houses selling for $2,000,000+ and condos for $1,500,000+. (By this definition, luxury sales currently make up about 20% of San Francisco’s home sales.)

Because SF has been so hot for so long, we’ve adjusted the thresholds for what MSI readings define “seller’s market” and “buyer’s market” to better reflect the psychology of the current market.


Luxury Home Listings for Sale


As mentioned earlier, the number of high-end house and condo listings hit all-time highs in October, while sales numbers are well below levels hit in the previous 2 years. Even more so than the general market, the luxury segment is dramatically affected by seasonality and typically goes into deep hibernation from Thanksgiving to mid-January. Having so many active listings on the market just prior to the winter holiday doldrums is one of the reasons why we designate the luxury-home segment as currently having moved into “buyer’s market” territory.

The Luxury Home Market: Months Supply of Inventory

Year over Year over Year Comparisons


This chart above illustrates the change in the luxury home market supply and demand balance over the past three Octobers. As a further point of context to what has happened in the past year, during the feverish market of this past spring, the MSI for luxury houses hit a low of 1.6 months of inventory and the MSI for luxury condos hit a low of 1.7 months. Since 2012, spring has consistently been the hottest, most competitive, selling season of the year and most home price appreciation has occurred during that time.

————————————————————

4 Neighborhood Snapshots


Much more information regarding SF neighborhood prices and trends can be found here: San Francisco Neighborhood Values

————————————————————

Average Asking Rents in San Francisco


The real estate market has been challenging for homebuyers these past few years, but for anyone looking to rent a home in the city, it has been distinctly more difficult financially. Homebuyers have the benefit of historically low interest rates, multiple tax advantages and, hopefully, substantial appreciation gains over time; renters enjoy none of those advantages (though admittedly there can be long-term benefits to rent control for renters that qualify). Even with the big jump in home prices over the past 4 years, factoring in the 35% – 40% decline in interest rates and adjusting for inflation, the ongoing monthly cost of homeownership (for someone putting 20% down) is roughly the same as it was in 2007. But average monthly asking rents in the city have surged over 50% during the same period.

This has made rental property ownership an increasingly lucrative proposition, which we discuss in more detail in our last Commercial Brokerage report: Bay Area Apartment Building Market

————————————————————

Median Household Incomes

In Selected San Francisco Zip Codes

By Bay Area County


Additional demographic analyses from previous reports can be found here: San Francisco & Bay Area Demographics and Bay Area Affordability

————————————————————


These analyses were made in good faith with data from sources deemed reliable, but they may contain errors and are subject to revision. Statistics are generalities and all numbers should be considered approximate. How any median or average statistic applies to a particular home is unknown without a specific comparative market analysis. Sales statistics of one month generally reflect offers negotiated 4 – 6 weeks earlier.

© 2015 Paragon Real Estate Group
No one knows San Francisco real estate better than Paragon.
Paragon Real Estate Group
www.paragon-re.com/

Pota Perimenis
Lic# 01117624
1400 Van Ness Avenue
San Francisco, CA 94109
Direct 415-738-7075
Cell 415-407-2595
pperimenis@paragon-re.com
www.sfcityhomes.com


Monthly Report for New Condo Developments- October 2015

The following report contains sales information and updates for actively selling developments with 20+ Market Rate units.

400 Grove
6 Mint
Arden
Fulton 555
Lumina
LuXe
Mission@1875
Onyx on the Park
Park Lane
Rockwell
Seventy2 Townsend
Summit 800
The San Francisco Shipyard – Phase II
Vida
* Sorted in alphabetical order Screenshot_1