


|
||||||||||||||
|
||||||||||||||


|
||||||||||||||
|
||||||||||||||
The San Francisco Luxury Home Market
Homes of $2 Million & Above
Auto-Updating Market Analytics
The bar charts compare year-over-year data, going back 2 years, for the latest month. The line charts track monthly data over a period of 3 to 5 years. Note that it can take 7 to 15 days after a month’s end for agents to enter in transaction data pertinent to the month in question, so statistics for the latest month can sometimes change significantly as this data is added to calculations.

Auto-Updating Market Analytics
Seasonality plays a significant role in luxury real estate statistics as the market ebbs and flows during active and less active sales seasons. Typically, the market is most active in the spring and fall, and much slower in the summer and, especially, the mid-winter holidays.
New Listings Coming on Market, by Month
September is usually the single biggest month for new high-end home listings.
Spring is typically the most active season for new listings.
New listing activity plunges during the mid-summer and mid-winter holidays.
Total Number of Active Listings for Sale during Month
Number of Listings Accepting Offers, by Month
Number of Sales, by Month
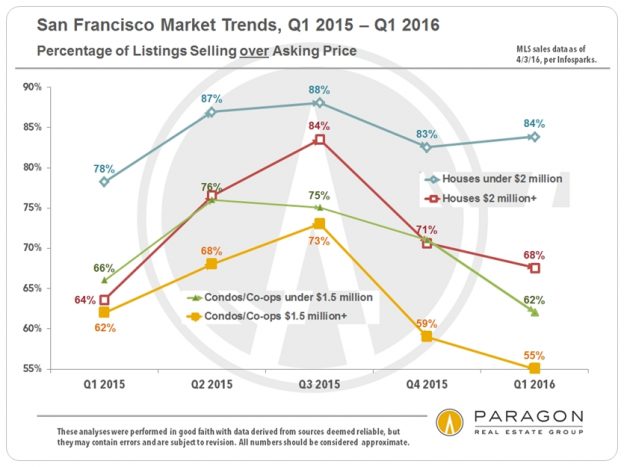
Percentage of Listings Selling for over Asking Price, by Month
Median Percentage of List Price Achieved on Sale
Over 100% usually signifies competitive overbidding;
under 100% signifies more aggressive buyer negotiation.
Median Dollar per Square Foot (upon Sale)
3-Month Rolling Average
Months Supply of Inventory (MSI), by Month
The lower the MSI, the greater the buyer demand as compared
to the inventory of listings available to buy.
Median Days on Market before Acceptance of Offer
3-Month Rolling Average
Expensive Home Sales by San Francisco District & Neighborhood
Note that these charts using differing price points for the “luxury home” designation.


Other reports you might find interesting:
Market Analytics for General SF Market
30+ Years of San Francisco Real Estate Cycles
San Francisco Neighborhood Affordability
10 Big Factors behind the San Francisco Real Estate Market
Bay Area Apartment Building Market
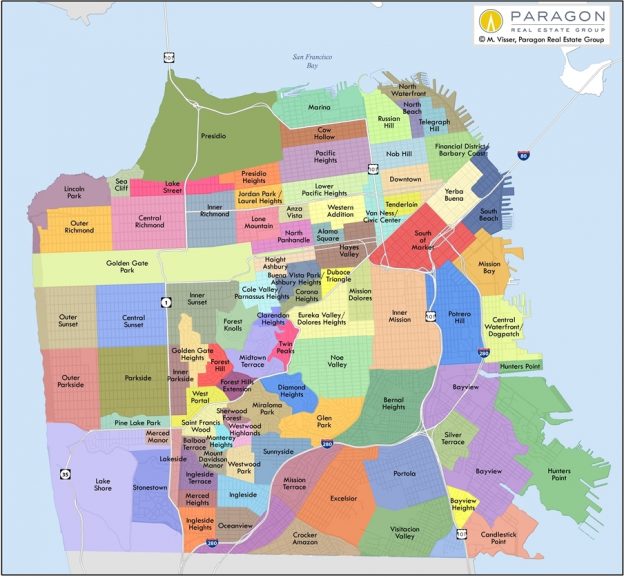
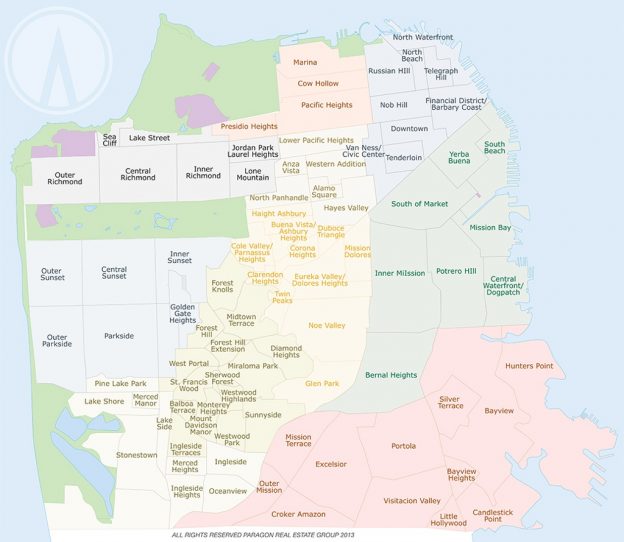
Link to San Francisco Neighborhood Map
It is the relationship between supply and demand that defines the state of the market. Looking at one statistic such as the number of sales, without comparing it to how many listings were available to purchase, may give a distorted view of market conditions. Some statistics, such as months supply of inventory take both supply and demand into account. Last but not least, short-term statistics sometimes fluctuate without great meaningfulness - longer-term trends are always most meaningful.
Sales data usually reflects market activity, i.e. when a new listing comes on market and offers are negotiated, occurring 4 to 8 weeks before the sale date. Thus, for example, sales in June mostly reflect new listings and offers negotiated in late April and May.
San Francisco House & Condo Markets Diverge
Non-Luxury House Market Remains White Hot
Supply & Demand Balance Shifts in Condo Market
Luxury Condo Market Continues to Cool
April 2016 report, including 15 custom charts
In the first quarter of 2016, various market segments in the city began to trend in significantly different directions. Houses, especially those below $2 million, are still often selling in a frenzy of bidding: Recent reports of houses selling with 5, 10 or more competing offers are not uncommon, especially in neighborhoods considered more affordable (by San Francisco standards). Demand remains very high, supply remains extremely low, and new house construction is virtually nil.
|
|||||||||||||||
|
|||||||||||||||
San Francisco Real Estate Market Report March 2016, including 13 custom charts.
|
|||||||||||||||
|
|||||||||||||||
San Francisco Neighborhood Affordability
Where a buyer is most likely to find a home in the price segment they’re looking in, whether under $1 million or over $5 million.
A city neighborhood map is provided at the bottom of this analysis.
The charts below are based upon San Francisco home sales reported to MLS in the 10 to 12 months through February 15, 2016, breaking out the neighborhoods with the most sales within given price points. Other neighborhoods not listed did have smaller numbers of sales within given price segments.
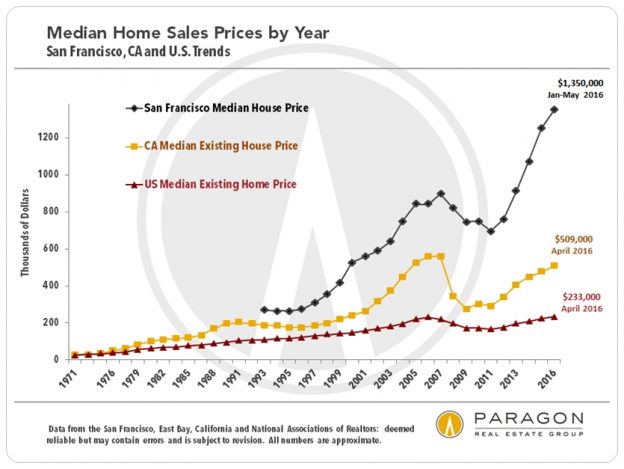
The overall median HOUSE price in the city in the 4th quarter of 2015 was $1,250,000, so the under million-dollar house is becoming increasingly less common. The vast majority of house sales in this price segment now occur in a large swath of neighborhoods running across the southern border of the city, which are by far its most affordable house markets: from Bayview through Portola, Excelsior, Visitacion Valley and Crocker Amazon, to Oceanview and Ingleside.
The chart’s horizontal columns reflect the number of sales of houses with at least 2 bedrooms, with parking, for under $1 million, while the median sales prices noted are for all 2BR house sales during the period. Median price provides a good idea of overall neighborhood house prices.

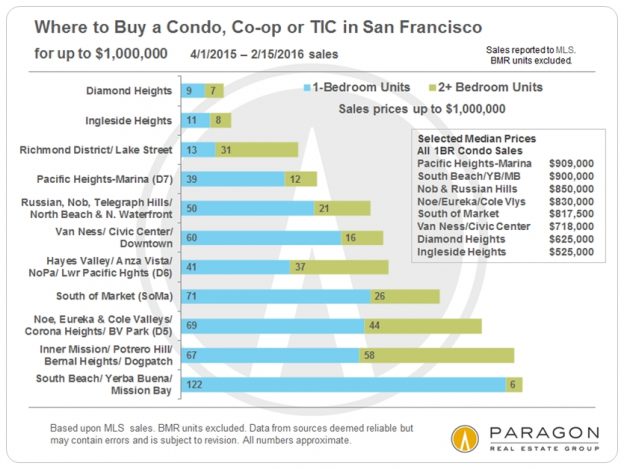
Where to Buy a CONDO, CO-OP OR TIC for under $1 million
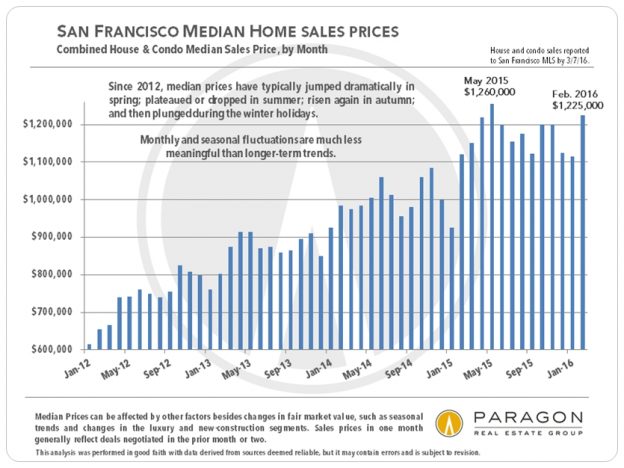
The overall SF median condo price in the 4th quarter of 2015 was about $1,100,000, and sales under $1m still occur in almost every area of the city that features these property types – but a studio unit in Russian Hill may cost as much as a 2-bedroom condo in Diamond Heights.
Of these property types, condos make up about 90% of sales, stock co-op apartments 1 to 2%, with TICs making up the balance. TICs typically sell at a significant discount (10% - 20%) to similar condos.
The horizontal columns reflect the number of sales under $1m broken out by 1-bedroom and 2-bedroom units. The box of median sales prices is just for 1BR units, again simply to give an idea of relative values between neighborhoods.

Spending $1 Million to $1.5 Million in San Francisco
The horizontal columns reflect the number of sales, with the average dollar per square foot values for the homes in this price range noted alongside.


Buying a HOUSE for $1.5 million to $2 million

Buying a HOUSE for $2 million to $2.5 million
Buying a LUXURY HOME in San Francisco
Luxury HOUSE Sales
San Francisco Neighborhood Map

Other updated reports you might find interesting:
Our Most Recent Market Analyses
30+ Years of San Francisco Real Estate Cycles: This is by far the most popular article on our website – for 3 years running.
San Francisco Market Overview Analytics: Interactive, auto-updating charts for all the standard real estate statistics – median sales price, average dollar per square foot, days on market, months supply of inventory, listings for sale, and so on.
San Francisco District Sales Overview: A breakdown of sales by price segment for 14 different sections of the city.
10 Big Factors behind the San Francisco Real Estate Market: A review of the major economic, political and demographic issues underlying the city’s current market.
These analyses were made in good faith with data from sources deemed reliable, but they may contain errors and are subject to revision. Statistics are generalities and how they apply to any specific property is unknown without a tailored comparative market analysis. Sales statistics of one month generally reflect offers negotiated 4 – 6 weeks earlier. Median sales prices often change with even the smallest change in the period of time or parameters of the analysis. All numbers should be considered approximate.
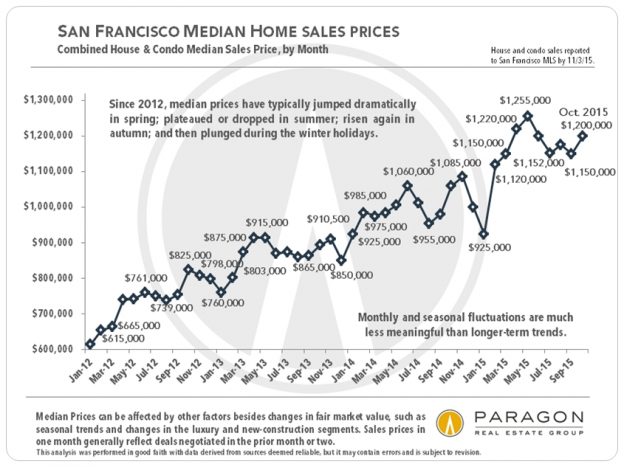
San Francisco Home Price Appreciation
|
||||||||||||||
|
||||||||||||||
January 2016, Paragon Commercial Brokerage
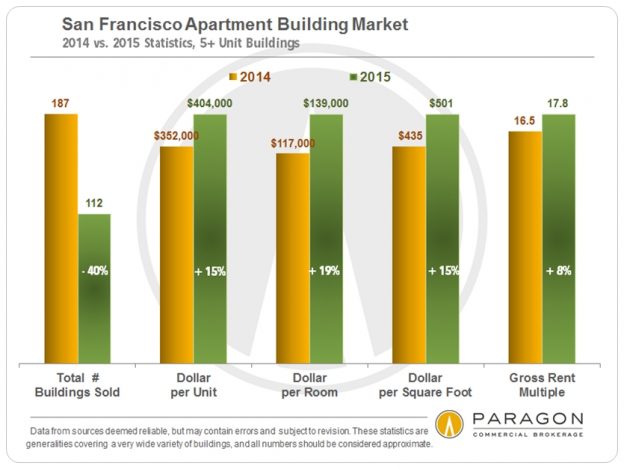
Some charts below apply specifically to smaller, 2-4 unit buildings, others to larger, 5+ unit properties, and some to both. Each segment has distinct market dynamics. The first 2 charts illustrate the year over year decline in sales volume, but the continuing increase in values.


As seen above, 2015 saw a small drop in the sales of smaller, 2-4 unit apartment buildings in San Francisco, similar to that seen in the homes market. (It is not unusual for these buildings to have an owner occupier and/or be sold to buyers planning to occupy). There was a much bigger decline in the sales of larger, 5+ unit, investment properties: The latter drop reflected more a decline in portfolio sales (one owner, sometimes a financial institution, selling multiple properties) and an increased reluctance of owners to sell, than, so far, any substantial decline in buyer demand. Indeed, multiple offers on attractive listings remained common, the average sales price for 5+ unit buildings was almost 4% above asking price (7% for 2-4 unit buildings), and values continued to rise in 2015.
With low interest rates and soaring rents, many SF apartment buildings have become cash-generating machines, and prospective sellers would be challenged to find comparable returns in other investments. This reduces the motivation to sell and cash out. Furthermore, owners who might typically sell in order to buy larger buildings for better economies of scale via a 1031 exchange are daunted themselves by the difficulty of finding suitable upleg properties within the tight time constraints of tax law.
The first 4 to 6 weeks of the year are a slow period in real estate and the next tangible indication of market direction will come after the market begins to wake up in late-winter/ early spring.
--------------------------------------------------------------------


Prices, Values & Appreciation Trends


By San Francisco Neighborhood and District


--------------------------------------------------------------------
Supply & Demand

--------------------------------------------------------------------
Residential Rent Trends & Comparisons
In the first chart below, note that San Francisco rents fell far more after the dotcom bubble popped in 2001, and the resulting loss of thousands of high-tech jobs (see employment graph further below), than after the much larger, financial-markets crash of 2008. There is much vehement disagreement right now as to whether there are or are not meaningful parallels between the current high-tech boom and the earlier dotcom boom.


--------------------------------------------------------------------
San Francisco Employment

--------------------------------------------------------------------
Interest Rate Trends

Q4 2015 Sales of 5+ Unit Apartment Buildings

Please contact me if you would like further details on any of the sales listed,
or on properties currently available to purchase.
--------------------------------------------------------------------
Apartment Building Sales by Broker

All information is from sources deemed reliable, but may contain errors, is not warranted and subject to revision. Statistics are generalities that typically disguise an immense variety of specifics in the individual, underlying sales. Numbers should be considered estimates and approximations, and how these statistics apply to any particular property is unknown without a specific comparative market analysis.
Median Home Prices, Reflecting MLS Sales Reported 4/1/15 – 12/7/15
|
||||||||||||||
|
||||||||||||||
|
||||||||||||||||
|
||||||||||||||||


Pota Perimenis is committed to providing an accessible website. If you have difficulty accessing content, have difficulty viewing a file on the website, or notice any accessibility problems, please contact us at (415) 407-2595 to specify the nature of the accessibility issue and any assistive technology you use. We strive to provide the content you need in the format you require.


