Year-over-year, a low inventory homes market dropped even lower, while buyer demand increased to keep the pot boiling in San Francisco through the third quarter, when activity typically cools down between the spring and autumn selling seasons. Since closed sales in each month mostly reflect the market heat in the
previous month, when the offers are actually negotiated, we will not have hard data on September until October sales data becomes available in November. One thing we do know is that the number of new listings coming on market in September, which is usually the month of the year with the
highest number of new listings, is down considerably from last year – but the number of listings accepting offers
increased: Less inventory, but more demand.
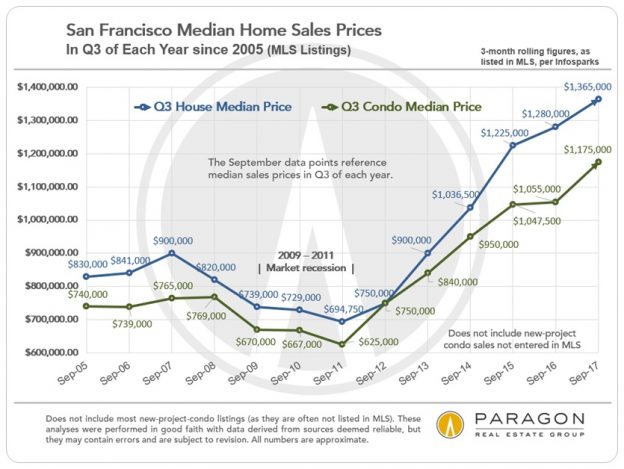
Q3 SF Median Home Sales Price Changes
since 2005

The Q3 SF median house sales price was $1,365,000 and the median SF condo sales price was $1,175,000, considerable year-over-year increases over Q3 2016 prices: 7% and 11% respectively. It is not unusual for median prices to drop from Q2 to Q3, to a large degree due to the seasonal decline in luxury home sales, as well as the typical overall market cooling during the summer, and this occurred for houses, which dropped $75,000 from Q2, similar to drops in previous years. But condos bucked this trend and
increased $40,000 quarter to quarter. (Q2 to Q3 change is not illustrated on this chart.) However, while the house inventory in the city has been relatively unchanged for 60+ years, tens of thousands of new condos have come into the market over recent decades, which means that comparing the basket of sales in different periods is not always apples to apples.
————————————————————
Q3 San Francisco Market Trends since 2005
Comparing Q3 statistics for the past 12 years
Q3 New Listings Coming on Market since 2005
New listings hitting the market dropped appreciably year-over-year, doing no favors for buyers competing for homes in Q3 overall, and in September specifically.

Months Supply of Inventory (MSI), Q3 since 2005
MSI compares demand to supply in one statistic: The lower the MSI, the higher the demand vs. the number of listings available to purchase. The MSI for the SF house market in Q3 2017 was as low as in any Q3 during the past 12 years. For San Francisco condos, the MSI was somewhat higher, but still historically low (but does not include the substantial inventory of new-project condo listings, not listed in MLS). Both are down significantly from Q3 of 2016: 2016 was a cooler market between two very hot markets in 2015 and 2017.

Average Days on Market, Q3 since 2005

————————————————————
Overbidding List Prices
by Month since December 2015
In the last 6 years, overbidding percentages have usually declined from the Q2 spring selling season to the quieter Q3 summer market. But not this year: This year overbidding
increased in July and September to their highest points since mid-2015.

————————————————————
Context Economic Factors to Bay Area Housing Markets

We recently completed a report placing the Bay Area housing market within the context of a wide variety of
other economic and demographic dynamics, such as population growth, employment and hiring, the stock and the IPO markets, consumer confidence, interest rates, commercial lease rates, , aging homeowners (who sell less frequently), housing affordability and new housing construction. Because conditions, trends and cycles seen among them are, more often than not, closely interrelated. The full report is online here:
Economic Context Report.
————————————————————
San Francisco Luxury House & Condo Markets


In September, we issued 2 detailed reports on the San Francisco luxury house market, and the SF luxury condo, co-op and TIC market. Above are 2 of many updated analyses. The complete reports can be found here:
Link to our SF luxury house market update
Link to our SF luxury condo and co-op market update
————————————————————
San Francisco Investment Property Market

After dropping in 2016, SF residential rents appear to be making a small recovery, though the data is still very short-term, and there are thousands of new apartments in the new construction pipeline in the city. This chart is from our latest report on the San Francisco, Alameda and Marin multi-unit residential markets:
Link to our apartment building market report
————————————————————
Trends in Selected San Francisco Neighborhoods
We have dozens of analyses of appreciation trends within specific SF neighborhoods and districts, and below is a sampling, some by median sales price and others by average dollar per square foot value. Some city neighborhoods plateaued or saw declines in values in 2016, when segments of the market distinctly cooled: Generally speaking, these were more expensive home segments, and condo markets most impacted by new-project condos coming on market with major new supply. Affordable house markets largely continued to appreciate in 2016. In 2017 to date, most areas of the city have experienced further appreciation.
Changes in these statistics do not necessarily correspond exactly to changes in fair market value, as they can be affected by a variety of factors. Neighborhoods with relatively few sales and broader ranges in individual sales prices are most prone to fluctuations unrelated to changes in fair market value. Longer-term trends are always more meaningful than shorter term. If you are interested in a neighborhood not included below, please let us know.


Please let us know if you have questions or we can be of assistance in any other way. Information on neighborhoods not included in this report is readily available.
SF neighborhood home price tables: Median Sales Prices by Bedroom Count
All our real estate analyses can be found here: Paragon Market Reports
Over the past 12 months, Paragon sold more San Francisco residential and multi-unit residential real estate than any other brokerage. (Dollar volume sales reported to MLS per Broker Metrics.)
————————————————————
