————————————————————
Where to Look to Buy
for the Price You Want to Pay
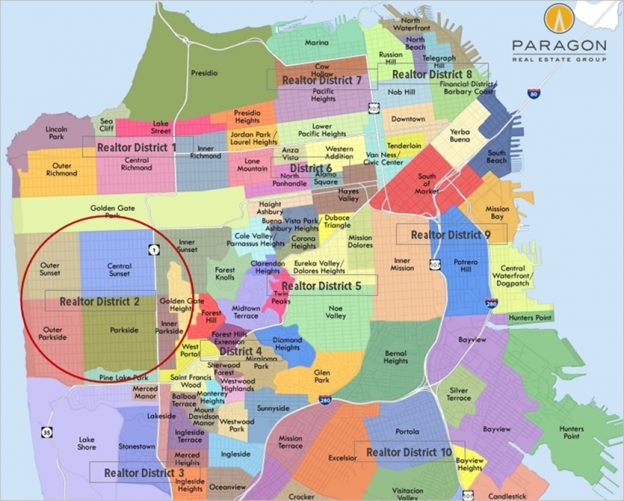
Below are 3 charts from our updated 9-chart report that breaks down which neighborhoods one is most likely to find a home within a specific price range, whether house or condo. The report covers homes from under $1 million to over $5 million.
If you want to buy a house under a million dollars, one is now mostly limited to the neighborhoods that run across the southern border of San Francisco.


The full report is here:
San Francisco Neighborhood Affordability
What Can I Buy for $1,200,000 or $2,000,000?
Below are illustrations of the wide range of homes (and, to some degree, lifestyles) one might buy at two different price points in the city. The higher a home is located on the vertical axis of the charts, the greater its square footage. (Note that the bathroom specifications can be a little screwy, for example 1.3 or 1.7 baths, because these are
averages of homes sold at these approximate price points.)
$1,200,000 is approximately the median home price in San Francisco if one combines both houses and condos. For that price, one could buy a 4-bedroom, 2135 square foot house in Ingleside or Oceanview, or a 3-bedroom, 1566 square foot house in Outer Parkside, or a 2-bedroom, 1070 square foot condo in Pacific Heights.

For $2 million, one could purchase a gracious 4-bedroom, 2650 square foot, detached house on a large lot in Forest Hill, or a classic 2-level, 3-bedroom, 1900 square foot condo with a garden in the Marina, or a 2-bedroom, 1350 square foot, luxury high-rise condo with spectacular views in South Beach.

————————————————————
Quick Market Update
December through February constitute the slowest sales months of the year and are subject to significant seasonal issues, so coming to definitive conclusions about where the market is heading based on their data is difficult. However, for what it is worth, comparing the 3-month period to the same period a year ago, the median house sales price at $1,290,000 is up 4.5% and the median condo sales price at $1,050,000 is down 4.1%. As mentioned in earlier reports, the big dynamic affecting the condo market has been the surge of new-construction inventory hitting the market in the past year, just as demand started to soften. The inventory of new condos for sale is now at its highest level in 7 years, and, not surprisingly, this is impacting the supply and demand dynamic for condos, especially in those districts where new construction is concentrated. On the other hand, the inventory of
house listings continues to remain at record lows, keeping that market, especially its more affordable segments, quite competitive.
This chart below reflects the latest Case-Shiller Home Price Index for the 5-county metro area house market, going through the end of 2016. It illustrates how in 2016, more affordably-priced houses continued to appreciate significantly, while the most expensive segment basically plateaued. Generally speaking, this is a common dynamic around the Bay Area.

San Francisco Median Home Price Trends since 1994
For a longer-term perspective

New Listings Begin Pouring onto the Market Again
The period of March through May is usually the most active selling season of the year, and we will soon have more conclusive indications of where the 2017 market is headed. This next chart illustrates the typical, dramatic surge of new inventory that fuels sales during this season.

————————————————————
San Francisco Home Sales with Views
SF is a city known for its wide variety of gorgeous views, which can add substantially to the value of a home so graced. Of all the house sales in 2016, only 88 reported having a Golden Gate Bridge view, and some of those were peek-a-boo views (i.e. if you lean out the bathroom window on the top floor) or roof deck views. A full-on, panoramic view of the GG Bridge from Pacific Heights adds over $1 million to the median house price there. Unsurprisingly, condos have the most, and most spectacular, views due to high-rise condo projects.

San Francisco Home Sales by Bedroom Count

————————————————————
Renting vs. Buying in San Francisco
Comparing the purchase, with 20% down, of a 2-bedroom/2-bath condo
with the rental of a comparable apartment in San Francisco
Every year or so, we like to update this analysis using current median sales prices and average rents for comparable 2-bedroom condos and apartments. Rent vs. buy calculations can be performed a wide variety of ways, and results will depend on your own financial circumstances and economic projections, which you should review with your accountant. There is a versatile calculator published by
The New York Times, where one can play with all the financial factors involved:
NYT Rent vs. Buy Calculator. Our analysis represents simply one scenario, which is meant to be more of an invitation to perform your own calculations than a definitive conclusion on the subject.
Depending on your circumstances, plans and predictions for the future, renting may well be the best choice for you. However, low interest rates, high rents, loan principal pay-down over time, inflation and appreciation rates, and the large tax benefits that accrue to homeownership typically give a large long-term financial advantage to buying, if you have the funds for the cash down-payment. (Of course, as with any investment, financial results will ultimately depend on your purchase and sale dates.) This next chart compares net monthly housing costs between renting and buying after tax deductions and principal repayment are accounted for. Our full report goes into much greater detail, such as the accumulation of wealth, in the form of home equity, over time. Please contact me if you would like a copy.

————————————————————
Other recent Paragon reports you might find interesting:
A Comprehensive Survey of the 2016 Market in San Francisco
San Francisco Luxury Homes Market Report
A Survey of Real Estate Markets around the Bay Area
Bay Area & San Francisco Home Price Maps
————————————————————
