San Francisco Median Sales Prices by Quarter
Since median sales prices fluctuate so much by season, the most useful metric is year over year, i.e. comparing Q2 2016 to Q2 2015. In Q2 2016, the year-over-year appreciation rate was 4% for houses and less than 1% for condos, as compared with 2014 to 2015 rates of 20% and 18%.
 Link to long-term median home price chart
————————————————————Transition
By virtually every measurement of supply and demand, the SF real estate market cooled in Q2 2016 when compared to the 4 previous, often wildly overheated spring selling seasons. Listing inventory is up significantly, while the number of sales is down; the number of listings that expired without selling jumped by over 50%; and, as seen above, median sales prices for houses and condos increased year over year, but at much smaller percentages than the torrid rates of previous years. On the other hand, to keep perspective, the months supply of inventory is still under 3 months of inventory, which typically denotes a seller-advantage market in the rest of the country; the median days on market was a relatively low 24 days in Q2; and almost 70% of SF home sales went for over the asking price. Many homes are still selling quickly for very high prices.
Within the city, different market segments are experiencing varying realities. Very generally speaking, the market for more affordable homes is stronger than that for luxury homes; the market for houses stronger than that for condos; and the market for luxury condos cooling most distinctly. Districts with the most new construction, i.e. adding more supply, are usually softening more quickly. It also appears that the city is cooling before other, more affordable Bay Area County markets. San Francisco led the way out of the market recession as the recovery began in 2012 and now may be leading the way in the transition to a less frenzied market. It is also true that transitional markets often send mixed signals in their data.
In any case, it is typical for the market to slow down appreciably during the mid-summer months and then pick up again after Labor Day. Which does not necessarily mean it is not a good time to either buy or sell. For buyers in particular, there is usually greatly reduced competition for listings and thus greater scope to negotiate purchase prices.
————————————————————Average Sales Price to Original List Price Percentage
Trends in Overbidding

As the market has cooled, competitive bidding has declined, thus this past June saw an average sales price 3% over original asking price as compared to the crazy 11% seen in June 2015, when it hit an all-time peak.
Link to our updated report on market seasonality
———————————————————— Appreciation Trends, 2011 to 2016 YTD, by Neighborhood
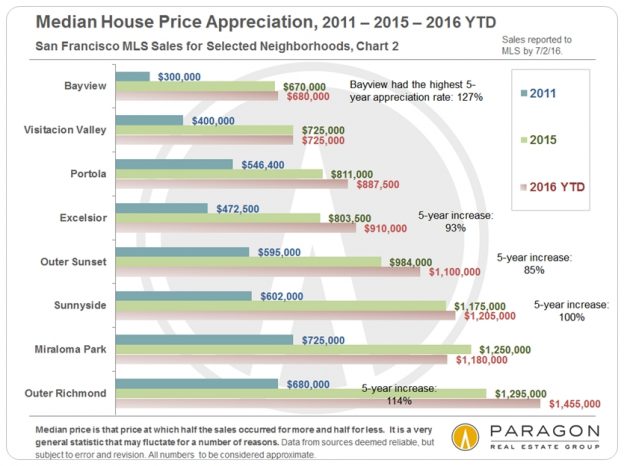
These four charts below track median sales price appreciation from 2011 to 2015, generally the period of rapid increases, and then from 2015 to the first half of 2016, when prices started to stabilize for most areas. Areas that were hit hardest by the distressed property crisis, such as Bayview, often have the highest appreciation rates because they were bouncing back from unnatural lows in 2011. Median condo price appreciation is iffier as a measurement of change because the surge of new construction condos, which are typically more expensive than older units, have substantially impacted values in some neighborhoods. (House inventory in SF has barely changed in many decades, so year-over-year sales are closer to apples to apples.) There are also neighborhoods that have gone through both substantial gentrification and lots of new construction in recent years, such as the Mission and Hayes Valley.
Houses

Condos


Generally speaking, neighborhoods were chosen because they had higher numbers of sales, which usually makes the statistics more reliable. However, median prices can sometimes fluctuate dramatically without great meaningfulness when different baskets of relatively unique homes simply closed in different periods. This is especially true in the most expensive districts: As an example, 20 house sales closed in Pacific Heights by 6/29/16 for a 2016 YTD median price of $5,675,000. Then, one more closed on 6/30/16 and the median price jumped to $6 million. A reminder not to take specific median price appreciation percentages too seriously: They illustrate general trends, not exact measurements of changes in home values.
————————————————————Context
Anyone who reads real estate news, blogs or newsletters knows that there are 2 particularly vehement camps, each with emotional and sometimes financial attachments to diametrically opposed positions: One never stops insisting that the market is great and getting better (and apparently always will, for both buyers and sellers), and the other never stops shouting, usually gleefully, that the market is crashing or about to crash. Both marshal and exaggerate selected statistics and ignore others. The truth is that there are cycles, lulls and fluctuations in real estate markets and no market can go up 20% a year forever (nor should we want it to). On the other hand, we do not currently see local or macro-economic conditions suggesting any imminent crash. While it is true that economic, political or even environmental crises of various magnitudes can erupt suddenly (such as, in the past 12 months, the Chinese stock market plunge, the crash in oil prices, and Brexit), the impact of these crises can vary enormously, and it is very difficult to predict when the next one will hit.
The SF market is clearly in some kind of transition, currently at a relatively moderate pace, hopefully signifying what is called a soft landing from an over-exuberant state. The speed and scale of any further adjustment should become clearer over the second half of the year.
————————————————————San Francisco Luxury Home Market
A Breakdown of Expensive Home Sales by City District


Luxury Home Sales Trends, by Quarter
Luxury house sales were basically the same year-over-year in Q2 (though listing count was up almost 25%), however luxury condo sales saw a significant year-over-year drop, even while the number of expensive condo listings on MLS jumped to its highest level ever. The resale luxury condo market is clearly being impacted by an increase in new, luxury condo projects coming on market, especially in those areas where most of the new construction is occurring.
Some of the new projects coming on line or expected soon will be the most expensive ever seen in San Francisco, estimating average dollar per square foot values for their units over, and sometimes well over, $2000. It will be interesting to see the match up of supply and demand for these condos, since such values in the existing resale market are relatively rare, as illustrated in the third chart below.


Condo Sales by Average Dollar per Square Foot Values
2012 to 2015 Trends, for Condo Sales Reported to MLS

————————————————————
Home Sales Breakdown by District
Underlying the median sales prices commonly quoted is commonly a huge range of prices in the specific home sales that go to make them up. We have updated our breakdowns for every district in San Francisco. Below are 2 of 15 charts which can be found here: SF District Sales by Price Segment.


————————————————————
San Francisco Residential Construction Pipeline
Projects of 60+ Units, per San Francisco Business Times Analysis

The San Francisco Business Times performed a superb in-depth analysis of the many housing projects, rental and sale, market rate and affordable, currently in the Planning Department new construction pipeline, breaking out and describing major projects of 60 units or more, and mapping them as well. Above is our attempt to boil down much of that information into one chart. Please note that projects are constantly being added, revised, sold to new developers, or even abandoned, and the median time from filing a plan to building completion is 3 to 6 years depending on the size of the project. Our full report is here: SF Housing Inventory and Pipeline Report.
Hundreds of condos under construction have already been pre-sold to buyers, with close of escrow and occupancy to occur upon final building completion, sometimes well in the future. These sales of units not yet built still have a significant impact on market supply and demand dynamics.
It is also interesting to note that of projects either under construction or approved by Planning (and leaving aside the long-term mega-projects such as Treasure Island), rental units outnumber sale units by about 2 to 1. This is a very recent development in SF housing construction, which has long been dominated by condo projects (though there are plenty of those too). This expected rush of new rentals, most of which are at the high end of rental cost, is coming just as the rental market is dramatically softening in the city. Indeed, the rental market appears to have cooled much more quickly than the sale market.
These analyses were made in good faith with data from sources deemed reliable, but may contain errors and are subject to revision. It is not our intent to convince you of a particular position, but to attempt to provide straightforward data and analysis, so you can make your own informed decisions. Statistics are generalities, longer term trends are much more meaningful than short-term, and we will always know more about what is actually going on in the present in the future. New construction condos not listed or sold on MLS are not counted in these statistics, though they often affect market dynamics. It is impossible to know how median prices apply to any particular home without a specific comparative market analysis.
© 2016 Paragon Real Estate Group