Author Archives: Pota Perimenis

San Francisco Luxury Condo, Co-op & TIC Market Trends Report


San Francisco – Paragon Real Estate


San Francisco Luxury Condo, Co-op & TIC
Market Trends Report


September 2017 Update

The autumn selling season is a big one for the San Francisco luxury homes market: There is usually a very significant spike in activity between Labor Day and the beginning of the mid-winter slowdown in mid-November. It will be a couple months before we begin to get definitive statistics on listing and sales activity in September and October, but in the meantime we can review the market conditions and trends as they have developed over recent years. This report will pay particular attention to the different neighborhood markets within SF.

We usually use $1,850,000 as the price threshold for the luxury condo, co-op and TIC market in San Francisco: That approximately defines the top 10% of the market. The ultra-luxury segment starts at $3 million, which constitutes the top 2.5% of sales. Of course, what one gets in the different neighborhoods for the same price can vary dramatically: The city has an enormous range in locations, architectural styles, views and amenities.

All our Paragon reports can be found here


————————————————————

SF Condo, Co-op & TIC Sales over $5m
2017 YTD MLS Sales

Overview: Listing & Sales Activity


As of mid-month, 49 new luxury condo, co-op and TIC listings have come on the SF market since the beginning of September, so it looks like it may be a record-breaking month for new listing activity.


If you wish, you may skip our summary
and jump to additional
graphed analyses further below.

MARKET SUMMARY

The luxury real estate market is impacted by a
number of factors: positively, by improvement in general economic
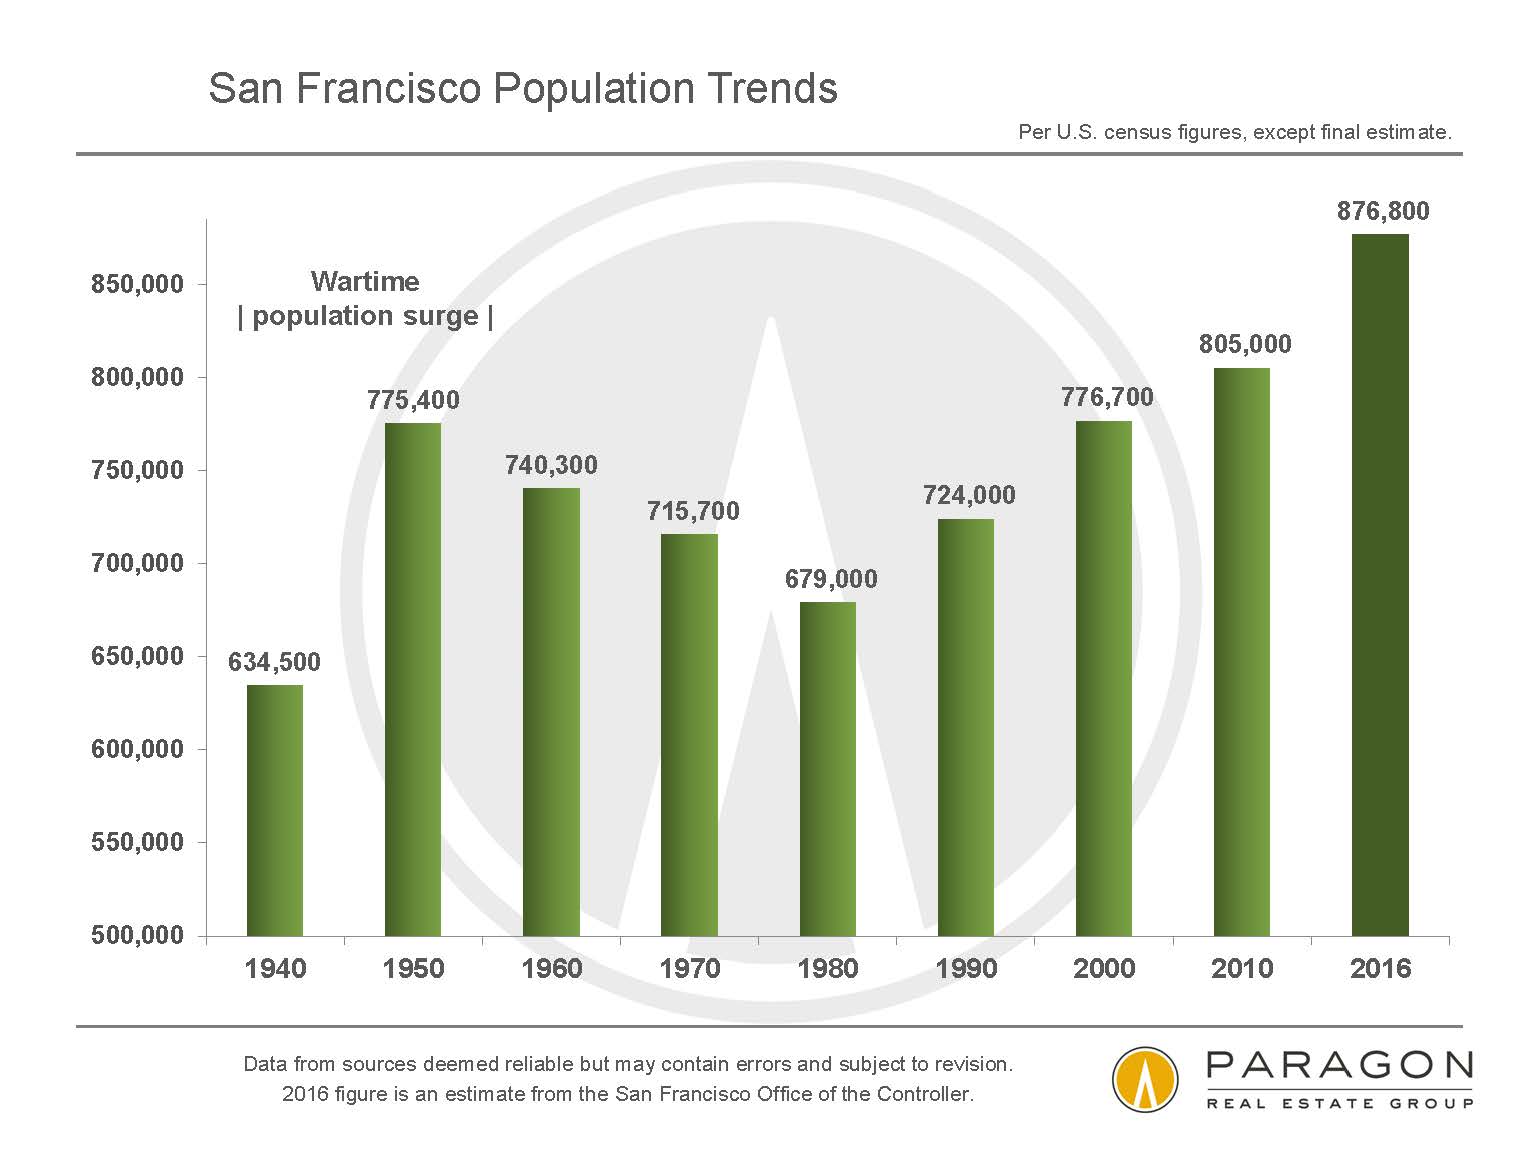
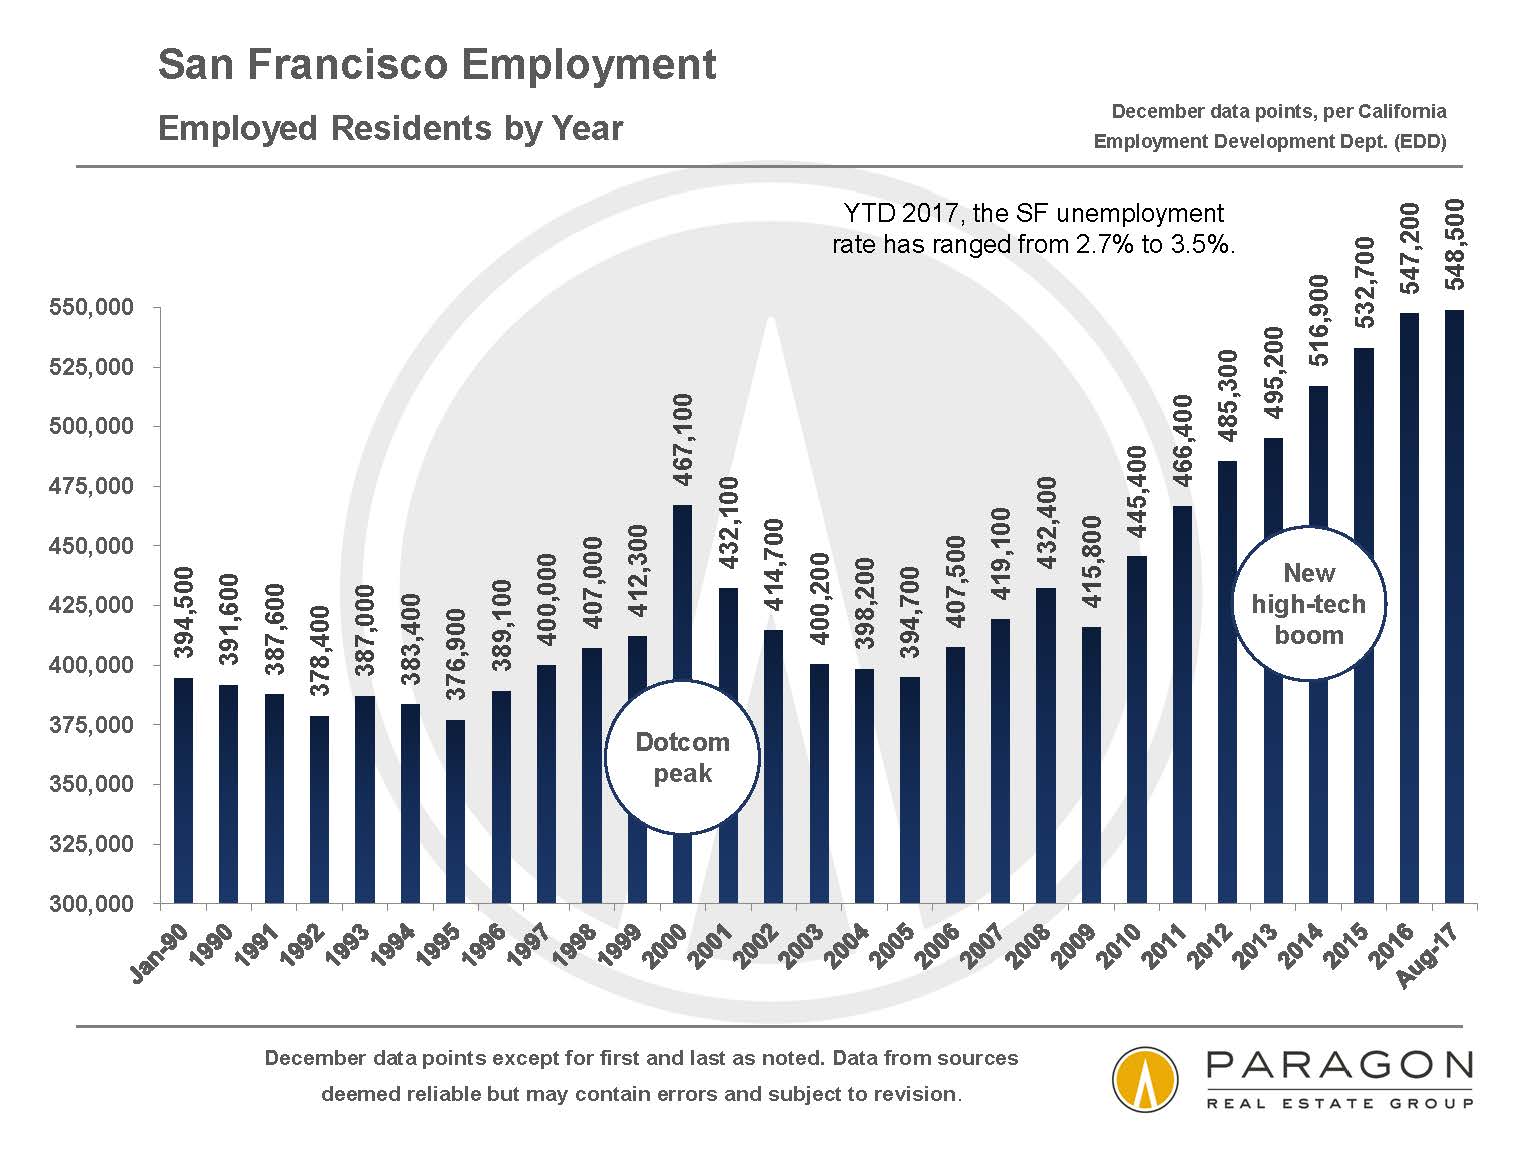
conditions and confidence, highly-paid employment and population growth, foreign buyers, and
especially, by the creation of new wealth in large quantities. All these
elements were dynamically present in the Bay Area from 2012 through mid-2015.
Then significant economic and political volatility put a damper on the market: Chinese stock market turmoil, the crash in oil prices, Brexit, the U.S. presidential election, as well as an apparent cooling in our high-tech boom, all injected uncertainty into financial markets and our local luxury real
estate market from late summer 2015 to late autumn 2016. Furthermore, Bay Area high-tech IPOs, which had created a
stupendous amount of new wealth since 2011, basically dried up during this period – and newly rich
or substantially enrichened buyers had played a big role in demand.

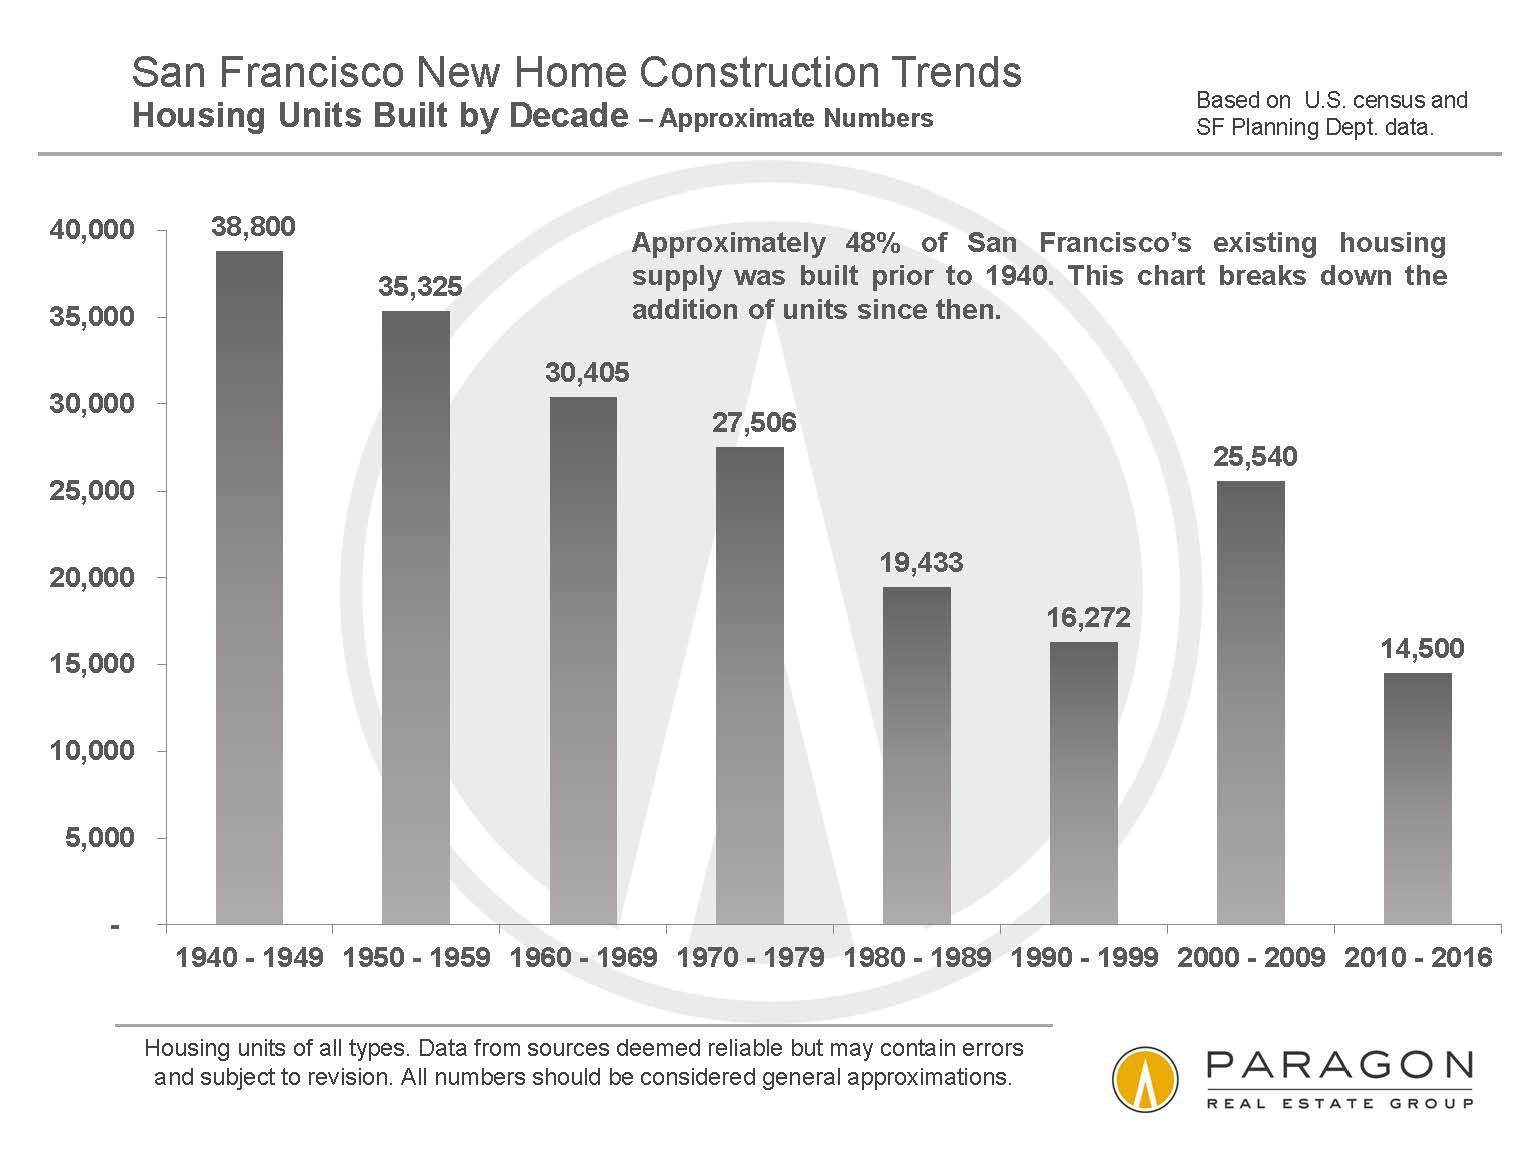
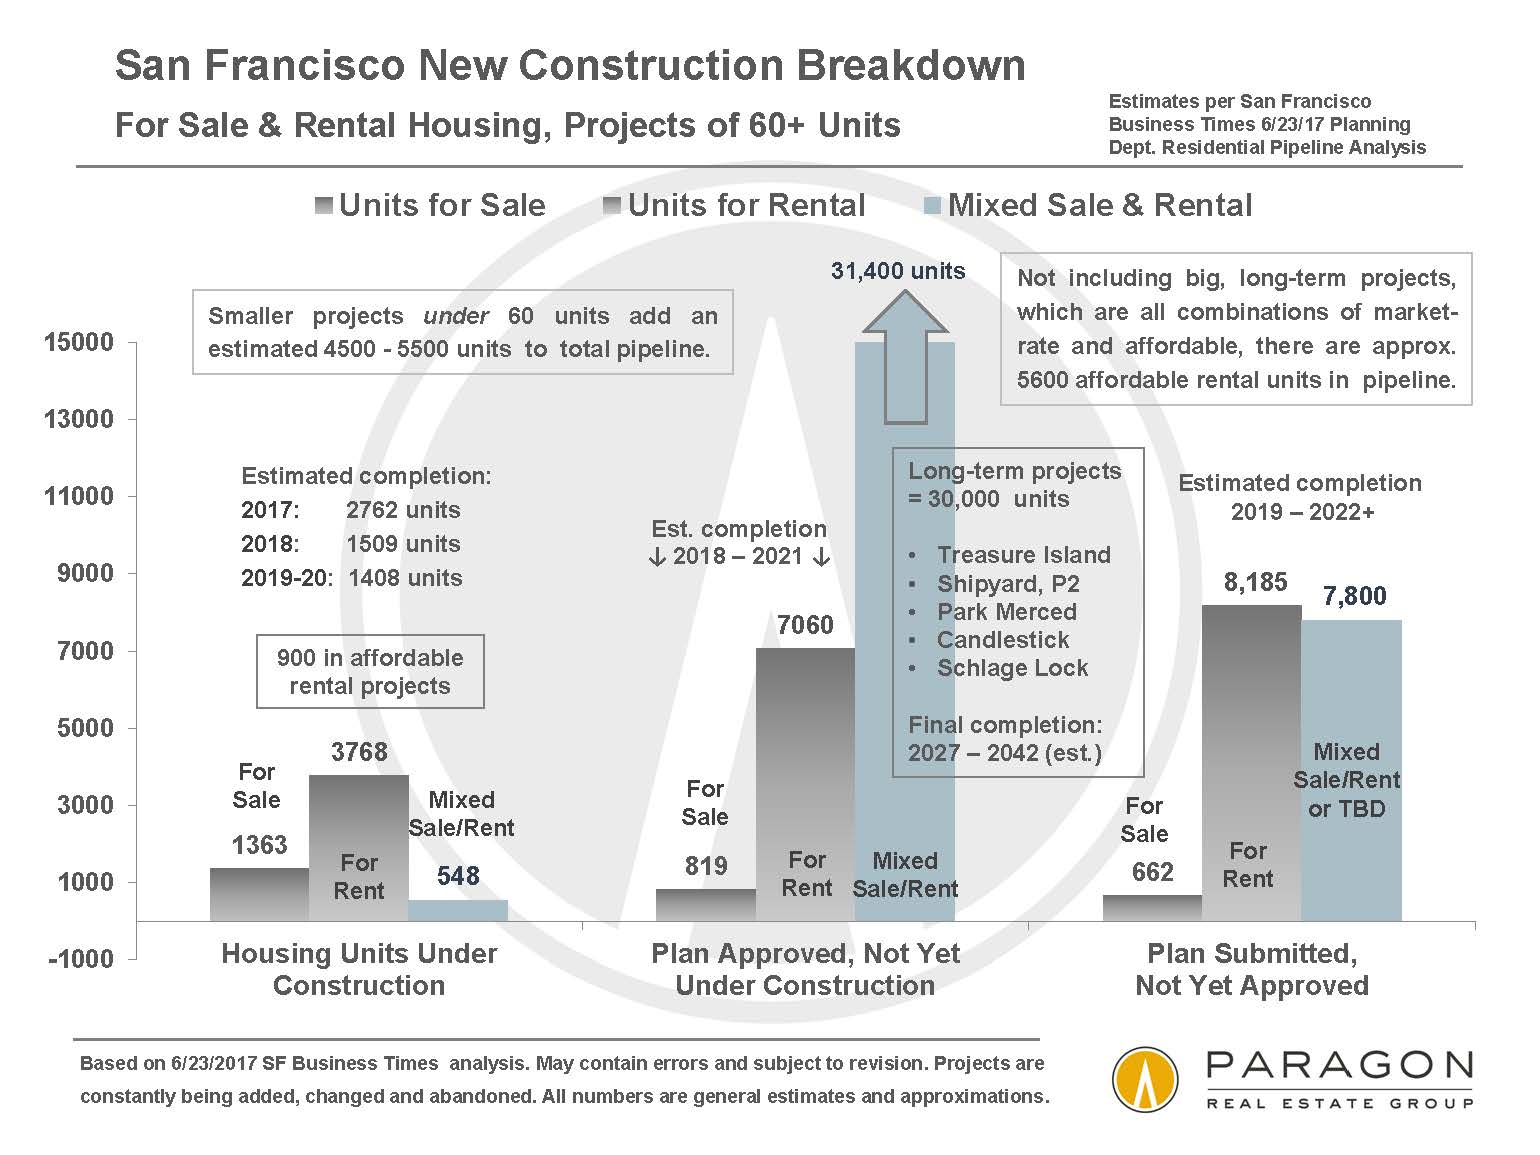
Generally speaking, most affected was the market for re-sale luxury condos, particularly in those
neighborhoods where big, new-construction projects are concentrated and dramatically increasing supply. It is hard to get
definitive data on new-project sales activity, but it is believed to have
softened as well with the overall jump in listings, all competing for the same buyers.

However, in June 2017, the SF luxury condo market suddenly hit a new high in sales volume. This accompanied feverish spring real estate markets around the Bay Area, though the more affordable segments were most frenzied, and house markets somewhat hotter than condo markets. Consumer confidence climbed, interest rates remained low and the stock market soared to new heights.

The biggest shift in the luxury condo market has been the dramatic year-over-year drop in sales reported to MLS in the greater South Beach-SoMa district, even as listing inventory there has hit new highs. As illustrated below, by virtually every market indicator – months supply of inventory, average days on market, and others – it is the softest luxury condo market in the city. This is the area where many big, new projects continue to come on market, and, to some degree, they are probably cannibalizing MLS sales as they aggressively compete with the resale market. This is also the district where the unfortunate issues at the Millennium Tower (slight sinking and tilting; multiple lawsuits) are being extensively reported upon. On the other hand, the high-end condos that do sell in this district still often achieve the highest dollar per square foot values in the city.

The Pacific Heights-Marina district and the Noe, Eureka (Castro) & Cole Valleys district have much stronger supply and demand statistics in their high-end condo markets, with the greater Russian & Nob Hills district a bit cooler.


————————————————————

Overview Dollar per Square Foot Analyses

———————————-

Most Expensive Luxury Condo, Co-op & TIC Buildings
in San Francisco, by Median Dollar per Square Foot

Each of these buildings had 7 to 23 sales during the period measured.

———————————-

San Francisco Luxury CONDO, CO-OP & TIC Market
by Top Neighborhoods & Districts


Each Realtor district delineated on the map above and the charts below contains a number of neighborhoods. For example, Realtor District 9 contains South Beach, SoMa, Mission Bay, Yerba Buena, Potrero Hill and the Mission (as far as luxury condo sales go). Sometimes the chart legends will mention different neighborhoods within the district, but it is always referencing the same District 9.


Top Luxury Condo Districts: Average Dollar per Square Foot Values


The highest luxury dollar per square foot values are achieved in the greater South Beach-SoMa district – almost all high-rises built within the last 20 years or so – and in the swath of much older, high-prestige neighborhoods, such as Pacific Heights and Russian Hill, running across the northern side of the city.


Top Luxury Condo Districts: Listing & Sales Volumes


The South Beach-SoMa district has by far the highest number of active luxury condo listings, and that does not include most of the new-project listings, which are typically not entered into MLS. So supply, or over-supply, is a major issue there in the market dynamic.


This next chart illustrates the abrupt plunge in sales over the past 15 months in South Beach-SoMa (tying neatly into when the Millennium problems started getting press coverage). The Pacific Heights-Marina district is now the top district for sales, followed by the Russian & Nob Hills area. Sales in the two relative “upstarts” in the luxury condo market – the Noe, Eureka and Cole Valleys district and the Hayes Valley-NoPa-Alama Square district – have been significantly growing in recent years.


Top Luxury Condo Districts: Months Supply of Inventory


South Beach-SoMa now has a very high months supply of inventory, while Pacific Heights-Marina and Noe, Eureka and Cole Valleys have very low MSI figures. Russian and Nob Hills have somewhat higher but still relatively low MSI figures in recent months. The lower the MSI, the stronger the demand as compared to the supply of listings available to purchase.

High MSI in South Beach-SoMa does not imply that luxury condos are not selling there, but it does mean that listings generally have to stand out as good values, i.e. priced correctly as well as prepared and marketed properly, to seize the attention of buyers confronted with so many options.


Top Luxury Condo Districts: Average days on Market


The same dynamic seen in months supply of inventory is replicated in the statistic average-days-on-market. Indeed, the dynamic is consistently illustrated, to a greater or lesser degree, in all the following charts.


Top Luxury Condo Districts: % of Sales Accepting Offers within 30 Days

The higher the percentage, the stronger the market.

Top Luxury Condo Districts: % of Sales Selling over List Price

The higher the percentage, the stronger the market.


Generally speaking, the higher the overbidding percentage, the more buyers are competing to win listings. However, it is also not unusual in recent years for lower priced areas to have higher overbidding percentages, and the Noe, Eureka and Cole Valleys district is distinctly less expensive than the other 3 districts illustrated on the chart below.

Top Luxury Condo Districts: Listings Taken Off Market without Selling

The higher the number, in relation to overall district
listing and sales numbers, the softer the market.

————————————————————

Ultra-Luxury Condo & Co-op Sales in San Francisco

The Top 2.5% of Sales, $3m+


As illustrated in the second chart below, sales at the highest end of the luxury condo and co-op market peaked in spring 2015, while the number of active MLS listings have continued to rapidly climb to peak this past June, so the supply and demand dynamics in this segment have changed considerably in the past 2+ years. This ties in with the financial market turmoil and plunge in local IPO activity that began in late summer 2015. At the same time, some of the recently built as well as upcoming condo projects are aggressively targeting this very expensive niche, adding further to supply.

This market segment targets a very small pool of very affluent buyers and it is not unusual that its statistics for months supply of inventory and average days on market to be appreciably above those in the general market. However, since spring 2015, both metrics have climbed much higher, to an average of 8.5 months of inventory and an average 55 days on market over the past year. This market has been clearly and significantly tilting to the advantage of buyers.

As seen earlier in the list of biggest sales and the chart showing the most expensive buildings, the ultra-luxury segment is totally dominated by neighborhoods such as Pacific Heights, Russian Hill, Nob Hill and South Beach-SoMa.


Please let us know if you have questions or we can be of assistance in any other way.

Our complete SF luxury real estate report (including luxury houses)

All Paragon Bay Area market reports


————————————————————

It is impossible to know how median and average value statistics apply to any particular home without a specific, tailored, comparative market analysis. In real estate, the devil is always in the details.

These analyses were made in good faith with data from sources deemed reliable, but may contain errors and are subject to revision. It is not our intent to convince you of a particular position, but to attempt to provide straightforward data and analysis, so you can make your own informed decisions. Median and average statistics are enormous generalities: There are hundreds of different markets in San Francisco and the Bay Area, each with its own unique dynamics. Median prices and average dollar per square foot values can be and often are affected by other factors besides changes in fair market value. Longer term trends are much more meaningful than short-term.


© 2017 Paragon Real Estate Group
  Pota Perimenis–helping you make the right moves in real estate.
Paragon Real Estate Group
www.paragon-re.com/

Pota Perimenis
Lic# 01117624
1400 Van Ness Avenue
San Francisco, CA 94109
Cell 415-407-2595
pperimenis@paragon-re.com
www.sfcityhomes.com


This email was sent to *|EMAIL|*

why did I get this?    unsubscribe from this list    update subscription preferences

*|LIST:ADDRESSLINE|*

*|REWARDS|*

A Hot Autumn Market in San Francisco?

Owners in the city (and the nation) are getting older, and selling their houses ever more infrequently. And virtually no new houses are being built within SF itself.

SF Bay Area House Markets


Condo sales significantly outnumber house sales in SF, and the supply of condos available to purchase has surged with new project construction. This has made that market segment somewhat less heated; condo owners also tend to sell more frequently than house owners. However, the condo market in the city is much more expensive than in other counties.

Bay Area Condo Markets

————————————————————

Ultra-Luxury House Sales in San Francisco
Houses Selling for $5 Million & Above


A quick look at the very highest end of the SF market. Though other districts, such as the greater Noe-Eureka-Cole Valleys district, have increasingly surged into the luxury home segment, when it comes to the realm of the really big, most expensive houses, the district comprised of Pacific & Presidio Heights, Cow Hollow and Marina dominates with 75% of sales. House sales there can exceed $30m, though that is still very rare.

Most expensive houses in San Francisco

————————————————————

Bay Area Home Price Appreciation
per the S&P CoreLogic Case-Shiller Index


Earlier in this report, it was mentioned that median price changes can sometimes be unreliable as indicators of actual appreciation. However, the S&P Case-Shiller Home Price Index measures appreciation using its own special algorithm tracking resales of the same home, and it does not use median sales prices. This first chart below, based on Case-Shiller, is a simplified, smoothed-out look at the up and down cycles over the past 33 years in the higher end of the Bay Area real estate market, which predominates in most of the city, Marin, San Mateo and areas like Piedmont, Diablo Valley and Lamorinda. Because it covers 5 counties, it merges the differences between their separate markets into a single trend line.

San Francisco Bay Area Home Price Cycles


This second Case-Shiller chart illustrates how homes in different price segments around the Bay Area have recently been appreciating at considerably different rates. C-S divides all the Bay Area house sales into thirds by number of sales: low-, mid- and high-price. As illustrated in the lower green line, the higher-priced segment went flat in appreciation in 2016, but then jumped back to life in 2017. The most affordable price segment (top blue line) has been experiencing the highest pressure of buyer demand and competitive bidding, and since April 2016, has out-appreciated the most expensive segment, 12.4% to 4.3%, i.e. almost triple the rate of increase. The middle price segment (gold line) has been in between, appreciating by 7.8%.

These dynamics are generally true within each county, as buyers, somewhat desperately, search for homes they can still afford, in the area they wish to live.

The numbers on this chart all refer to a January 2000 home price of 100. Thus 262 signifies a price 162% higher than in 2000.

Case-Shiller SF Home Price Trends by Price Tier

————————————————————

Months Supply of Inventory (MSI)


The lower the months supply of inventory, the higher the demand as compared to the supply of homes available to purchase, i.e. lower MSI equals a hotter market. The entire Bay Area has been experiencing very, very low MSI figures recently, with San Mateo at rock bottom. (Its median house sales price has just recently been exceeding the median price in the city.) Alameda and Contra Costa Counties, generally offering considerably more affordable home prices than Silicon Valley, San Francisco and Marin are also at extreme lows.

Within SF itself, the MSI for houses alone, and especially in the more affordable neighborhoods, is substantially lower than the MSI for condos, though both have been very low since spring began.


SF Bay Area Months Supply of Inventory

————————————————————

Mortgage Interest Rates


Since the election, interest rates have seen a wild ride, first up and then down. As of the end of August, rates hit their lowest point so far in 2017, a significant financial advantage for buyers.

Mortgage Interest Rate Trends


Please let us know if you have questions or we can be of assistance in any other way. Information on neighborhoods not included in this report is readily available.

All our many Bay Area real estate analyses can be found here: Paragon Market Reports

Over the past 12 months, Paragon sold more San Francisco residential and multi-unit residential real estate than any other brokerage. (Sales reported to MLS per Broker Metrics.)


————————————————————

It is impossible to know how median and average value statistics apply to any particular home without a specific, tailored, comparative market analysis. In real estate, the devil is always in the details.

These analyses were made in good faith with data from sources deemed reliable, but may contain errors and are subject to revision. It is not our intent to convince you of a particular position, but to attempt to provide straightforward data and analysis, so you can make your own informed decisions. Median and average statistics are enormous generalities: There are hundreds of different markets in San Francisco and the Bay Area, each with its own unique dynamics. Median prices and average dollar per square foot values can be and often are affected by other factors besides changes in fair market value. Longer term trends are much more meaningful than short-term.


© 2017 Paragon Real Estate Group

  Pota Perimenis–helping you make the right moves in real estate.
Paragon Real Estate Group
www.paragon-re.com/

Pota Perimenis
Lic# 01117624
1400 Van Ness Avenue
San Francisco, CA 94109
Cell 415-407-2595
pperimenis@paragon-re.com
www.sfcityhomes.com


San Francisco Fall Events Guide


Pota Perimenis–helping you make the right moves in real estate.
Paragon Real Estate Group
www.paragon-re.com/
Pota Perimenis
Lic# 01117624
1400 Van Ness Avenue
San Francisco, CA 94109
Cell 415-407-2595
pperimenis@paragon-re.com
www.sfcityhomes.com


This email was sent to *|EMAIL|*

why did I get this?    unsubscribe from this list    update subscription preferences

*|LIST:ADDRESSLINE|*

*|REWARDS|*


1000+ Things to Do and Enjoy in San Francisco & the Bay Area


Paragon Real Estate Group
 

Paragon Real Estate Group


1000+ Things to Do and Enjoy
in San Francisco & the Bay Area

Out of town guests are arriving, the kids are hungry, the dog is restless, or you are just lying on the couch reading email and need something to motivate you to get up and out of the house.


Dinner, brunch, burritos, burgers, desserts, bars, music, dance, theater,
walking, biking, hiking, and things to do with visitors, children and dogs

Place Magazine

Paragon Real Estate Market Reports

Note: You will undoubtedly find yourself disagreeing vehemently
with one or more of the above lists: best burrito, brunch and dive bar are
particularly contentious, ferociously disputed issues in the Bay Area. We hope you will accept our apologies for any egregious errors.


© 2017 Paragon Real Estate Group
 
Pota Perimenis–helping you make the right moves in real estate.
Paragon Real Estate Group
www.paragon-re.com/

Pota Perimenis
Lic# 01117624
1400 Van Ness Avenue
San Francisco, CA 94109
Cell 415-407-2595
pperimenis@paragon-re.com
www.sfcityhomes.com

Income, Employment, Education, Poverty & Home Prices


Paragon Real Estate Group

Paragon Real Estate Group
 

Income, Employment, Education, Poverty & Home Prices

A Survey of San Francisco Bay Area
Real Estate Markets & Demographics


Which counties are most expensive or most affordable, have the highest overbidding and appreciation rates? Which are healthiest, most educated, have the highest incomes or worst poverty percentages? What cities have the biggest, most expensive homes? And where do Bay Area residents come from?

August 2017 Report


Median House Price Appreciation since 1990


Appreciation trend lines are largely similar across the Bay Area, but some counties have outperformed others. Solano is still well below its previous peak price ten years ago, and Sonoma and Napa are just now coming back up to their previous highs. However, most of the other counties have exceeded their 2006-2007 peaks, sometimes by very wide margins. As will be explored further below, proximity to the heart of the high-tech boom has been one of the major factors in recent appreciation rates. However, it is worth noting that in the past year and a half, appreciation rates in less expensive towns and neighborhoods have typically been higher than in more expensive areas, an indication of the sometimes desperate search for affordable housing – however that might be defined within the context of any given market.


————————————————————Average Dollar per Square Foot Values

————————————————————

The Most Expensive Places in the Bay Area

By clicking on map, you can also access our full collection of home price
maps delineating current city home prices throughout the Bay Area.


Note: Diablo in Contra Costa with 6 sales at a median price of $2.73m, and Penngrove in Sonoma with 13 sales at a median price of $919,500, had higher prices than Alamo and Healdsburg in the period measured, but because of their very low number of sales, we highlighted the larger markets on the map above.


————————————————————Annual Home Price Appreciation Rates
since 1996 and 2011


This table below illustrates annual compound appreciation trends going back to the post-recession recovery that began around 1995, and also from the current post-2008-crash recovery which started in 2012. This is based upon someone purchasing their home all cash: If one had purchased with a 20% downpayment, then the annual compound rate of appreciation of that cash investment would be much, much higher.


There are 3 big factors behind local appreciation rates: 1) the emergence of the Bay Area in the past 20 years as an international, economic powerhouse, which generally lifted all markets, 2) how close the specific market is to the white-hot centers of the high-tech boom (SF and Silicon Valley), and, 3) how badly the county was hammered by the foreclosure crisis, since those markets whose prices fell 50% or more to unnatural lows bounced back more on a percentage basis than those counties less affected by the subprime catastrophe.

SF has had the highest compound annual rate since 1996: It is the epicenter of the Bay Area high-tech, bio-tech and fin-tech economic miracle. But Oakland soars above all other markets in appreciation since 2011, because of a combination of factors: It is the closest affordable alternative to much higher SF prices; it is a lively, multi-cultural urban area appealing to high-tech workers; and its housing prices dropped an astounding 60% after the 2008 crash, which set them up to fly upward once the heavy anchor of distressed property sales was removed.

Having complete confidence in our ability to predict what will happen in the past, we now recommend that all our clients go back in time to 1995 or 2011 and buy as many homes as possible.

————————————————————Economic & Demographic Factors


Underpinning the Bay Area real estate market and general economy are often amazing, but sometimes worrisome statistics. Below are tables and charts ranking counties, zip codes and cities by a variety of parameters. The Bay Area ranks extremely high in income, education, employment rates and general health factors, often grabbing almost all the top rankings, but it is also unhappily high in income inequality, housing unaffordability and poverty.


Bay Area City & Zip Code Income Rankings


Atherton has the highest median household income and the highest median income per worker in the state, followed by a handful of other nearby, highly affluent, Silicon Valley communities. In San Francisco, South Beach and the Presidio zip codes make the top rankings, but note that several of the most expensive neighborhoods in SF are in zip codes that mix highly affluent with less affluent areas (such as Pacific Heights and Western Addition, or Russian Hill and the Tenderloin). SF also has much higher percentages of residents who are tenants, and generally speaking, renters have lower incomes than homeowners.

In Marin County, Belvedere, Tiburon, Kentfield and Mill Valley make the lists; in Contra Costa, the Diablo Valley & Lamorinda communities of Blackhawk, Alamo, Lafayette, Orinda and Moraga rank highest; in Alameda, Piedmont is in the top 10 cities for median worker earnings.


Bay Area zip codes utterly dominate the CA rankings for higher education, taking 14 of the top 15 spots out of about 2600 zip codes. Unsurprisingly, high positions in income usually correlate with the same in education (and having UC Berkeley and Stanford in our midst was a help): Top Zip Codes for Higher Education

If you wish to explore Bay Area rankings by other criteria: Top 25 Rankings in California

Employment & Unemployment

High-tech employment in SF & San Mateo Counties illustrates
broader trends in hiring: massive growth and some recent cooling.

Unemployment rates are bumping against historic lows.

Bay Area Poverty Rates & Housing Affordability

Beneath surging affluence, significant percentages of county populations
are living in poverty. High housing costs are a big factor.

Housing affordability percentages are approaching historic lows in some counties,
a huge Bay Area political, economic and social issue. If interest rates start to go up
considerably, the picture will worsen, but so far they have remained quite low.


Link to our mortgage interest rate chart

Link to our full report on Bay Area housing affordability

————————————————————

Bay Area Luxury Home Markets


Santa Clara is by far the biggest luxury home market in the Bay Area by the number of homes selling for $2m+, but then its overall market is also the largest, more than 2½ times larger than that of San Francisco. Average dollar per square foot values for luxury house sales are surprisingly similar across Santa Clara, San Mateo and San Francisco, with Marin County just a notch lower. Moving further out, one gets considerably more luxury house for the money.

Generally speaking, SF luxury condos and co-ops command the highest dollar per square foot values in the Bay Area: Think fabulous units on high floors of prestige, ultra-amenity buildings with absolutely staggering views.

Calculating luxury markets by the top 10% of sales, the thresholds for the luxury designation vary widely: For example, in Sonoma, the threshold is about $1,125,000 for houses, while in San Francisco, it is about $3m.

————————————————————Other Angles on Bay Area Market Dynamics
Bay Area Condo Markets

Overbidding


Average Days on Market


Bay Area Market Sizes


Bay Area Rents

Rents are even more sensitive to hiring trends than home prices.

Link to our apartment building market report

————————————————————

Additional Demographic Snapshots


The foundation of the Bay Area economy is a richly multi-cultural society constantly infused by many of the best and brightest from around the world.

————————————————————

S&P Case-Shiller Home Price Index
for the San Francisco Bay Area


Case-Shiller charts are complicated, which is why we have put them at the end of the report, but they do give perspectives on home price appreciation by price segment. The different price tiers had bubbles, crashes and recoveries of very different magnitudes, with the low-price tier having an extravagantly enormous subprime bubble and a disastrous crash, while more costly home tiers having lesser bubbles and crashes. The end result now is that all three tiers are relatively close in their current prices as compared to 2000 values, but are in very different circumstances when compared to their 2006-2007 bubble peaks. Around the Bay Area, generally speaking, San Francisco, San Mateo, Marin, Santa Clara and Diablo Valley-Lamorinda have high-price tier markets with smaller mid-price segments; Alameda, Sonoma, Napa, Solano and non-central Contra Costa have mixes of low-price and mid-price markets (though there are, of course, pockets of high-price homes as well).

All C-S data points refer to a January 2000 home price of 100. Thus a reading of 250 signifies a price 150% higher than in January 2000.

More affordable homes have been appreciating much more quickly
in the past 15 months than more expensive price segments.

Link to our full S&P Case-Shiller Index Report


All our reports, including dedicated analyses of the SF luxury home segment, and of the Marin, Sonoma and Diablo Valley-Lamorinda markets, can be found here: Market Trends & Analysis


————————————————————————–


These analyses were made in good faith with data from sources
deemed reliable, but may contain errors and are subject to revision. It is not
our intent to convince you of a particular position, but to attempt to provide
straightforward data and analysis, so you can make your own informed decisions.
Median and average statistics are enormous generalities: There are hundreds of
different markets in the Bay Area, each with its own unique dynamics. Median
prices can be and often are affected by other factors besides changes in fair
market value, and longer term trends are much more meaningful than short-term. It is impossible to know how median
prices apply to any particular home without a specific comparative market
analysis. All numbers in this report are to be considered approximate.

© 2017 Paragon Real Estate Group
Pota Perimenis–helping you make the right moves in real estate.
Paragon Real Estate Group
www.paragon-re.com/

Pota Perimenis
Lic# 01117624
1400 Van Ness Avenue
San Francisco, CA 94109
Cell 415-407-2595
pperimenis@paragon-re.com
www.sfcityhomes.com

This email was sent to *|EMAIL|*

why did I get this?    unsubscribe from this list    update subscription preferences

*|LIST:ADDRESSLINE|*

*|REWARDS|*


Here is a preview of what is in San Francisco’s development pipeline…

Location: Transbay

Projects & Developments:

1. 50 1st St. (1st & Mission) – Two million square foot Oceanwide Center development comprises two high-rise towers, along with impressive new public spaces and important new pedestrian links through downtown. Together, the buildings provide 1.35 million square feet of office space and 650,000 square feet of residential units.
2. Mission (1st and Fremont) – Salesforce Tower. Estimated completion later this year, no exact date.
3. Port of San Francisco (Pier 1) – Port of San Francisco facing a multi-billion dollar challenge with respect to rehabilitating, renovating and re-purposing the city’s piers & 100+ acres of waterfront space, an analysis prepared for the Port’s Waterfront Plan Land Use Subcommittee could pave the way for a luxury hotel & tech space in the Port’s historic finger piers.
4. Ferry Building (Pier 2) – Location of previous restaurant, Sinbad’s. Expansion of ferry landing and public use.
5. 75 Howard – Demolition of an eight-story parking garage at 75 Howard St., making way for a 133-unit tower that has been more than five years in the planning.
6. Transbay Block 4 – On the northern third of the site fronting Howard (Transbay Block 4), a 450-foot-tall building is expected to rise.
7. 250 Howard – Park Tower at Transbay is a 43-story, 605-foot (184 m) office skyscraper under construction. The tower is located on Block 5 of the San Francisco Transbay development plan at the corner of Beale and Howard Streets, near the Transbay Transit Center.
8. 181 Fremont – 55 ultra-luxury residences perched at the top of 181 Fremont, which rises almost 800 feet above San Francisco in the Transbay/Yerba Buena neighborhood south of Market Street.
9. 33 Tehama – 33 Tehama is an iconic new residence coming to the heart of SoMa. Offering one-bedroom, two-bedroom and penthouse apartments, it brings truly cosmopolitan living, avant design and unrivaled amenities to one of the most connected, walkable and cultured locations in the City and beyond. The 35-story tower was designed by Arquitectonica with interiors by Edmonds + Lee and a signature art installation by world-renowned Yayoi Kusama.
10. 550 Howard – 64-story tower to on Transbay Parcel F, would reach a height of 806 feet as proposed, making it the fourth tallest tower in San Francisco, behind the Salesforce/Transbay Tower. 200 condos would be spread across the top 27 floors, with 16 floors (287,000 square feet) of office space and a 250-room hotel below.
11. Transbay Block 9 – Also known as 500/510 Folsom, the Transbay Block 9 tower will yield a total of 545 apartments of which 436 (80 percent) will be market rate. 109 BMR units on the lower 21 floors.
12. Transbay Block 8 (420-488 Folsom) – Located two blocks from the new $4.5 billion Transbay Transit Center, San Francisco’s Grand Central Station, and three blocks from the new 61-story Salesforce Tower, Transbay 8 will be a 55-story, 548-unit residential tower with upper floors featuring 118 luxury view condominiums and lower floors accommodating 280 luxury apartments and 150 affordable apartments. The ground floor will feature 17,000 square feet of neighborhood serving retail set around an open public paseo meandering through the site.
13. Transbay Block 2 – A 165-foot-tall building is slated to rise on Transbay Block 2, fronting Folsom between Beale and Main, with a total of 242 below market rate (BMR) units.
14. Transbay Block 3 – Will become Transbay Park, the construction of which is slated to commence in early 2018.
15. Folsom Bay Tower (160 Folsom) –Transbay District site for the twisty 400-foot-tall “Bay Tower” designed by Jeanne Gang to rise at 160 Folsom Street, is currently in design. If all goes as currently expected, work should begin in earnest on the development of 160 Folsom within the next month. And if so, the Transbay Block 1 project, which will yield a total of 391 condos, 156 of which will be below market rate (BMR), over 10,200 square feet of retail space and underground parking for 340 cars should be ready for occupancy in the first quarter of 2020 (not 2019).
16. 390 1st. (Corner of 1st and Harrison) – Dubbed “Modera” and designed by TCA Architects for Mill Creek Residential, the proposed 390 1st Street development totals 180 apartments (a mix of 57 studios, 50 one-bedrooms, 68 two-bedrooms and 5 three-bedrooms) with a small corner cafe and underground garage for around 90 cars.
17. 4th & Brannan – 37-story residential tower at the corner of Fourth and Brannan streets. The building would sit right across the street from the Caltrain station (under construction) and amid a flurry of new activity. The latest proposal soars well above the 250-foot cap for the area and calls for 427 units.
18. Corner of Townsend – Up to 270 feet in height; a 400-foot height limit for the Creamery/HD Buttercup parcels (upon which Tishman Speyer has proposed to build a residential tower or two); and a re-revised 240-foot height limit for the 725 Harrison Street site to allow Boston Properties’ proposed office project to rise as rendered above, or at least with a few tweaks. And if adopted, the plan could pave the way for an additional 7,800 units of housing, and office space for an additional 45,000 jobs, to rise in the area roughly bounded by Folsom, Second, Townsend and Sixth.

Location: Mission Bay 

Projects & Developments:

1. One Mission Bay – Currently selling & hotel
2. Mission Rock (China Basin currently industrial site just south of AT&T park known as parking lot A) – Crafted through ten years of neighborhood outreach and community planning, Mission Rock will transform a surface parking lot just south of AT&T Park into a vibrant new community that includes 1,500 new rental homes with 40% dedicated to affordable units for low- and middle- income families, 8 acres of parks and open space, and small retail shops and cafes. Existing parking will be consolidated into a safe structure and will responsibly account for the needs of the neighborhood. Mission Rock will protect against sea level rise, and generate over $1 billion in revenue for San Francisco. Anchor Brewing Co. will be built on Mission Rock Pier 48 will be brewery, restaurant, & museum
3. Uber Campus (1455 Third St.) – The 435,000-square-foot project, located next to the future Warriors arena, includes an 11-story structure at 1455 Third St. and a six-story building at 1515 Third St.
4. Warriors Arena (Third St. & 16th St.) – Construction began on the Warriors’ new Mission Bay arena Jan. 17. The basketball and entertainment venue, to be called the Chase Center.
5. Bayfront Park Expansion (between Terry Francois Blvd. & the Bay) – 5.5 –acres across from the Warriors’ future Chase Center. Once the Warriors begin construction on their Arena, Bay Front Park will be expanded and receive much needed upgrades. The new park should be open by 2018.

Location: Dogpatch 

Projects & Developments:

2. The Gantry (2121 3rd St.) – 106 unit apartment complex
3. 2130 Third St. – UCSF’s future Child, Teen and Family Center, and Department of Psychology Building, slated to be presented to UC’s Board of Regents next month, refined renderings and timing for the 148,000-square foot development.
4. 2290 Third – This luxury residential project contains 71 homes on six floors, with ground floor commercial space, a 34-car parking garage, and 71 bicycle stalls.
5. Pier 70 – The renaissance of San Francisco’s waterfront continues with a redevelopment project at Historic Pier 70. Aimed at honoring our industrial past while creating a community of modern, innovative companies, the project focuses on rehabilitating & revitalizing the historic 20th Street buildings into highly efficient, creative workspaces, clustered around beautiful, shared plazas and atriums. Led by Orton Development, the project will return the buildings to reuse, preserving their historic fabric, and making them a vibrant and integral part of the surrounding community. The result will be a magnificent historic core that will foster businesses, provide jobs and enhance the local neighborhood.
6. 888 Tennessee Proposed 112 apartments, 3000SF of commercial space fronting Esprit Park, and a south-facing public plaza off 20th Street. The front door will be located at 789 Minnesota Street. Presently deep in the weeds with its entitlements and has no definite timeline set yet, so keep in mind that the design could and very probably will change more before it’s said and done.
7. 815 Tennessee – 69-unit luxury residential project
8. Dogpatch Arts Plaza (19th & Indiana) – Dogpatch Arts Plaza will convert a dead-end street into an 8,000 square foot arts-focused public pedestrian plaza at 19th and Indiana Streets. Inspired by the popular Decompression Festival held on Indiana Street each year, the plaza combines Burning Man’s artistic spirit with the Dogpatch’s industrial heritage to create an outdoor gallery for large-scale and industrial art. The Dogpatch Arts Plaza combines the ideas of pocket plaza and outdoor gallery, creating a “third place” where neighbors and passers-by can come together to engage with art and with each other.
9. 650 Indiana – Under Construction the project consists of two architecturally distinct, but integrated buildings separated by a publicly accessible courtyard mid-block. On the southern side of the site, the “O Building” is organized around a central courtyard and features a dramatic two-story “porthole” opening in the front facade, while on the northern side of the site, the “M Building” is organized around a series of private, landscaped courtyards that open onto Indiana Street.
10. 800 Indiana – Avalon Dogpatch under construction 2.5 acre property is a five story residential complex with 326 apartments, 211 bicycle spaces, and 260 parking spots buried in a subterranean level.

Location: Mid-Market

Projects & Developments:

1. 5M (4 acres between 5th, Mission, & Howard) – Over the next several years, a phased development will transition the site from its current mix of office buildings and surface parking lots to include new open spaces and an assortment of low-, mid-, and high-rise buildings for office use, housing, and public gathering.
2. The Old San Francisco Mint (88 5th St.) – Plans to restore. Talks of museum.
3. 6×6 (aka Market Street Place 945 Market St.) – Largest new retail development in the Mid-Market neighborhood since the nearby Westfield San Francisco Centre opened in 1998. But its immediate environs are facing variable demand. Zendesk, Spotify, and other tech companies are headquartered nearby, and new businesses like Popsons Burgers and Equator Coffee have sprung up to serve them. And some major housing developments have recently been approved for the area, including 1028 Market and the Group i development. Two large-scale hotels—the Yotel and San Francisco Proper—are also in development nearby, and are expected to open later this year. But other major projects, such as the recently refurbished Hibernia Bank at Jones and Market, remain empty. Meanwhile, several well-known neighborhood establishments, like Show Dogs and Machine Coffee, have called it quits. Even the Westfield mall has lost some major tenants, including the Bristol Farms grocery store. The underground
parking garage developed to serve the new “6×6” mall at 900 Market Street is now open for business—even though not a single tenant has been confirmed to fill the 250,000 square feet of retail space above it.
4. 950-974 Market – Group I to revitalize the Mid-Market corridor with new housing, a hotel for intrepid travelers, neighborhood-serving retail, and a dedicated non-profit space.
5. 1055 Market – Possible hotel
6. 1028 Market – Planning process. The 13-story building planned to replace The Hall will rise 120 feet above Market Street. Of the 186 units, 25 will be below-market-rate. There will be 70 studios, 47 one-bedroom apartments, 57 two-bedrooms and 12 three-bedroom units, as well as parking for 44 cars and 140 bicycles. The building will also have 8,200-square-foot retail space on the ground floor, and a 7,300-square-foot roof garden for residents.
7. 1066 Market – proposed 12-story, 300-unit building will maintain continuity with the architectural elements of the surrounding buildings in the historic theatre and loft district and optimize the use of the irregular geometry and topography of the site
8. The Hibernia Bank (1 Jones St.) – Historic Hibernia Bank, built in 1892, has been vacant and neglected for years. Thankfully, the Dolmen Group has dusted off plans to renovate the gracious edifice. Construction is currently under way, but there has yet to be confirmation on what type of business will move into the structure once the improvements are completed.
9. Proper Hotel (45 McAllister St.) – Under construction. Set to open summer 2017 – 131 room hotel.
10. 1075 Market – Aka “Stage 1075” Construction on 90 condos has begun.
11. Yotel San Francisco (1095 Market St.) – Under construction to be completed fall 2017.
12. ACT at the Strand (1127 Market St.)- Converted from an abandoned building into live performance space.
13. Trinity Place (1190 Mission St.) – Phases one and two of the massive Trinity Place development are finished, and phase three is now under construction. Once complete, the complex in total will feature 1,900 units, 1,450 parking spaces, and 60,000 square feet of ground-floor retail.
14. 1275 Market – New Dolby Laboratories HQ
15. 1400 Mission – Completed 15-floor tower containing 190 below-market-rate apartments (a mix of studio- to three-bedroom units). The building fills the BMR requirement for Tishman Speyer’s Lumina development at 201 Folsom.
16. The Panoramic (1321 Mission St.) – High rise for students and interns (micro units)
17. 1415 Mission – Olume Luxury apartments – currently leasing
18. Market Square (1355 Market St.) – Twitter HQ + blue bottle outpost, The Market on Market, etc.
19. One Oak (intersection of Oak St., Market St., & Van Ness) – Build Public is creating a publicly accessible pedestrian plaza on Oak Street between Van Ness Avenue and Franklin Street that will serve as a “front porch” to Hayes Valley and the Civic Center cultural arts district
20. 1699 Market – 9 stories rental about Flax Art building.

Location: The Hub 

Projects & Developments:

The Mid-Market area has been a rather rough section of San Francisco for decades, with urban renewal plan after urban renewal plan failing to take hold. But all that appears to be on the cusp of change as the city attempts to increase density along transit corridors. The Hub triumphantly returns!
Currently, The Hub is full of proposed developments with thousands of new housing units coming from big developments. At least eight development sites are in some stage of the entitlement process. Future new buildings in the neighborhood will occupy these sites:
1. 1580 Mission Street – New apartment development by Related California currently in preconstruction at 1580 Mission Street, San Francisco. The development is scheduled for completion in 2019. 1580 Mission Street has a total of 560 units.
2. 1601 Mission Street – Currently Tower Car Wash. Trumark Urban’s 1601 Mission St., a 220-unit condo proposal near the border of the Mission and South of Market neighborhoods.
3. 30 Otis Street- If approved, the proposed 250-foot tower accompanied by an 85-foot podium building will be part of the strategic revitalization of this transit-rich, underdeveloped corner of the city.
4. 10 South Van Ness Avenue – Honda Dealership
5. 30 Van Ness – If the sale of 30 Van Ness is approved and ratified, the City will continue to occupy the building until 1500 Mission St. development is finished, which is currently slated to occur around 2020.
6. 22-4 Franklin – Hayes Auto Body 8 story apartment rental.
7. 33 Gough Street – Currently City College Administration Building. CCSF board of trustees cut a deal with an Atlanta-based developer to replace the current, aging building at 33 Gough Street

Preliminary Indications of Market Direction


San Francisco Real Estate in Early 2017


Preliminary Indications of Market Direction


April 2017 Report


———————————————————— 


In recent months, there have been multiple reports in local media about Big Drops in San Francisco Home Prices! But, umm, we are not seeing it, neither on the ground in the hurly burly of buyers and sellers making deals, nor in the year-over-year quarterly statistics of supply and demand. News articles often make a big deal regarding the median sales price in a single month, but monthly data is often gravely deficient as an indicator, fluctuating up and down without much meaningfulness due to a number of factors. January and February are particularly bad months to draw conclusions from: The lowest sales volumes of the year, reflecting deals negotiated during the December-January market doldrums, with weather issues sometimes thrown in besides (for instance, in early 2017). Last but not least, the media often mixes property types to come up with a single median sales price, and that is generally not a good idea either.

This chart above illustrates San Francisco quarterly median sales price movements since 2012, which, as one can see, is also prone to significant fluctuation. In Q1 2017, the median house price basically plateaued year over year, while the median condo price actually increased from Q1 2016. (Historically, it is not unusual for Q1 median prices to drop from Q4 due to seasonal reasons, mainly the characteristic big slowdown of luxury home sales in mid-winter.) Q1 is the quarter of the year with the least number of closed sales, so too much should not be made of its data, but we have summarized annual Q1 dynamics for the past 4 years in the 2 charts below. For context, remember that 2014 and 2015 were particularly feverish markets. A much better assessment of the direction of the 2017 market will be possible after Q2 data is in: March through June is usually the most active selling season of the year.

Year-over-Year Comparisons of Q1 Statistics
Chart 1: San Francisco House Market OverviewChart 2: San Francisco Condo Market Overview————————————————————

Annual Median House Sales Price Trends:
5 Selected San Francisco Neighborhoods, since 2004


Generally speaking, in higher priced areas, median house prices have been plateauing or dropping a little, while the more affordable neighborhoods have continued to appreciate: This is a relatively common dynamic around the Bay Area.

The only way to assess value or appreciation for a particular home is by performing a comparative market analysis tailored to its specific location, condition and circumstances. Of all the neighborhoods graphed above, the Marina has by far the fewest house sales and the widest range of individual home sales prices, so it is most susceptible to median price fluctuations caused by other factors besides changes in value – for example, a substantial change in the listings available to purchase in a given year. We do not believe that the same Marina house selling in 2015 would have sold for 15% less in 2016: something less, perhaps; 15% less, very unlikely. This is a good illustration of the dangers of making too much of median sales price changes.

If you would like median home price trends for another San Francisco neighborhood, please let us know.

————————————————————

Average Sales Price to Original List Price Percentage

By Month: House, Condo, Co-op, TIC & 2-4 Unit Building Sales
As seen in this chart, overbidding typically heats up as the market moves into spring. So far, this year has been no exception, though the overbidding percentages are somewhat lower than in recent years.


————————————————————

Annual Market Trends
For clarity and meaningfulness, we much prefer annual trend analyses, with their much bigger data sets, and have recently completed a comprehensive review of virtually every statistic we could think of on that basis. Doing so allows us to stand back to see the broader view of what is happening in the market, instead of getting obsessed by what happens to be in front of our shoe. Looking at annual trends, virtually all the market statistics illustrate the same general conclusion: The market became progressively stronger coming out of the 2009-2011 housing recession; the frenzy peaked in 2015; and the market cooled a bit in 2016, condos more so than houses. This is a generalization of the macro-trend: Different market segments have been going in somewhat different directions and speeds in the city and around the Bay Area in the past year or so.

Below are a few of the many analyses. The full review is here: Long-Term Annual Trends in San Francisco Real Estate

First 2 charts: The hotter the market, the greater the percentage of listings that sell quickly, and the more ferocious the competitive bidding on those listings.


Even with some cooling, the overbidding on appealing new listings has remained quite dramatic: Our current percentages over asking would stun anyone from almost any other market in the country. (However, underpricing has also become a more common strategy here than in other markets.)


Annual Trends Chart 3: As a market begins to cool, the number of listings that expire or are withdrawn without selling increases. This is typically due to increasing supply, softening demand, sellers looking for more money than buyers are willing to pay, or all three.


Annual Trends Charts 4 & 5: As new condos and new rental apartments came on the market in greater numbers in the past year, it cooled those two market segments, much more so than the house segment, of which hardly any are built new in the city anymore. (The more affordable house market in the city has remained remarkably hot.) The rental market was affected most as more new rental units came on market than at any time since WWII: Though SF still has the highest rents in the country, they have dropped from their peak in 2015.


Chart 6: To a large degree due to big changes in tenant eviction and condo conversion laws, the TIC market has gone through a large decline in sales volume. It is also true that after decades of turning multi-unit buildings into condos and TICs, the supply of such properties available to do so has declined. Generally speaking, TIC median sales prices plateaued from 2015 to 2016 at about 14% below the median condo price.


————————————————————

San Francisco Luxury Home Market
Three sample charts from our big report on the high-priced home segment. Generally speaking, the luxury market has cooled more than the more affordable segments, and the luxury condo market has cooled more than the luxury house market. This is mostly due to the recent surge of new-construction luxury condos onto the market in the city.

The first two charts below are snapshots of either the house or condo segment of the luxury market in two of our major districts.


This next chart illustrates one of the bigger changes in SF high-end home markets. Many more listings, resale luxury condos in particular, are expiring or being withdrawn from the market without selling.


Our full report is here: Luxury Home Market of San Francisco

————————————————————

Interest Rates
Constantly shifting economic and political factors continue to affect rates: Mortgage interest rates are significantly up since the election, fluctuating up and down since the year began, but still far below historical norms. This is a factor everyone is watching carefully because of its potential impact on affordability, already a big issue in the Bay Area.

Apartment Building (Multi-Unit Residential) Sales
We have also released our quarterly report on the multi-unit residential property markets of San Francisco, Marin and Alameda Counties: Bay Area Apartment Building Market. Below is one of its many analyses.


————————————————————
All our reports can be found on our redesigned website: Paragon Market Reports

Using, Understanding and Evaluating Real Estate Statistics

If you will forgive a little celebrating on our part: In the last two quarters, Paragon sold more San Francisco residential and multi-unit residential real estate than any other brokerage (as reported to MLS, per Broker Metrics), even though we have far fewer agents than many of our competitors.

If you have any questions or comments regarding this report, or if assistance can be provided in any other way, please call or email.


————————————————————


It is impossible to know how median and average value statistics apply to any particular home without a specific comparative market analysis, which we are happy to provide upon request.

These analyses were made in good faith with data from sources deemed reliable, but may contain errors and are subject to revision. It is not our intent to convince you of a particular position, but to attempt to provide straightforward data and analysis, so you can make your own informed decisions. Median and average statistics are enormous generalities: There are hundreds of different markets in San Francisco and the Bay Area, each with its own unique dynamics. Median prices and average dollar per square foot values can be and often are affected by other factors besides changes in fair market value. Longer term trends are much more meaningful than short-term.


© 2017 Paragon Real Estate Group

No one knows San Francisco real estate better than Paragon.

Paragon Real Estate Group
www.paragon-re.com/

Pota Perimenis
Lic# 01117624
1400 Van Ness Avenue
San Francisco, CA 94109
Direct 415-738-7075
Cell 415-407-2595
pperimenis@paragon-re.com
www.sfcityhomes.com


Rent vs. Buy


San Francisco Rent vs. Buy Comparison


Approximate Scenario Calculation
Paragon Real Estate, March 2017Comparing the PURCHASE of a 2-bedroom, 2-bath, 1080 square foot condo at the
2016 median San Francisco sales price of $1,150,000, to the RENTAL of a comparable apartment at a San Francisco market rate of approx. $4400 to $4600/month rentMedian sales price per 2016 MLS sales; monthly rent based on averaging Zillow,
RealFacts & Rent Jungle asking rent data in late 2016/early 2017


Rent vs. buy calculations depend on a wide variety of financial data and projections – prevailing and future interest, property tax, inflation, home-appreciation and investment-return rates – as well as data pertinent to you and your specific purchase, such as your marginal income tax rate and how long you plan to stay in the home you purchase. Altering any of these factors can change the calculation significantly. And, of course, one could not consider buying under the scenario below if one did not have the cash for the initial down-payment and closing costs.

We have tried to be conservative in our projections, for example, putting in an annual home appreciation rate of 3%, when for the last 30 years, San Francisco has seen an average, compounding appreciation rate of 5 to 6%. (Since 2011, the SF median house price has appreciated about 90%.) However, appreciation rates vary enormously in shorter time periods, and can go negative in downturns, such as occurred in 2008, and the ability to ride out down markets can make a big difference in financial returns. We believe we have used similarly conservative inflation and investment-return rates, and used the prevailing average, conforming mortgage interest rate in February 2017.

How long you plan to stay in the home you purchase is an important factor, because the longer you stay, the more of your monthly mortgage payment goes to principal pay-down, and the longer the period of amortization of closing costs.

The below calculations were created using a calculator Paragon licenses from a third party. We strongly recommend that you consult your accountant or financial planner to discuss your financial situation, potential tax advantages and other specific pros and cons of purchase as they relate to your situation. What follows is only one scenario and should not be relied upon to make important decisions. The New York Times also has a very flexible rent vs. buy calculator, which allows you to put in your own data, rate projections, and purchase scenarios: NYT Rent vs. Buy Calculator.


The Purchase Scenario and Financial Parameters

Estimated Loan Information
Your total monthly housing payment was estimated at $6,239.38. Your down payment was estimated at $230,000 purchasing a home priced at $1,150,000. This is for a 30 year mortgage at 4.2% in the amount of $920,000. Your total purchase closing costs are estimated at $16,800.00 (about 1.5% of the purchase price).

In the analysis, the current monthly market rent is set at $4,400. The expected inflation rate of 2% annually was used to estimate future rent ($4488 in the second year) and property taxes (though in California, increases in property taxes are strictly limited due to Prop 13 regulations). The rate of return used for the investment of down-payment monies by renters was 3% per year after taxes – obviously, this will vary widely by type of investment and time period. (If one had their money in CDs, one could only dream of an after-tax return of 3% in recent years. On the other hand, stocks have had a terrific run.)

After adjusting for your initial tax saving based on interest and property tax deductibility, and for the principal pay-down portion of your monthly housing cost, your net housing cost payment is reduced from $6,286 to $3,867, well below the market rate rent for a similar apartment of $4400 to $4600.


Note that with condo ownership, the greatest portion of home insurance cost is covered in the monthly HOA association dues & maintenance. For a 2BR/2BA condo, these dues typically run $350 to $550; we added a little bit to the calculation to cover the personal property portion of the insurance not covered by the HOA policy.

According to the above calculation, using the specified rates of appreciation, inflation and investment returns, your home purchase breaks even in approximately 2.7 years.

This is based on your home’s estimated equity minus 6% closing costs when you sell your home. It also assumes your home will appreciate at 3% per year and you have an income tax rate of 25%. If you cannot remain in your home for at least 3 years you should strongly consider continuing to rent.

The breakeven point was calculated by examining how long it would take to create enough equity in your home to exceed the value of investing your cash on hand (at 3% after-tax return). We also accounted for differences in your monthly rent and house payments.


Building Equity

Typically, by far the most important financial advantage of buying is the increase in home equity (and your net worth) over time, as is calculated in the last column below. Firstly, there is the monthly reduction of your loan amount, which increases your home equity. Secondly, there is the effect of inflation/ home appreciation on the value of your home over time. Since the purchase was made using a 20% cash down-payment, there is also the significant financial advantage of leverage: When home values go up 10%, the increase in your cash down-payment is approximately 50% (though there is an adjustment for closing costs).


It’s worth noting that with a fixed rate mortgage rate (and Prop 13 limitations on property tax rate increases), one’s housing costs stay relatively stable over time, while rents typically continue to increase much more quickly. As the years pass, this can add substantially to the benefit of buying.

As mentioned earlier, the New York Times also has an excellent rent vs. buy calculator: NYT Rent vs. Buy Calculator. We could not use screenshots due to copyright law, however when we ran a very similar scenario through its calculator, based on living in the condo purchased for 5 years, it came to the conclusion that if you could rent a similar home to one you were buying (for $1,150,000), at a rent of $3700 per month or less, then you should probably rent. That is, it came to a very similar conclusion to the calculator we used above, that with a market rent in the $4400 to $4600 range, buying was an option worth serious consideration.

The NYT also published this excellent editorial on the financial implications of homeownership:
NYT Homeownership & Wealth Creation


—————————————————–

Typically, the purchase of a new home is one of the largest financial transactions and investments of one’s life. Whatever home you purchase should work for you now—fulfilling your basic housing requirements at an affordable monthly cost. We also suggest retaining enough monies after purchase for a sufficient reserve fund.

Historically, San Francisco real estate has generally proven to be an excellent investment over the longer term (and sometimes, over the shorter term, such as if you had purchased in 2011 and sold today). This is due to the advantages of leverage (the ability to finance much of the purchase); the significant tax benefits of home ownership; economic, demographic and geographic conditions in the city; and long-term appreciation trends. Among other things, real estate is usually considered one of the best hedges against inflation.

If one doesn’t “refinance out” increasing home equity, home ownership (as you pay down the principal balance on your mortgage month by month) typically acts as a “forced” savings account to build household wealth, as mentioned in the NYT editorial referenced above. In addition, the $250,000/$500,000 tax exemption on capital gains on the sale of your principal residence can supercharge the financial return when you do sell. (We cannot think of another investment with this advantage.)

Here are some questions to consider:

  • How long do you plan to own the home you wish to purchase? Buying and selling in the short term always entails more risk and makes it more difficult to recoup closing costs on purchase and sale.


  • Are current interest rates advantageous for buyers? Lower interest rates make an enormous difference in the ongoing costs of homeownership (and your return on investment). A long-term fixed rate at a low interest rate is hugely advantageous to buyers.


  • Apropos of this rent vs. buy analysis: How does the cost of home ownership, with existing tax benefits, compare to renting? How does it compare in the calculation of building your financial assets over time?


  • How important is it to you to own the home you live in, with all that implies—security, control, pride of ownership, the ability to make changes and improvements according to your own tastes and needs?


Any investment has both potential risks and rewards—which only you can weigh according to your financial circumstances, your tolerance for risk, your timeline, and your projection of future economic trends. If you have to sell during a down market, the financial ramifications can be negative. Please consult your accountant for a more detailed analysis of the above factors.


————————————————————————–


This report was created in good faith using data and analytical tools deemed reliable, but it may contain errors and is subject to revision. It is not meant to convince anyone to do anything, but to simply provide additional decision-making tools and information. Ultimately, the end result of any investment will depend on the exact purchase and sell dates.

Information and interactive calculators are made available to you as self-help tools for your independent use and are not intended to provide investment advice. We cannot and do not guarantee their applicability or accuracy in regards to your individual circumstances. All examples are hypothetical and are for illustrative purposes. Tax law can change at any time, which could impact the calculations provided above. We encourage you to seek personalized advice from qualified professionals – accountants, financial planners, and loan agents – regarding all personal finance, tax and loan issues.


© 2017 Paragon Real Estate Group

No one knows San Francisco real estate better than Paragon.

Paragon Real Estate Group
www.paragon-re.com/

Pota Perimenis
Lic# 01117624
1400 Van Ness Avenue
San Francisco, CA 94109
Direct 415-738-7075
Cell 415-407-2595
pperimenis@paragon-re.com
www.sfcityhomes.com


What Costs How Much Where in San Francisco?


Paragon Real Estate Group
 

Paragon Real Estate Group

What Costs How Much Where in San Francisco
& Other Angles on the City Real Estate Market

March 2017 Report


————————————————————

Where to Look to Buy
for the Price You Want to Pay

Below are 3 charts from our updated 9-chart report that breaks down which neighborhoods one is most likely to find a home within a specific price range, whether house or condo. The report covers homes from under $1 million to over $5 million.

If you want to buy a house under a million dollars, one is now mostly limited to the neighborhoods that run across the southern border of San Francisco.


The full report is here: San Francisco Neighborhood Affordability


What Can I Buy for $1,200,000 or $2,000,000?


Below are illustrations of the wide range of homes (and, to some degree, lifestyles) one might buy at two different price points in the city. The higher a home is located on the vertical axis of the charts, the greater its square footage. (Note that the bathroom specifications can be a little screwy, for example 1.3 or 1.7 baths, because these are averages of homes sold at these approximate price points.)

$1,200,000 is approximately the median home price in San Francisco if one combines both houses and condos. For that price, one could buy a 4-bedroom, 2135 square foot house in Ingleside or Oceanview, or a 3-bedroom, 1566 square foot house in Outer Parkside, or a 2-bedroom, 1070 square foot condo in Pacific Heights.


For $2 million, one could purchase a gracious 4-bedroom, 2650 square foot, detached house on a large lot in Forest Hill, or a classic 2-level, 3-bedroom, 1900 square foot condo with a garden in the Marina, or a 2-bedroom, 1350 square foot, luxury high-rise condo with spectacular views in South Beach.


————————————————————

Quick Market Update


December through February constitute the slowest sales months of the year and are subject to significant seasonal issues, so coming to definitive conclusions about where the market is heading based on their data is difficult. However, for what it is worth, comparing the 3-month period to the same period a year ago, the median house sales price at $1,290,000 is up 4.5% and the median condo sales price at $1,050,000 is down 4.1%. As mentioned in earlier reports, the big dynamic affecting the condo market has been the surge of new-construction inventory hitting the market in the past year, just as demand started to soften. The inventory of new condos for sale is now at its highest level in 7 years, and, not surprisingly, this is impacting the supply and demand dynamic for condos, especially in those districts where new construction is concentrated. On the other hand, the inventory of house listings continues to remain at record lows, keeping that market, especially its more affordable segments, quite competitive.

This chart below reflects the latest Case-Shiller Home Price Index for the 5-county metro area house market, going through the end of 2016. It illustrates how in 2016, more affordably-priced houses continued to appreciate significantly, while the most expensive segment basically plateaued. Generally speaking, this is a common dynamic around the Bay Area.


San Francisco Median Home Price Trends since 1994
For a longer-term perspective

New Listings Begin Pouring onto the Market Again


The period of March through May is usually the most active selling season of the year, and we will soon have more conclusive indications of where the 2017 market is headed. This next chart illustrates the typical, dramatic surge of new inventory that fuels sales during this season.


————————————————————

San Francisco Home Sales with Views


SF is a city known for its wide variety of gorgeous views, which can add substantially to the value of a home so graced. Of all the house sales in 2016, only 88 reported having a Golden Gate Bridge view, and some of those were peek-a-boo views (i.e. if you lean out the bathroom window on the top floor) or roof deck views. A full-on, panoramic view of the GG Bridge from Pacific Heights adds over $1 million to the median house price there. Unsurprisingly, condos have the most, and most spectacular, views due to high-rise condo projects.

San Francisco Home Sales by Bedroom Count

————————————————————

Renting vs. Buying in San Francisco

Comparing the purchase, with 20% down, of a 2-bedroom/2-bath condo
with the rental of a comparable apartment in San Francisco


Every year or so, we like to update this analysis using current median sales prices and average rents for comparable 2-bedroom condos and apartments. Rent vs. buy calculations can be performed a wide variety of ways, and results will depend on your own financial circumstances and economic projections, which you should review with your accountant. There is a versatile calculator published by The New York Times, where one can play with all the financial factors involved: NYT Rent vs. Buy Calculator. Our analysis represents simply one scenario, which is meant to be more of an invitation to perform your own calculations than a definitive conclusion on the subject.

Depending on your circumstances, plans and predictions for the future, renting may well be the best choice for you. However, low interest rates, high rents, loan principal pay-down over time, inflation and appreciation rates, and the large tax benefits that accrue to homeownership typically give a large long-term financial advantage to buying, if you have the funds for the cash down-payment. (Of course, as with any investment, financial results will ultimately depend on your purchase and sale dates.) This next chart compares net monthly housing costs between renting and buying after tax deductions and principal repayment are accounted for. Our full report goes into much greater detail, such as the accumulation of wealth, in the form of home equity, over time. Please contact me if you would like a copy.


————————————————————


Other recent Paragon reports you might find interesting:

A Comprehensive Survey of the 2016 Market in San Francisco

San Francisco Luxury Homes Market Report

A Survey of Real Estate Markets around the Bay Area

Bay Area & San Francisco Home Price Maps


————————————————————

It is impossible to know how median and average value statistics apply to any particular home without a specific comparative market analysis, which we are happy to provide upon request.

These analyses were made in good faith with data from sources deemed reliable, but may contain errors and are subject to revision. It is not our intent to convince you of a particular position, but to attempt to provide straightforward data and analysis, so you can make your own informed decisions. Median and average statistics are enormous generalities: There are hundreds of different markets in San Francisco and the Bay Area, each with its own unique dynamics. Median prices and average dollar per square foot values can be and often are affected by other factors besides changes in fair market value. Longer term trends are much more meaningful than short-term.


© 2017 Paragon Real Estate Group
 
No one knows San Francisco real estate better than Paragon.
Paragon Real Estate Group
www.paragon-re.com/

Pota Perimenis
Lic# 01117624
1400 Van Ness Avenue
San Francisco, CA 94109
Direct 415-738-7075
Cell 415-407-2595
pperimenis@paragon-re.com
www.sfcityhomes.com