
The Hottest Real Estate Markets in San Francisco
12-Year Trends in Neighborhood Home Prices
Advantages to Buying during the Holiday Slowdown
————————————————————

The October 2017 median house sales price in San Francisco surged over $100,000 above the previous peak in May to hit a new high at $1,588,000 (sales reported by 11/5/17). A major factor was that October was a record-breaking month for luxury house sales, and more sales of expensive homes pull up the median price. The median condo sales price, at $1,180,000, was a tad below the recent peak hit in August, and luxury condo sales reported to MLS were well below their peak sales volume reached this past June. The luxury market is covered further down in this report.
We prefer measuring median price trends by periods longer than 1 month (which are prone to fluctuate considerably without great meaningfulness), and the below chart illustrates rolling 3-month median price trends for houses ($1,415,000 for August, September, October) and condos ($1,175,000), and 6-month rolling median prices for TICs ($982,500). Remember that median price changes are not perfect measurements of changes in fair market value.

Note that the numbers on this chart all refer to a January 2000 price of 100. So, the latest Bay Area reading of 238 means that home prices here have appreciated, according to Case-Shiller, by 138% since January 2000. National home prices appreciated by 95% during that period.

————————————————————
San Francisco Neighborhood & Realtor District Map

San Francisco Market Overviews
SF House, Condo & TIC Sales by Realtor District

SF Home Sales by Price Segment
Home sales under $1m are dwindling, and 70% of those are condos or TICs.
The highest number of sales is now in the $1m to $1.5m price segment.

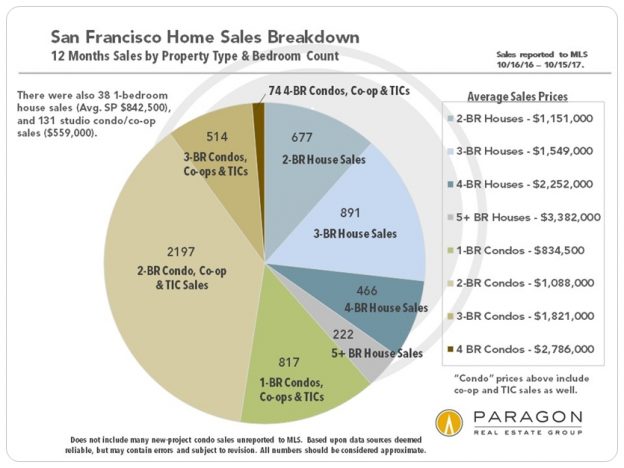
Sales by Property Type & Bedroom Count

Link to Chart: Unit Sales Trends since 2007
————————————————————
San Francisco Luxury Homes Market
Luxury house sales in October were concentrated, highest to lowest numbers, in the Pacific Heights-Marina district (D7), the Noe, Eureka & Cole Valleys district (D5), and the Lake Street-Sea Cliff district (D1). These 3 districts contained about 80% of the sales. Other luxury house sales were scattered singly around the city: Russian Hill, Telegraph Hill, Inner Sunset, Potrero Hill, Mission, Bernal Heights, Hayes Valley and Lower Pacific Heights. The 3 districts that dominated luxury condo sales, with 9 to 11 sales each, were the Russian & Nob Hills district (D8), Pacific Heights-Marina (D7), and the South Beach-Mission district (D9). There were also a handful of sales in Noe-Eureka Valley (D5), and a couple in Lake Street-Richmond (D1). (Sales reported by 11/5/17.)


————————————————————
Median Home Price Trends by Neighborhood
2005 to Present
Neighborhoods with current median house prices under $1.5m have generally
seen smooth, consistent appreciation since the recovery began in 2012.

Neighborhoods with current median house prices of $1.5m to $3m:
Some of these saw median price dips in 2016, but recovered in 2017

Two-Bedroom Condos – Median Sales Price Trends:
Some SF condo markets saw significant dips in 2016, but recovered in 2017

————————————————————
SF Neighborhoods & Property Types: Hottest to Coolest Markets
Note: These are general statistics and small differences between districts or market segments are not particularly significant.
First houses and then condos: The higher the %, the hotter the market.
Some of these percentages are staggeringly high.

Overbidding in the condo market is not quite as frantic as with houses.

Months Supply of Inventory & Average Days on Market
First houses, then condos: The lower the statistics, the hotter the market.


————————————————————
Hottest to Coolest by Price Segment & Property Type


————————————————————
Seasonality & the SF Homes Market
Advantages to buying during the mid-November to mid-January slowdown
The dark red lines in the charts below illustrate these big, seasonal market shifts.
Price Reductions Soar in October/November

Overbidding Declines


Average Days on Market Increases
Making sellers more willing to negotiate

Inventory Drops
But hundreds of listings remain on market

Median Home Prices Drop
due to a number of factors, including a reduction in demand

Link to SF Neighborhood Home Price Tables
Link to our SF luxury house market update
Link to our SF luxury condo market update
Link to our apartment building market report
Please let us know if you have questions or we can be of assistance in any other way. Information on neighborhoods not included in this report is readily available.
These analyses were made in good faith with data from sources deemed reliable, but may contain errors and are subject to revision. It is not our intent to convince you of a particular position, but to attempt to provide straightforward data and analysis, so you can make your own informed decisions. Median and average statistics are enormous generalities: There are hundreds of different markets in San Francisco and the Bay Area, each with its own unique dynamics. Median prices and average dollar per square foot values can be and often are affected by other factors besides changes in fair market value. Longer term trends are much more meaningful than short-term. Late-reported MLS activity may change the statistics for the last month in some charts.
| Paragon Real Estate Group www.paragon-re.com/ |
|
|